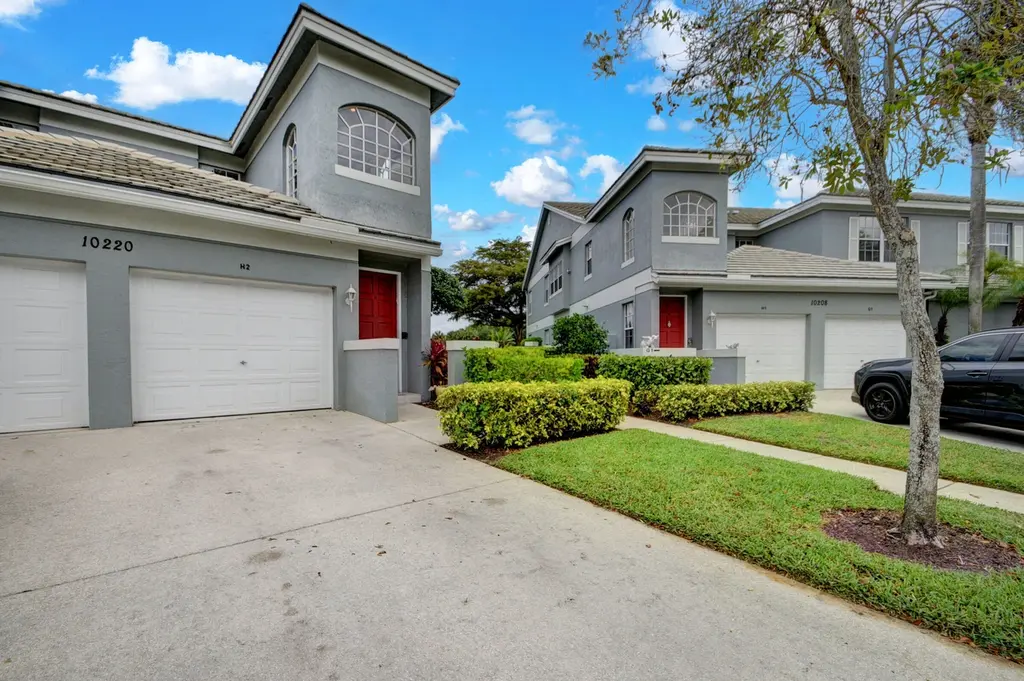
10220 Andover Coach Cir Unit H2 · Wellington, FL
Flood risk 1/10 · Minimal
- FEMA flood zone
- X (unshaded)
- Chance of flooding over 30 yrs
- 0.0%
- Est. flood insurance / yr
- $507 – $1,088
Fire risk 2/10 · Minimal
- Est. fire insurance / yr
- $947 – $1,759
Heat risk 9/10 · Severe
- Hot days now (above 106°F)
- 7 days/yr
- Hot days in 30 yrs
- 25 days/yr
Wind risk 10/10 · Severe
- Chance of severe wind over 30 yrs
- 99.0%
Air-quality risk 2/10 · Minimal
- Unhealthy air days now
- 0 days/yr
- Unhealthy air days in 30 yrs
- 2 days/yr
Risk factors via First Street. Map © Google.
Why this score? — see what drove the B+ grade
The composite is a weighted blend of 9 inputs, each scored 0–100. Each bar is that input's sub-score; the figure is the points it added to the 100-point composite (weight × sub-score).
- Cash flow +30.0/30.0
- 1% rule +10.0/10.0
- DSCR +10.0/10.0
- ARV discount +7.5/15.0
- Appreciation +4.7/10.0
- Schools +4.3/10.0
- Livability +3.7/5.0
- Rent growth +2.5/5.0
- Condition / age +2.5/5.0
$175,000
🖨 Deal sheet (PDF) 📄 Offer letter ✓ Due diligence
Listing remarks
Light and Bright! New Air Conditioner in 2024. Glass enclosed screened and covered patio. Silver Equity, with all of the country club amenities except golf. (pay less annually) Golf course and Lake views with large space between the buildings. This great room style home has removed the 1/2 wall for additional living space. (no arches) The primary bedroom, breakfast room and great room overlook the views surrounding this home. Glass enclosed petio keeps it insulated & clean from weather conditions all year long. Additional electrical outlets, recessed lighting, and paneled cabinets. GE profile appliances & tiled counters. Primary bedroom has 2 walk in closets, a large linen close
Key facts
- $1,159 HOA
- Garage
- Community pool
Property features AI
Finance
- Other: Large community with many units (community size listed)
- Financial info: Pets allowed (restrictions may apply: breed, number, size limits)
- HOA & community: Association-managed community (GRS Management; Wycliffe HOA); Monthly HOA fee; Association fee covers cable TV, internet, insurance, grounds and structure maintenance, security, common areas and taxes, roof repairs, recreation facility and pool service; Community amenities include clubhouse, fitness center, pool (including heated pool), spa/hot tub, sauna, tennis courts, pickleball, basketball court, bocce ball, putting green, golf course, cabana, game room, business center, cafe/restaurant, library, lobby, sidewalks, management on site, manager on site, maintenance, recreation facilities, internet included, security, elevator(s)
Exterior
- Parking: Attached 1-car garage with garage door opener; One covered space; Additional driveway and on-street parking
- Security: Gated community with guard; Security system (owned); Security patrol; Fire alarm; Smoke detectors
- Utilities: Public water; Public sewer; Cable connected; Phone connected; Electricity available; Underground utilities; Water connected; Sewer connected
- Home design: Condominium; Two-story building; Resale property; Faces southwest
- Construction: Built with CBS construction materials; Concrete/flat/tile roof
- Exterior features: Glass-enclosed patio/porch; On golf course; Private paved road with private maintenance; Waterfront community (no direct waterfront feature listed)
Interior
- Kitchen: Dishwasher; Electric range; Microwave; Refrigerator; Garbage disposal; Electric water heater
- Bedrooms: Three bedrooms on the main level
- Flooring: Carpet; Ceramic tile
- Bathrooms: Two full bathrooms
- Heating & cooling: Central electric heating; Central air conditioning; Ceiling fans
- Interior features: Entrance foyer; High ceilings with vaulted ceiling(s); Walk-in closets; Split bedroom layout; Closet cabinetry; Upstairs living area; Intercom
- Laundry & utility: Indoor laundry in a laundry closet
Neighborhood map
What this means for you Summary
Snapshot
- This is a 3-bed/2.0-bath condo listed at $175k.
Deal economics
- At list price, monthly cash flow is $1k ($16k/yr) — positive.
- The deal already cash-flows at list — no discount required.
- Meets the 1% rule at list price ($4k rent vs $175k).
- Recommended offer: $170k (3.0% below list) — sets the bar for market timing.
Location & tenants
- Location reads 73/100 on livability (#294 in FL, #4,986 nationally) — a middle-class / working-renter tenant base. Strengths: crime A+, employment A+, housing A+; Watch: amenities F, commute F, cost of living F.
- Palm Beach (suburban): math 46% / reading 53% proficiency, ranked #34 of 73 in FL (top 47%) — families likely to look elsewhere, expect single-tenant / working-renter base with shorter leases.
- Zoned schools: Panther Run Elementary School (math 85% / reading 82%, grade A+, #60 of 2,144 statewide, top 3%, 787 students, 19% FRL); Polo Park Middle School (math 65% / reading 68%, grade A-, #84 of 571 statewide, top 16%, 1,156 students, 33% FRL); Palm Beach Central High School (math 42% / reading 55%, grade D, #198 of 667 statewide, top 30%, 2,980 students, 40% FRL) — zoned schools average 31% FRL vs 52% district-wide (21 pts lower); this property's tenant base skews higher-income than the district average.
- Zoned-school proficiency averages 66% at this address vs 50% district-wide (+17 pts) — the actual schools serving this property are materially stronger than the Palm Beach average implies; a family-tenant draw the district grade alone would hide.
- Market conditions: 168 active listings in the ZIP; 40 comparable units currently listed for rent nearby; rentals at typical pace (median 25d on market — plan ~3-4 weeks tenant-placement turnaround); 3,974 units permitted in Palm Beach County in 2024 (1,012 in 5+ unit buildings).
Forward outlook
- In year one you build about $29 of equity ($1k loan paydown + $-1k appreciation (-0.7% local appreciation)).
- Palm Beach County population projected at +30% by 2050 — long-run rental-demand tailwind backs the buy-and-hold thesis.
- At projected returns (-0.7% appreciation + 3.0% rent growth), your $49k cash investment doubles in ~3 years — after that, you're playing with house money.
Negotiation context
- It's been on market 42 days — a 3% lower offer ($170k) is reasonable based on typical stale-listing flexibility.
- 10 sale attempts since 19y ago with the ask held roughly flat each time — persistent listings suggest the price (not the market) is what's stuck; bring a comps-based counter.
- Current owner paid $76k; list at $175k implies a 130% gain — meaningful room to come down on a strong offer.
Risks & watch-outs
- Watch-outs: HOA is 26% of rent.
- Climate carrying-cost: severe wind risk, 99% chance of damaging wind over 30y; extreme-heat days projected 7→25/yr by 2055 (HVAC capex compounding) — expect insurance premiums to compound above CPI over the hold.
Questions for the listing agent
- It's been on market 42 days. Have you received any prior offers? Is the seller open to a 3% concession, seller financing, or rate buy-down credit?
- What does the HOA fee cover, when was the last increase, and are there any pending special assessments or reserve-fund shortfalls?
- Any open or pending special assessments — roof, HVAC, plumbing, elevator, façade? What's the per-unit balance and payoff schedule, and is the seller paying it off at close or rolling it to the buyer?
- Is there a deadline driving the sale (1031 exchange, divorce, estate, relocation)? That informs how much negotiation room exists.
- Schools are A-rated — typically a magnet for longer-tenancy family renters. What's the average tenant stay here, and is there a school-zone premium baked into asking?
- What's the average days-on-market for RENTAL listings here right now (not sales)? A rising rental-DOM trend means longer vacancies and softer asking-rent achievability than the comps imply.
- What's the recent tenant-quality profile in this submarket — average credit score on applications, eviction rate, late-payment / NSF rate, and stable-employment percentage? A property-management company in the area should have these aggregated.
- How much new apartment / multifamily construction is in the pipeline within 1–3 miles? Heavy new supply (>2% of stock underway) typically softens rents 12–24 months out; light construction supports rent growth.
Investment metrics
- 1% rule
- 2.55% ✓
- Cap rate
- 15.21%
- Cash-on-cash
- 31.85%
- DSCR
- 2.42
- GRM
- 3.3
CMA / ARV
No comps found within radius.
Projected returns pro-forma
-0.67% appreciation · 3.0% rent growth · sell at horizon
- IRR
- 31.4%
- Equity multiple
- 2.49×
- Total profit
- $72,916
- Equity at exit
- $44,988
- IRR
- 35.9%
- Equity multiple
- 4.88×
- Total profit
- $189,907
- Equity at exit
- $49,623
Cash invested: $49,000 (down + closing). Projections, not guarantees.
Landlord ↔ Tenant lean methodology
- Overall (STATE)
- 87 Strongly Landlord-Friendly
- State Florida
- 87 Strongly Landlord-Friendly · R+3
- County
- — inherits STATE
- City
- — inherits STATE
ZIP-level market 33449
- Home prices YoY
- -0.2%
- Active inventory
- 168
- Price-to-rent
- 3.3×
Monthly cashflow live
- Estimated rent
- $4,464 high interval (Pro) →
- Mortgage (P&I)
- −$918
- Tax from tax record
- −$77 /mo · $922/yr
- Insurance
- −$73
- HOA
- −$1,159
- Vacancy / Maint / Mgmt
- −$938
- Net cashflow
- $1,300
Break-even live
Sensitivity live
| Price | -10% $1,399 | -5% $1,350 | +0% $1,300 | +5% $1,251 | +10% $1,201 |
|---|---|---|---|---|---|
| Rent | -10% $948 | -5% $1,124 | +0% $1,300 | +5% $1,477 | +10% $1,653 |
| Rate | -1.0pp $1,388 | -0.5pp $1,345 | base $1,300 | +0.5pp $1,255 | +1.0pp $1,209 |
UW: 25.0% down · 7.5% · 30yr · 1.5% tax · 5.0% vac · 8.0% maint · 8.0% mgmt
Financing live
Cash to close
- Down payment
- $43,750
- Closing costs
- $5,250
- Reserves months
- —
- Total cash needed
- —
Loan-product check · same deal, 3 products live
Conventional
25% down · 7.5% · 30yr
- Down + closing
- —
- Monthly P&I
- —
- Monthly cashflow
- —
- DSCR
- —
- Eligible?
- —
Personal DTI + credit; lowest rate.
DSCR
20% down · 8.5% · 30yr
- Down + closing
- —
- Monthly P&I
- —
- Monthly cashflow
- —
- DSCR
- —
- Eligible?
- —
No personal income docs; deal must DSCR.
Hard money
10% down · 12.0% · 12mo
- Down + closing
- —
- Monthly P&I
- —
- Monthly cashflow
- —
- DSCR
- —
- Eligible?
- —
Short-term bridge; refi at stabilization.
Rent comps 40 comps
| Address | Beds | Baths | Sqft | Rent | $/sqft | DOM | Units | Dist |
|---|---|---|---|---|---|---|---|---|
| 10173 Andover Coach Cir Unit G2 Lake Worth, FL | 3.0 | 2.0 | 1807 | $3,500 | $1.94 | 25d | 1 | 0.05mi |
| 10303 Andover Coach Cir Unit A1 Wellington, FL | 2.0 | 2.0 | 1420 | $5,500 | $3.87 | 25d | 1 | 0.06mi |
| 4553 Barclay Fair Way Lake Worth, FL | 3.0 | 3.0 | 2278 | $4,000 | $1.76 | 17d | 1 | 0.20mi |
| 4553 Barclay Fair Way Lake Worth, FL | 3.0 | 3.0 | 2278 | $4,000 | $1.76 | 25d | 1 | 0.20mi |
| 4528 Barclay Fair Way Lake Worth, FL | 3.0 | 2.0 | 2147 | $8,000 | $3.73 | 0d | 1 | 0.20mi |
| 4841 Exeter Estate Ln Lake Worth, FL | 3.0 | 3.0 | 2567 | $5,000 | $1.95 | 25d | 1 | 0.52mi |
| 10139 Wellington Parc Dr Lake Worth, FL | 4.0 | 3.0 | 2076 | $3,795 | $1.83 | 3d | 1 | 0.72mi |
| 10415 Saint Germain Ct Wellington, FL | 4.0 | 3.5 | 2469 | $6,500 | $2.63 | 22d | 1 | 0.74mi |
| 10415 Saint Germain Ct Wellington, FL | 4.0 | 3.5 | 2469 | $6,500 | $2.63 | 3d | 1 | 0.74mi |
| 10283 Wellington Parc Dr Lake Worth, FL | 4.0 | 3.0 | 2076 | $3,600 | $1.73 | 25d | 1 | 0.76mi |
| 10385 Wellington Parc Dr Lake Worth, FL | 3.0 | 2.5 | 1783 | $3,250 | $1.82 | 20d | 1 | 0.77mi |
| 10457 Wellington Parc Dr Lake Worth, FL | 3.0 | 2.5 | 1688 | $3,200 | $1.90 | 25d | 1 | 0.78mi |
| 3470 Custer Ave Lake Worth, FL | 3.0 | 2.0 | 2040 | $4,500 | $2.21 | 25d | 1 | 0.80mi |
| 10348 Wellington Parc Dr Lake Worth, FL | 3.0 | 2.5 | 2060 | $3,300 | $1.60 | 25d | 1 | 0.81mi |
| 10426 Wellington Parc Dr Unit 1 Wellington, FL | 4.0 | 2.5 | 2587 | $3,650 | $1.41 | 25d | 1 | 0.81mi |
| 10450 Wellington Parc Dr Wellington, FL | 3.0 | 2.5 | 1983 | $3,350 | $1.69 | 25d | 1 | 0.81mi |
| 4173 Imperial Club Ln Lake Worth, FL | 3.0 | 2.5 | 1989 | $2,995 | $1.51 | 19d | 1 | 0.84mi |
| 10640 Oak Meadow Ln Lake Worth, FL | 4.0 | 3.0 | 2727 | $7,500 | $2.75 | 18d | 1 | 0.84mi |
| 9676 Eagle Point Ln Lake Worth, FL | 4.0 | 3.0 | 2815 | $5,800 | $2.06 | 25d | 1 | 0.85mi |
| 10880 Northgreen Dr Lake Worth, FL | 3.0 | 3.5 | 2929 | $13,000 | $4.44 | 8d | 1 | 0.86mi |
| 3366 Harness Cir Lake Worth, FL | 3.0 | 2.0 | 2340 | $3,750 | $1.60 | 11d | 1 | 0.86mi |
| 11065 Stone Creek St Wellington, FL | 4.0 | 2.5 | 2478 | $4,500 | $1.82 | 25d | 1 | 0.96mi |
| 3306 Fargo Ave Lake Worth, FL | 3.0 | 2.0 | 2370 | $5,500 | $2.32 | 25d | 1 | 0.98mi |
| 11137 Grandview Mnr Wellington, FL | 4.0 | 3.0 | 2194 | $9,500 | $4.33 | 17d | 1 | 1.05mi |
| 10567 Paso Fino Dr Lake Worth, FL | 3.0 | 2.0 | 1655 | $3,950 | $2.39 | 25d | 1 | 1.19mi |
| 10591 Paso Fino Dr Lake Worth, FL | 3.0 | 2.0 | 1764 | $3,500 | $1.98 | 6d | 1 | 1.22mi |
| 4790 Navali Dr Lake Worth, FL | 3.0 | 2.5 | 1708 | $3,200 | $1.87 | 25d | 1 | 1.25mi |
| 9006 Zevon Ct Lake Worth, FL | 3.0 | 2.5 | 2032 | $3,300 | $1.62 | 25d | 1 | 1.25mi |
| 8985 Gulf Run Way Lake Worth, FL | 3.0 | 2.5 | 2049 | $3,400 | $1.66 | 0d | 1 | 1.26mi |
| 4839 Navali Dr Lake Worth, FL | 3.0 | 2.5 | 2124 | $3,300 | $1.55 | 25d | 1 | 1.26mi |
| 4194 Bluff Harbor Way Wellington, FL | 3.0 | 2.5 | 2152 | $3,999 | $1.86 | 0d | 1 | 1.27mi |
| 4018 Bluff Harbor Way Wellington, FL | 4.0 | 2.5 | 2160 | $4,300 | $1.99 | 8d | 1 | 1.28mi |
| 4178 Bluff Harbor Way Wellington, FL | 3.0 | 2.0 | 1904 | $3,800 | $2.00 | 25d | 1 | 1.28mi |
| 10652 Ivanhoe Ln Wellington, FL | 4.0 | 2.5 | 2746 | $6,000 | $2.18 | 25d | 1 | 1.29mi |
| 8658 Vista Greens Ct Lake Worth, FL | 4.0 | 2.0 | 2372 | $6,000 | $2.53 | 0d | 1 | 1.30mi |
| 8951 Kingsmoor Way Lake Worth, FL | 3.0 | 2.5 | 1918 | $3,500 | $1.82 | 5d | 1 | 1.35mi |
| 9108 Kingsmoor Way Lake Worth, FL | 3.0 | 2.5 | 1918 | $3,400 | $1.77 | 11d | 1 | 1.37mi |
| 10731 Ivanhoe Ln Wellington, FL | 4.0 | 2.5 | 2800 | $8,500 | $3.04 | 4d | 1 | 1.38mi |
| 8807 Antarus Dr Lake Worth, FL | 3.0 | 2.5 | 1954 | $3,700 | $1.89 | 15d | 1 | 1.38mi |
| 8807 Antarus Dr Lake Worth, FL | 3.0 | 2.5 | 1954 | $3,700 | $1.89 | 25d | 1 | 1.38mi |
HOA detail condo
- Monthly dues
- $1,159 · $13,908/yr
- Likely covers
- electric
- Assessments
- None detected in remarks — confirm with the listing agent.
Listing history 44 events
-
2026-06-18days on market $175,000 Active 42 DOM
-
2026-06-17days on market $175,000 Active 41 DOM
-
2026-06-16days on market $175,000 Active 40 DOM
-
2026-06-15days on market $175,000 Active 39 DOM
-
2026-06-13days on market $175,000 Active 37 DOM
-
2026-06-09days on market $175,000 Active 33 DOM
-
2026-06-08days on market $175,000 Active 32 DOM
-
2026-06-07days on market $175,000 Active 31 DOM
-
2026-06-04days on market $175,000 Active 28 DOM
-
2026-06-03days on market $175,000 Active 27 DOM
-
2026-06-02days on market $175,000 Active 26 DOM
-
2026-06-01days on market $175,000 Active 25 DOM
-
2026-05-31days on market $175,000 Active 24 DOM
-
2026-05-07$175,000 Active
-
2025-05-17historical
-
2025-04-06price $245,000
-
2025-01-27price $200,000
-
2024-12-03price $235,000
-
2024-11-18$249,000 Active
-
2024-06-25historical
-
2023-12-29price $275,000
-
2023-12-29status Active
-
2023-11-14historical
-
2023-10-11price $265,000
-
2023-05-29price $275,000
-
2023-04-25price $250,000
-
2023-03-22$285,000 Active
-
2018-01-02soldstatus $76,000
-
2017-12-29soldstatus $76,000 Closed
-
2017-11-30price $76,000
-
2017-05-22$81,000 Active
-
2012-01-13soldstatus $64,000
-
2012-01-03historical
-
2011-10-04$64,900
-
2011-08-13historical
-
2010-09-13$110,000
-
2010-08-01historical
-
2010-02-08$110,000
-
2009-12-28historical
-
2009-01-11$199,000
-
2007-12-10soldstatus $199,000
-
2007-11-30soldstatus $199,000
-
2007-10-31historical
-
2007-03-15$199,900
ⓘ Source: listings_history table (triggers on properties + properties_extension) + one-shot
backfill from property_details.listing_events for pre-trigger history.
Tax reassessment forecast FL · Resets to sale price
- Current annual tax
- $922 · $77/mo
- Projected year-2 tax
- $1,452 · $121/mo
- Expected delta
- +$530/yr (+$44/mo · 57.5%)
ⓘ Screening estimate from a state-policy table — verify with the county assessor before closing.
Climate risk First Street
- Flood 1/10 Low FEMA zone X (unshaded) · 0% chance over 30 yrs
- Wildfire 2/10 Low
- Heat 9/10 Extreme 7 d/yr ≥106°F today · 25 d/yr by 30 yrs out
- Wind 10/10 Extreme 99% chance of damaging wind over 30 yrs
- Air quality 2/10 Low 0 unhealthy d/yr today · 2 by 30 yrs out
Nearby sold comps map
Loading sold comps map…
Walkable amenities ~0.75 mi
Loading nearby amenities…
Taxation est. · year 1
- Rental income
- $53,572
- − Mortgage interest
- −$9,803
- − Property taxes
- −$922
- − Insurance
- −$875
- − Repairs & maintenance
- −$4,286
- − Management
- −$4,286
- − HOA
- −$13,908
- − Depreciation
- −$5,091
- Taxable income
- $14,402
- Est. tax owed @ 24.0%
- −$3,456
- After-tax cash flow
- $12,148/yr
For passive investors: Depreciation is non-cash, so a rental often shows a tax loss while cash-flowing — sheltering income. Rental losses are passive: they offset passive income freely, and up to $25,000/yr can offset ordinary (W-2) income if you actively participate and your MAGI is under $100k (phasing out to $0 by $150k); unused losses carry forward. On sale, claimed depreciation is recaptured at up to 25%, and gains may owe capital-gains tax (a 1031 exchange can defer both). Figures are a year-1 estimate at your 24.0% rate — not tax advice; consult a CPA.
Schools (NCES district)
- District
- Palm Beach
- NCES district ID
- 1201500
- Math proficiency
- 46% ▼ -16.00%
- Reading proficiency
- 53% ▼ -4.00%
- Median HH income
- $53,943
- Composite
- 42.72/100
- National rank
- #3160
- State rank
- #34 of 73 in FL
Livability — Wellington
- Score
- 73/100
- State rank
- #294
- US rank
- #4986
Category grades
Schools grade is shown separately in the Schools card above.
Census & demographics
- City population
- 60,184
- Population (ZIP)
- 9,131
Population outlook (Palm Beach County) Hauer SSP2
- Today (2025)
- 1,637,487 people
- By 2030
- 1,743,255 · +6.5%
- By 2040
- 1,948,712 · +19.0%
- By 2050
- 2,132,979 · +30.3%
- By 2075
- 2,530,027 · +54.5%
- By 2100
- 2,706,979 · +65.3%
Race, ethnicity, and origin ACS 2023
- Neighborhood character
- Majority White (65%)
- Race & ethnicity
- White 65% Hispanic / Latino 16% Black 14% Two or more races 7% Asian 4%
- Hispanic origin (detail)
- Mexican 3% Puerto Rican 3% Cuban 3% Salvadoran 2%
- Common ancestry
- Scotch-Irish 5% Romanian 4% Hispanic 3%
- Foreign-born
- 21% · Canada, Jamaica, Vietnam
- Languages at home
- 75% English-only · Spanish 12% French/Haitian/Cajun 4% Other Indo-European 3%
Political lean MEDSL · Palm Beach
- 2024 margin
- Toss-up / Even · D 50.0% · R 49.2%
- 2008→2024 swing
- -22.1pp toward R · 2008: 22.9pp · 2024: 0.8pp
- All cycles
- 2024: D+0.8 2020: D+12.8 2016: D+15.3 2012: D+17.0 2008: D+22.9
Not yet ingested
- Civics
- —
Market trends
- HPI YoY
- ▼ -0.67%
- Current HPI
- 271.0184
- Rent YoY
- —
- Metro
- —
- State GDP YoY
- ▲ 3.28%
- F500 in state
- 36
Industry mix (Fortune 500 HQ in FL)
| Industry | F500 HQs | Revenue |
|---|---|---|
| Industrial Technology | 2 | $29B |
|
||
| Insurance | 2 | $17B |
|
||
| Retail | 1 | $60B |
|
||
| Technology Distribution | 1 | $58B |
|
||
| Homebuilding | 1 | $35B |
|
||
| Technology Manufacturing | 1 | $35B |
|
||
Price history
-12.5% since first listed31 events — show timeline
- 2026-05-07 Listed $175,000 Beaches MLS
- 2025-05-17 Listing Removed — Beaches MLS
- 2025-04-06 Price Changed $245,000 Beaches MLS
- 2025-01-27 Price Changed $200,000 Beaches MLS
- 2024-12-03 Price Changed $235,000 Beaches MLS
- 2024-11-18 Listed $249,000 Beaches MLS
- 2024-06-25 Listing Removed — Beaches MLS
- 2023-12-29 Price Changed $275,000 Beaches MLS
- 2023-12-29 Relisted — Beaches MLS
- 2023-11-14 Listing Removed — Beaches MLS
- 2023-10-11 Price Changed $265,000 Beaches MLS
- 2023-05-29 Price Changed $275,000 Beaches MLS
- 2023-04-25 Price Changed $250,000 Beaches MLS
- 2023-03-22 Listed $285,000 Beaches MLS
- 2018-01-02 Sold (Public Records) $76,000 Public Records
- 2017-12-29 Sold (MLS) $76,000 Beaches MLS
- 2017-11-30 Price Changed $76,000 Beaches MLS
- 2017-05-22 Listed $81,000 Beaches MLS
- 2012-01-13 Sold (MLS) $64,000 Beaches MLS
- 2012-01-03 Listing Removed — Beaches MLS
- 2011-10-04 Listed $64,900 Beaches MLS
- 2011-08-13 Listing Removed — Beaches MLS
- 2010-09-13 Listed $110,000 Beaches MLS
- 2010-08-01 Listing Removed — Beaches MLS
- 2010-02-08 Listed $110,000 Beaches MLS
- 2009-12-28 Listing Removed — Beaches MLS
- 2009-01-11 Listed $199,000 Beaches MLS
- 2007-12-10 Sold (Public Records) $199,000 Public Records
- 2007-11-30 Sold (MLS) $199,000 Beaches MLS
- 2007-10-31 Listing Removed — Beaches MLS
- 2007-03-15 Listed $199,900 Beaches MLS
Property tax history
-5.1%/yrLatest (2025): $922 · +2.5% YoY. Source: county tax records.
Cash-flow waterfall
monthlySold comps — $/sqft
last 12 mo · ≤1 miLoading sold comps…