 Duplex
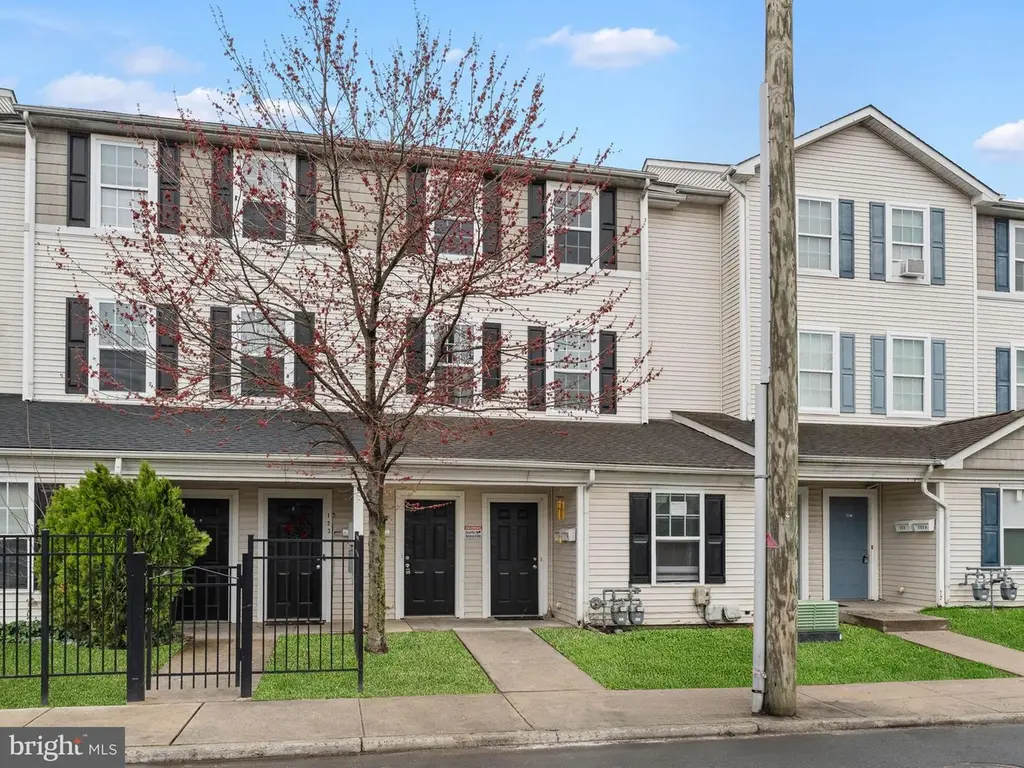
125 New Rose St · Trenton, NJ
Flood risk 1/10 · Minimal
- FEMA flood zone
- X (unshaded)
- Chance of flooding over 30 yrs
- 0.0%
- Est. flood insurance / yr
- $507 – $1,088
Fire risk 1/10 · Minimal
- Est. fire insurance / yr
- $526 – $976
Heat risk 6/10 · Moderate
- Hot days now (above 102°F)
- 7 days/yr
- Hot days in 30 yrs
- 15 days/yr
Wind risk 6/10 · Moderate
- Chance of severe wind over 30 yrs
- 27.0%
Air-quality risk 5/10 · Moderate
- Unhealthy air days now
- 6 days/yr
- Unhealthy air days in 30 yrs
- 8 days/yr
Risk factors via First Street. Map © Google.
Why this score? — see what drove the C+ grade
The composite is a weighted blend of 9 inputs, each scored 0–100. Each bar is that input's sub-score; the figure is the points it added to the 100-point composite (weight × sub-score).
- Cash flow +26.6/30.0
- DSCR +9.1/10.0
- 1% rule +7.2/10.0
- ARV discount +5.6/15.0
- Condition / age +4.0/5.0
- Livability +3.8/5.0
- Rent growth +3.2/5.0
- Schools +0.7/10.0
- Appreciation +0.0/10.0
$359,900
🖨 Deal sheet 📄 Offer letter ✓ Due diligence
Multi-family units
County records classify this as Multi-Family (2-4 Unit). Listing-text estimate: 2 units. confirmed
Listing remarks
Fully renovated duplex in Trenton offering a strong opportunity for both investors and owner-occupants. This well-maintained property features two spacious units, including one three-bedroom, two full bath unit and one two-bedroom, one full bath unit, providing flexible living arrangements and excellent rental appeal. One unit is currently rented, offering immediate income, while the other is ready for occupancy or additional rental potential. With modern updates throughout and a partially leased setup, this property is ideal for those looking to generate cash flow while benefiting from a move-in-ready investment in a convenient location near major routes, shopping, and local amenities.
Key facts
- 2,178 sq ft lot
- Built 2008
- Listed 24 days
Property features AI
Finance
- Financial info: Two-unit building (total 2 units); One unit currently leased, one unit vacant; Total actual rent reported: $48,600
Exterior
- Parking: Parking lot; On-street parking
- Utilities: Public water; Public septic; Natural gas service
- Home design: Fee simple ownership
- Construction: Frame construction; Block foundation; Structure type: End of Row/Townhouse; Estimated year built
- Exterior features: End of row/townhouse setting; Above-grade other structures
Interior
- Bedrooms: One 2-bedroom unit; One 3-bedroom unit
- Heating & cooling: Forced air heating; Natural gas heating fuel; Natural gas cooling fuel; Natural gas hot water
- Interior features: No basement; Estimated finished living area of 2,979
Neighborhood map
What this means for you Summary
Snapshot
- This is a 1×2bd/1.5ba + 1×3bd/1.5ba units multifamily listed at $360k. Condition is rated good.
Deal economics
- At list price, monthly cash flow is $967 ($12k/yr) — positive. Per door: $484/mo.
- The deal already cash-flows at list — no discount required.
- Meets the 1% rule at list price ($4k rent vs $360k).
- Recommended offer: $355k (1.5% below list) — sets the bar for market timing.
- Cap rate 9.5% vs local median 6.3% in Trenton — top-decile yield for the area; either an underpriced asset or a hidden risk that comps aren't pricing in. Stress-test before assuming the spread holds.
Location & tenants
- Location reads 76/100 on livability (#133 in NJ, #3,533 nationally) — a middle-class / working-renter tenant base. Strengths: amenities A+, commute A+, health & safety A+; Watch: schools F, crime F, employment F.
- Trenton Public School District (urban): math 2% / reading 16% proficiency, ranked #471 of 472 in NJ (top 100%) — low school quality limits family demand, transient renter base, plan for 1-2y turnover; 80% free/reduced lunch — lower-income household profile, screen leases tightly.
- Market conditions: Rents rising (+2.6%/yr); 144 active listings in the ZIP; 3 comparable units currently listed for rent nearby; rentals leasing fast (median 14d on market — plan ~1-2 weeks tenant-placement turnaround); 2,256 units permitted in Mercer County in 2024 (1,303 in 5+ unit buildings).
- At $4,373/mo this rent would consume 104% of the median local household income ($50k/yr) (locally 2116% of renters already pay >50% of income on rent) — very limited rent-growth headroom before tenants either downsize or default.
Forward outlook
- Local home prices are declining (-3.0%/yr); year-one equity from $2k of loan paydown is wiped out by about $11k of value loss. Plan a longer hold.
- Mercer County population projected at +4% by 2050 — modest demand growth; plan on rents tracking national, not racing it.
Negotiation context
- It's been on market 24 days — a 2% lower offer ($355k) is reasonable based on typical stale-listing flexibility.
Risks & watch-outs
- Climate carrying-cost: major wind risk, 27% chance of damaging wind over 30y; extreme-heat days projected 7→15/yr by 2055 (HVAC capex compounding) — expect insurance premiums to compound above CPI over the hold.
Questions for the listing agent
- Can we see the unit-by-unit rent roll, current vacancy, and any below-market leases? What's the average tenancy length?
- What capital expenditures (roof, boiler, parking lot, exteriors) have been made in the last 5 years, and what's planned in the next 2?
- Is there a deadline driving the sale (1031 exchange, divorce, estate, relocation)? That informs how much negotiation room exists.
- Schools are F-rated, which usually means shorter tenancies and higher turnover. Who's the typical renter profile here, and what's been the actual vacancy rate?
- Crime grade is F in this area — have there been break-ins, vandalism, or insurance claims at this property in the last 3 years? What carrier currently insures it and at what premium?
- What's the average days-on-market for RENTAL listings here right now (not sales)? A rising rental-DOM trend means longer vacancies and softer asking-rent achievability than the comps imply.
- What's the recent tenant-quality profile in this submarket — average credit score on applications, eviction rate, late-payment / NSF rate, and stable-employment percentage? A property-management company in the area should have these aggregated.
- How much new apartment / multifamily construction is in the pipeline within 1–3 miles? Heavy new supply (>2% of stock underway) typically softens rents 12–24 months out; light construction supports rent growth.
Investment metrics
- 1% rule
- 1.22% ✓
- Cap rate
- 9.52%
- Cash-on-cash
- 11.52%
- DSCR
- 1.51
- GRM
- 6.9
CMA / ARV
- ARV (on-the-fly)
- $345,564
- Comps found
- 5
Show comp detail 5 sales within ~0.75 mi
| Address | Dist | Beds/Ba | Sqft | Sold | Price | $/sf | Match |
|---|---|---|---|---|---|---|---|
| 140 Fountain Ave | 0.04mi | 5/— (+1) | 2,979 (0%) | 4mo | $350,000 | $117 | 90 |
| 204 Academy St | 0.58mi | 4/— | 2,847 (-4%) | 4mo | $330,000 | $116 | 62 |
| 35 Ewing St | 0.75mi | 4/3.0 | 2,578 (-14%) | 2mo | $300,000 | $116 | 41 |
| 547 Perry St | 0.64mi | 5/5.0 (+1) | 2,652 (-11%) | 2mo | $340,000 | $128 | 37 |
| 88 Spring St | 0.52mi | 4/1.0 | 2,613 (-12%) | 23mo | $225,000 | $86 | 28 |
Match score weights: distance 35% · size 25% · config 20% · recency 20%. Top-matched comps best support the ARV.
Projected returns pro-forma
-3.0% appreciation · 2.6% rent growth · sell at horizon
- IRR
- 0.4%
- Equity multiple
- 1.02×
- Total profit
- $1,613
- Equity at exit
- $53,662
- IRR
- 9.7%
- Equity multiple
- 1.73×
- Total profit
- $73,882
- Equity at exit
- $31,118
Cash invested: $100,772 (down + closing). Projections, not guarantees.
Landlord ↔ Tenant lean methodology
- Overall (STATE)
- 21 Tenant-Leaning
- State New Jersey
- 21 Tenant-Leaning · D+6
- County
- — inherits STATE
- City
- — inherits STATE
ZIP-level market 08618
- Rents YoY
- 2.6%
- Active inventory
- 144
- Price-to-rent
- 14.3×
Monthly cashflow live
- Estimated rent
- $4,373 high interval (Pro) →
- Mortgage (P&I)
- −$1,887
- Tax est. 1.5%
- −$450 /mo · $5,398/yr
- Insurance
- −$150
- HOA
- −$0
- Vacancy / Maint / Mgmt
- −$918
- Net cashflow
- $967
Break-even live
2-unit breakdown (identical units grouped — click to expand)
| Units | Beds | Baths | Est. rent |
|---|---|---|---|
| 1× unit | 2 | 1.5 | $2,098 |
| 1× unit | 3 | 1.5 | $2,275 |
| Total (2 units) | $4,373 | ||
UW: 25.0% down · 7.5% · 30yr · 1.5% tax · 5.0% vac · 8.0% maint · 8.0% mgmt
Financing live
Cash to close
- Down payment
- $89,975
- Closing costs
- $10,797
- Reserves months
- —
- Total cash needed
- —
Loan-product check · same deal, 3 products live
Conventional
25% down · 7.5% · 30yr
- Down + closing
- —
- Monthly P&I
- —
- Monthly cashflow
- —
- DSCR
- —
- Eligible?
- —
Personal DTI + credit; lowest rate.
DSCR
20% down · 8.5% · 30yr
- Down + closing
- —
- Monthly P&I
- —
- Monthly cashflow
- —
- DSCR
- —
- Eligible?
- —
No personal income docs; deal must DSCR.
Hard money
10% down · 12.0% · 12mo
- Down + closing
- —
- Monthly P&I
- —
- Monthly cashflow
- —
- DSCR
- —
- Eligible?
- —
Short-term bridge; refi at stabilization.
Rent comps 3 comps
| Address | Beds | Baths | Sqft | Rent | $/sqft | DOM | Units | Dist |
|---|---|---|---|---|---|---|---|---|
| 73 Bellevue Ave Trenton, NJ | 4.0 | 2.0 | 1950 | $2,400 | $1.23 | 13d | 1 | 0.41mi |
| 936 Carteret Ave Trenton, NJ | 4.0 | 2.0 | 2382 | $2,500 | $1.05 | 13d | 1 | 1.30mi |
| 927 Carteret Ave Trenton, NJ | 5.0 | 1.5 | 2275 | $2,500 | $1.10 | 20d | 1 | 1.30mi |
Listing history 20 events
-
2026-06-17status $359,900 Pending 24 DOM
-
2026-06-17days on market $359,900 Active 24 DOM
-
2026-06-16days on market $359,900 Active 23 DOM
-
2026-06-15days on market $359,900 Active 22 DOM
-
2026-06-14days on market $359,900 Active 20 DOM
-
2026-06-10days on market $359,900 Active 17 DOM
-
2026-06-09days on market $359,900 Active 16 DOM
-
2026-06-08days on market $359,900 Active 15 DOM
-
2026-06-07pricedays on market $359,900 Active 14 DOM
-
2026-06-03days on market $379,900 Active 10 DOM
-
2026-06-02days on market $379,900 Active 9 DOM
-
2026-06-01days on market $379,900 Active 8 DOM
-
2026-05-31days on market $379,900 Active 7 DOM
-
2026-05-30days on market $379,900 Active 6 DOM
-
2026-05-24historical $379,900
-
2026-05-22historical
-
2026-05-14price $379,900
-
2026-05-01price $400,000
-
2026-03-27$425,000 Active
-
2026-03-24historical
ⓘ Source: listings_history table (triggers on properties + properties_extension) + one-shot
backfill from property_details.listing_events for pre-trigger history.
Climate risk First Street
- Flood 1/10 Low FEMA zone X (unshaded) · 0% chance over 30 yrs
- Wildfire 1/10 Low
- Heat 6/10 Major 7 d/yr ≥102°F today · 15 d/yr by 30 yrs out
- Wind 6/10 Major 27% chance of damaging wind over 30 yrs
- Air quality 5/10 Major 6 unhealthy d/yr today · 8 by 30 yrs out
Nearby sold comps map
Loading sold comps map…
Walkable amenities ~0.75 mi
Loading nearby amenities…
Taxation est. · year 1
- Rental income
- $52,476
- − Mortgage interest
- −$20,160
- − Property taxes
- −$5,398
- − Insurance
- −$1,800
- − Repairs & maintenance
- −$4,198
- − Management
- −$4,198
- − Depreciation
- −$10,470
- Taxable income
- $6,252
- Est. tax owed @ 24.0%
- −$1,500
- After-tax cash flow
- $10,109/yr
For passive investors: Depreciation is non-cash, so a rental often shows a tax loss while cash-flowing — sheltering income. Rental losses are passive: they offset passive income freely, and up to $25,000/yr can offset ordinary (W-2) income if you actively participate and your MAGI is under $100k (phasing out to $0 by $150k); unused losses carry forward. On sale, claimed depreciation is recaptured at up to 25%, and gains may owe capital-gains tax (a 1031 exchange can defer both). Figures are a year-1 estimate at your 24.0% rate — not tax advice; consult a CPA.
Condition & rehab AI · 13 photos
This fully renovated duplex in Trenton is in excellent condition, with no major repairs needed. Fresh paint and maintaining gutters would further enhance its curb appeal and value.
Value-add opportunities
- Both Paint exterior siding — Fresh paint enhances curb appeal and can increase both resale and rental value.
- Both Clean and maintain gutters — Clean gutters prevent water damage and improve the home's overall appearance, benefiting both resale and rental value.
Renovation cost estimate screening
Value-add ROI direction
- Both Paint exterior siding — Fresh paint enhances curb appeal and can increase both resale and rental value. ↑
- Both Clean and maintain gutters — Clean gutters prevent water damage and improve the home's overall appearance, benefiting both resale and rental value. ↑
ⓘ Cost ranges are severity-bucket heuristics (US national rule-of-thumb). Get contractor quotes + a written scope before underwriting a rehab budget.
Schools (NCES district)
- District
- Trenton Public School District
- NCES district ID
- 3416290
- Math proficiency
- 2% ▼ -8.00%
- Reading proficiency
- 16% ▼ -4.00%
- Median HH income
- $35,078
- Composite
- 7.31/100
- National rank
- #9956
- State rank
- #471 of 472 in NJ
Livability — Trenton
- Score
- 76/100
- State rank
- #133
- US rank
- #3533
Category grades
Schools grade is shown separately in the Schools card above.
Census & demographics
- Census place
- Trenton, NJ
- County
- Mercer County · 327,655 people
- City population
- 177,819
- Metro
- Trenton-Princeton, NJ
- Population (ZIP)
- 35,634
- Household income
- $50,390
- Rent vs Own
- Severe rent burden
- 2116.0
Population outlook (Mercer County) Hauer SSP2
- Today (2025)
- 381,395 people
- By 2030
- 384,640 · +0.9%
- By 2040
- 391,431 · +2.6%
- By 2050
- 397,845 · +4.3%
- By 2075
- 417,281 · +9.4%
- By 2100
- 420,327 · +10.2%
Race, ethnicity, and origin ACS 2023
- Neighborhood character
- Diverse neighborhood (Simpson 0.59)
- Race & ethnicity
- Black 59% White 19% Hispanic / Latino 16% Two or more races 7% Asian 3%
- Hispanic origin (detail)
- Mexican 1% Puerto Rican 6% Dominican 3%
- Common ancestry
- Romanian 2% Hispanic 1% Scotch-Irish 1%
- Foreign-born
- 14% · Canada, China, South Korea
- Languages at home
- 80% English-only · Spanish 10% Other Indo-European 3% Arabic 1%
Political lean MEDSL · Mercer
- 2024 margin
- Solid D (+33.9) · D 65.9% · R 32.0% · Other 2.1%
- 2008→2024 swing
- -2.2pp toward R · 2008: 36.1pp · 2024: 33.9pp
- All cycles
- 2024: D+33.9 2020: D+40.0 2016: D+36.2 2012: D+36.8 2008: D+36.1
Not yet ingested
- Civics
- —
Market trends
- HPI YoY
- ▼ -309.54%
- Current HPI
- 288.6841
- Rent YoY
- ▲ 2.60%
- Metro
- Trenton-Princeton, NJ
- State GDP YoY
- ▲ 2.05%
- F500 in state
- 34
Industry mix (Fortune 500 HQ in NJ)
| Industry | F500 HQs | Revenue |
|---|---|---|
| Consumer Goods | 3 | $31B |
|
||
| Pharmaceuticals | 2 | $153B |
|
||
| Technology | 2 | $21B |
|
||
| Insurance | 2 | $20B |
|
||
| Healthcare | 2 | $19B |
|
||
| Financial Services | 1 | $70B |
|
||
Price history
-10.6% since first listed6 events — show timeline
- 2026-05-24 Coming Soon $379,900 BRIGHT MLS
- 2026-05-22 Listing Removed — BRIGHT MLS
- 2026-05-14 Price Changed $379,900 BRIGHT MLS
- 2026-05-01 Price Changed $400,000 BRIGHT MLS
- 2026-03-27 Listed $425,000 BRIGHT MLS
- 2026-03-24 Coming Soon — BRIGHT MLS
Cash-flow waterfall
monthlySold comps — $/sqft
last 12 mo · ≤1 miLoading sold comps…