None · Tamarac, FL
Flood risk 1/10 · Minimal
- FEMA flood zone
- X (shaded)
- Chance of flooding over 30 yrs
- 0.0%
- Est. flood insurance / yr
- $507 – $1,088
Fire risk 1/10 · Minimal
- Est. fire insurance / yr
- $947 – $1,759
Heat risk 10/10 · Severe
- Hot days now (above 105°F)
- 7 days/yr
- Hot days in 30 yrs
- 24 days/yr
Wind risk 10/10 · Severe
- Chance of severe wind over 30 yrs
- 99.0%
Air-quality risk 3/10 · Minor
- Unhealthy air days now
- 3 days/yr
- Unhealthy air days in 30 yrs
- 3 days/yr
Risk factors via First Street. Map © Google.
Why this score? — see what drove the B grade
The composite is a weighted blend of 9 inputs, each scored 0–100. Each bar is that input's sub-score; the figure is the points it added to the 100-point composite (weight × sub-score).
- Cash flow +30.0/30.0
- 1% rule +10.0/10.0
- DSCR +10.0/10.0
- ARV discount +7.5/15.0
- Schools +4.1/10.0
- Livability +3.8/5.0
- Condition / age +3.8/5.0
- Rent growth +2.2/5.0
- Appreciation +0.0/10.0
$120,000
🖨 Deal sheet (PDF) 📄 Offer letter ✓ Due diligence
Listing remarks
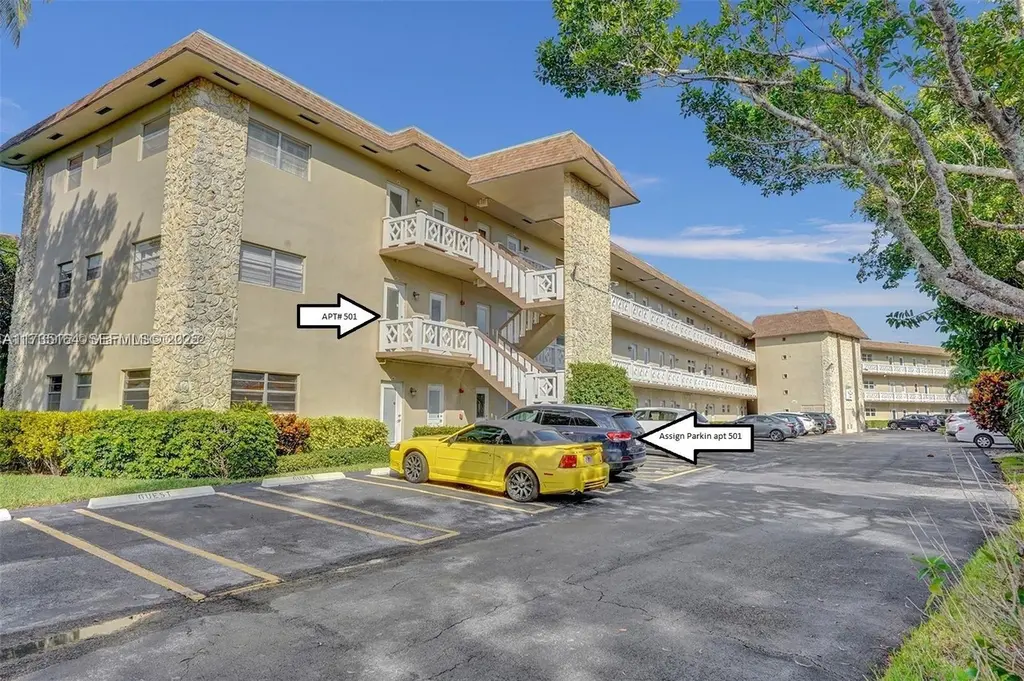
BEAUTIFUL CORNER UNIT ON THE SECOND FLOORS WITH VIEW ON THE LAKE , 2 BEDROOMS , 2 BATH. KITCHEN HAS BEEN UPDATED. FEATURES ARE WALK-IN IN THE MASTER BEDROOM, TILE FLOORS THROUGHOUT THE UNIT, ENCLOSED BALCONY, BEDROOMS AND LIVING ROOM HAVE WOOD FLOORS , NEW HURRICANE WINDOWS IN THE ECLOSED BANCONY, FURNISHED, 55+ COMMUNITY, RENT AFTER 1TH YEAR OF OWNERSHIP. CAMENITIES INCLUDE HEATED POOL, GYM, SHUFFLEBOARD, CLUB HOUSE , BBQ/PICNIC AREA.
Key facts
- Tile floors
- Enclosed balcony
- View on the lake
Tags
Property features AI
Finance
- Other: Senior community
- HOA & community: Association with amenities including pool, fitness center, billiard room, business center, library, hobby room, kitchen facilities, elevator(s), parking, and laundry; HOA fee collected annually
Exterior
- Parking: 1 open parking space; Association parking available
- Security: Fire alarm; Smoke detectors; Secure elevator
- Utilities: Cable available
- Home design: Condominium; 3 stories
- Construction: Block and brick construction; Built using block and brick
- Exterior features: Not waterfront; Entry level: 2
Interior
- Kitchen: Dishwasher; Electric range; Microwave; Refrigerator
- Flooring: Ceramic tile; Parquet
- Bathrooms: 2 full bathrooms
- Heating & cooling: Central heating; Central air conditioning; Ceiling fans
- Interior features: Closet cabinetry; Fire alarm; Smoke detectors; Elevator secure
- Laundry & utility: Laundry facilities (association)
Neighborhood map
What this means for you Summary
Snapshot
- This is a 2-bed/2.0-bath condo listed at $120k. Condition is rated good.
Deal economics
- At list price, monthly cash flow is $575 ($7k/yr) — positive.
- The deal already cash-flows at list — no discount required.
- Meets the 1% rule at list price ($2k rent vs $120k).
- Cap rate 12.0% vs local median 3.9% in Tamarac — top-decile yield for the area; either an underpriced asset or a hidden risk that comps aren't pricing in. Stress-test before assuming the spread holds.
Location & tenants
- Location reads 76/100 on livability (#239 in FL, #3,785 nationally) — a middle-class / working-renter tenant base. Strengths: housing A+, health & safety A+, cost of living A-; Watch: employment C-, amenities F, commute F.
- Broward (suburban): math 42% / reading 53% proficiency, ranked #46 of 73 in FL (top 63%) — families likely to look elsewhere, expect single-tenant / working-renter base with shorter leases.
- Market conditions: Rents soft (-1.4%/yr); 827 active listings in the ZIP; 40 comparable units currently listed for rent nearby; rentals at typical pace (median 22d on market — plan ~3-4 weeks tenant-placement turnaround); 2,111 units permitted in Broward County in 2024 (1,265 in 5+ unit buildings).
- This rent runs 38% of the median local income ($58k/yr) — at the standard rent-burdened threshold; future hikes will face affordability resistance.
Forward outlook
- Local home prices are declining (-3.0%/yr); year-one equity from $830 of loan paydown is wiped out by about $4k of value loss. Plan a longer hold.
- Broward County population projected at +34% by 2050 — long-run rental-demand tailwind backs the buy-and-hold thesis.
- At projected returns (-3.0% appreciation + 0.0% rent growth), your $34k cash investment doubles in ~8 years — after that, you're playing with house money.
Negotiation context
- Only 1 days on market — expect competitive offers; lowballing is unlikely to land.
Risks & watch-outs
- Climate carrying-cost: severe wind risk, 99% chance of damaging wind over 30y; extreme-heat days projected 7→24/yr by 2055 (HVAC capex compounding) — expect insurance premiums to compound above CPI over the hold.
Questions for the listing agent
- Built in 1972 — when were the roof, HVAC, electrical panel, plumbing, and water heater last replaced?
- What does the HOA fee cover, when was the last increase, and are there any pending special assessments or reserve-fund shortfalls?
- Any open or pending special assessments — roof, HVAC, plumbing, elevator, façade? What's the per-unit balance and payoff schedule, and is the seller paying it off at close or rolling it to the buyer?
- Is there a deadline driving the sale (1031 exchange, divorce, estate, relocation)? That informs how much negotiation room exists.
- Schools are B-rated — typically a magnet for longer-tenancy family renters. What's the average tenant stay here, and is there a school-zone premium baked into asking?
- What's the average days-on-market for RENTAL listings here right now (not sales)? A rising rental-DOM trend means longer vacancies and softer asking-rent achievability than the comps imply.
- What's the recent tenant-quality profile in this submarket — average credit score on applications, eviction rate, late-payment / NSF rate, and stable-employment percentage? A property-management company in the area should have these aggregated.
- How much new apartment / multifamily construction is in the pipeline within 1–3 miles? Heavy new supply (>2% of stock underway) typically softens rents 12–24 months out; light construction supports rent growth.
Investment metrics
- 1% rule
- 1.53% ✓
- Cap rate
- 12.04%
- Cash-on-cash
- 20.53%
- DSCR
- 1.91
- GRM
- 5.4
CMA / ARV
No comps found within radius.
Projected returns pro-forma
-3.0% appreciation · 0.0% rent growth · sell at horizon
- IRR
- 9.3%
- Equity multiple
- 1.35×
- Total profit
- $11,835
- Equity at exit
- $17,892
- IRR
- 15.7%
- Equity multiple
- 2.10×
- Total profit
- $36,860
- Equity at exit
- $10,375
Cash invested: $33,600 (down + closing). Projections, not guarantees.
Landlord ↔ Tenant lean methodology
- Overall (STATE)
- 87 Strongly Landlord-Friendly
- State Florida
- 87 Strongly Landlord-Friendly · R+3
- County
- — inherits STATE
- City
- — inherits STATE
ZIP-level market 33319
- Rents YoY
- -1.4%
- Active inventory
- 827
- Price-to-rent
- 5.4×
Monthly cashflow live
- Estimated rent
- $1,838 high interval (Pro) →
- Mortgage (P&I)
- −$629
- Tax est. 1.5%
- −$150 /mo · $1,800/yr
- Insurance
- −$50
- HOA
- −$48
- Vacancy / Maint / Mgmt
- −$386
- Net cashflow
- $575
Break-even live
Sensitivity live
| Price | -10% $658 | -5% $616 | +0% $575 | +5% $533 | +10% $492 |
|---|---|---|---|---|---|
| Rent | -10% $430 | -5% $502 | +0% $575 | +5% $647 | +10% $720 |
| Rate | -1.0pp $635 | -0.5pp $605 | base $575 | +0.5pp $544 | +1.0pp $512 |
UW: 25.0% down · 7.5% · 30yr · 1.5% tax · 5.0% vac · 8.0% maint · 8.0% mgmt
Financing live
Cash to close
- Down payment
- $30,000
- Closing costs
- $3,600
- Reserves months
- —
- Total cash needed
- —
Loan-product check · same deal, 3 products live
Conventional
25% down · 7.5% · 30yr
- Down + closing
- —
- Monthly P&I
- —
- Monthly cashflow
- —
- DSCR
- —
- Eligible?
- —
Personal DTI + credit; lowest rate.
DSCR
20% down · 8.5% · 30yr
- Down + closing
- —
- Monthly P&I
- —
- Monthly cashflow
- —
- DSCR
- —
- Eligible?
- —
No personal income docs; deal must DSCR.
Hard money
10% down · 12.0% · 12mo
- Down + closing
- —
- Monthly P&I
- —
- Monthly cashflow
- —
- DSCR
- —
- Eligible?
- —
Short-term bridge; refi at stabilization.
Rent comps 40 comps
| Address | Beds | Baths | Sqft | Rent | $/sqft | DOM | Units | Dist |
|---|---|---|---|---|---|---|---|---|
| 5900 NW 44th St #106 Lauderhill, FL | 2.0 | 2.0 | 1100 | $1,700 | $1.55 | 15d | 1 | 0.60mi |
| 5903 NW 57th Ct Tamarac, FL | 1.0–3.0 | 1.0–2.0 | 1080 | $2,330 | $2.16 | 0d | 29 | 0.61mi |
| 5530 NW 44th St Lauderhill, FL | 2.0 | 2.0 | 1187 | $2,050 | $1.73 | 25d | 2 | 0.62mi |
| 5860 NW 44th St #603 Lauderhill, FL | 2.0 | 2.0 | 1100 | $1,800 | $1.64 | 19d | 1 | 0.62mi |
| 6200 NW 44th St #109 Lauderhill, FL | 2.0 | 2.0 | 1092 | $1,850 | $1.69 | 12d | 1 | 0.65mi |
| 6100 NW 44th St #302 Lauderhill, FL | 2.0 | 2.0 | 1092 | $1,800 | $1.65 | 25d | 1 | 0.67mi |
| 4166 Inverrary Dr #403 Lauderhill, FL | 2.0 | 2.0 | 972 | $1,750 | $1.80 | 25d | 1 | 0.70mi |
| 4168 Inverrary Dr #408 Lauderhill, FL | 2.0 | 2.0 | 1073 | $1,750 | $1.63 | 25d | 1 | 0.70mi |
| 4172 Inverrary Dr #306 Lauderhill, FL | 1.0 | 1.5 | 783 | $1,500 | $1.92 | 12d | 1 | 0.73mi |
| 5612 Rock Island Rd #154 Tamarac, FL | 1.0 | 1.0 | 695 | $1,690 | $2.43 | 16d | 1 | 0.73mi |
| 6161 NW 57th Ct #103 Tamarac, FL | 2.0 | 2.0 | 880 | $2,200 | $2.50 | 25d | 1 | 0.73mi |
| 5628 Rock Island Rd Tamarac, FL | 1.0–2.0 | 1.0–2.0 | 867 | $2,000 | $2.31 | 6d | 2 | 0.73mi |
| 5961 N Falls Circle Dr Lauderhill, FL | 1.0 | 1.5–2.0 | 885 | $1,745 | $1.97 | 4d | 2 | 0.75mi |
| 5646 Rock Island Rd #198 Tamarac, FL | 2.0 | 2.0 | 1030 | $2,150 | $2.09 | 25d | 1 | 0.75mi |
| 4176 Inverrary Dr #110 Lauderhill, FL | 2.0 | 2.0 | 972 | $2,000 | $2.06 | 25d | 1 | 0.76mi |
| 5801 NW 62nd Ave #106 Tamarac, FL | 1.0 | 1.0 | 660 | $1,350 | $2.05 | 25d | 1 | 0.77mi |
| 6001 Shakerwood Cir #205 Tamarac, FL | 2.0 | 2.0 | 775 | $1,800 | $2.32 | 25d | 1 | 0.79mi |
| 4174 Inverrary Dr #1004 Lauderhill, FL | 2.0 | 2.0 | 972 | $1,750 | $1.80 | 25d | 1 | 0.79mi |
| 4174 Inverrary Dr #303 Lauderhill, FL | 2.0 | 2.0 | 972 | $1,675 | $1.72 | 13d | 1 | 0.79mi |
| 4174 Inverrary Dr #907 Lauderhill, FL | 1.0 | 1.0 | 675 | $1,500 | $2.22 | 25d | 1 | 0.79mi |
| 4174 Inverrary Dr #811 Lauderhill, FL | 1.0 | 1.5 | 783 | $1,550 | $1.98 | 25d | 1 | 0.79mi |
| 4174 Inverrary Dr #903 Lauderhill, FL | 2.0 | 2.0 | 972 | $1,700 | $1.75 | 21d | 1 | 0.79mi |
| 4174 Inverrary Dr #401 Lauderhill, FL | 2.0 | 2.0 | 1116 | $2,100 | $1.88 | 25d | 1 | 0.79mi |
| 4934 NW 55th Ct Tamarac, FL | 2.0 | 1.0 | 1059 | $1,895 | $1.79 | 16d | 1 | 0.80mi |
| 5851 NW 62nd Ave #305 Tamarac, FL | 1.0 | 1.0 | 660 | $1,500 | $2.27 | 25d | 1 | 0.80mi |
| 5686 Rock Island Rd Tamarac, FL | 1.0 | 1.0 | 655 | $1,675 | $2.56 | 16d | 2 | 0.80mi |
| 4156 Inverrary Dr Lauderhill, FL | 1.0–2.0 | 1.5–2.0 | 899 | $1,950 | $2.17 | 0d | 2 | 0.80mi |
| 4156 Inverrary Dr Lauderhill, FL | 2.0 | 2.0 | 993 | $2,200 | $2.22 | 25d | 4 | 0.80mi |
| 4154 Inverrary Dr Lauderhill, FL | 1.0–2.0 | 1.5–2.0 | 877 | $1,800 | $2.05 | 25d | 2 | 0.82mi |
| 4154 Inverrary Dr #407 Lauderhill, FL | 2.0 | 2.0 | 972 | $1,800 | $1.85 | 11d | 1 | 0.82mi |
| 4154 Inverrary Dr #206 Lauderhill, FL | 1.0 | 1.5 | 783 | $1,575 | $2.01 | 3d | 1 | 0.82mi |
| 4152 Inverrary Dr Lauderhill, FL | 2.0 | 2.0 | 1016 | $2,025 | $1.99 | 25d | 2 | 0.82mi |
| 4158 Inverrary Dr #202 Lauderhill, FL | 2.0 | 2.0 | 1116 | $2,200 | $1.97 | 4d | 1 | 0.82mi |
| 5672 Rock Island Rd Tamarac, FL | 1.0 | 1.0 | 717 | $1,748 | $2.44 | 4d | 2 | 0.82mi |
| 5750 NW 64th Ave #305 Tamarac, FL | 1.0 | 1.0 | 660 | $1,650 | $2.50 | 21d | 1 | 0.83mi |
| 5890 NW 64th Ave #308 Tamarac, FL | 1.0 | 1.0 | 660 | $1,500 | $2.27 | 3d | 1 | 0.83mi |
| 5860 NW 64th Ave Tamarac, FL | 1.0–2.0 | 1.0–2.0 | 770 | $1,700 | $2.21 | 25d | 2 | 0.84mi |
| 5860 NW 64th Ave Tamarac, FL | 1.0–2.0 | 1.0–2.0 | 770 | $1,700 | $2.21 | 8d | 3 | 0.84mi |
| 5740 Rock Island Rd #299 Tamarac, FL | 1.0 | 1.0 | 750 | $1,895 | $2.53 | 15d | 1 | 0.84mi |
| 4158 Inverrary Dr Lauderhill, FL | 2.0 | 2.0 | 1108 | $2,100 | $1.90 | 18d | 2 | 0.84mi |
HOA detail condo
- Monthly dues
- $48 · $576/yr
- Likely covers
- poolgym
- Assessments
- None detected in remarks — confirm with the listing agent.
Listing history 2 events
-
2026-06-10remarks 439-char remark
-
2026-06-10$120,000 Active 1 DOM
ⓘ Source: listings_history table (triggers on properties + properties_extension) + one-shot
backfill from property_details.listing_events for pre-trigger history.
Climate risk First Street
- Flood 1/10 Low FEMA zone X (shaded) · 0% chance over 30 yrs
- Wildfire 1/10 Low
- Heat 10/10 Extreme 7 d/yr ≥105°F today · 24 d/yr by 30 yrs out
- Wind 10/10 Extreme 99% chance of damaging wind over 30 yrs
- Air quality 3/10 Moderate 3 unhealthy d/yr today · 3 by 30 yrs out
Nearby sold comps map
Loading sold comps map…
Walkable amenities ~0.75 mi
Loading nearby amenities…
Taxation est. · year 1
- Rental income
- $22,057
- − Mortgage interest
- −$6,722
- − Property taxes
- −$1,800
- − Insurance
- −$600
- − Repairs & maintenance
- −$1,765
- − Management
- −$1,765
- − HOA
- −$576
- − Depreciation
- −$3,491
- Taxable income
- $5,339
- Est. tax owed @ 24.0%
- −$1,281
- After-tax cash flow
- $5,616/yr
For passive investors: Depreciation is non-cash, so a rental often shows a tax loss while cash-flowing — sheltering income. Rental losses are passive: they offset passive income freely, and up to $25,000/yr can offset ordinary (W-2) income if you actively participate and your MAGI is under $100k (phasing out to $0 by $150k); unused losses carry forward. On sale, claimed depreciation is recaptured at up to 25%, and gains may owe capital-gains tax (a 1031 exchange can defer both). Figures are a year-1 estimate at your 24.0% rate — not tax advice; consult a CPA.
Condition & rehab AI · 13 photos
This corner unit is in good condition with no major repairs needed. It has a good curb appeal and is move-in ready.
Value-add opportunities
- Both Paint exterior — Enhances curb appeal and resale value
- Both Clean windows — Improves natural light and overall appearance
Renovation cost estimate screening
Value-add ROI direction
- Both Paint exterior — Enhances curb appeal and resale value ↑
- Both Clean windows — Improves natural light and overall appearance ↑
ⓘ Cost ranges are severity-bucket heuristics (US national rule-of-thumb). Get contractor quotes + a written scope before underwriting a rehab budget.
Schools (NCES district)
- District
- Broward
- NCES district ID
- 1200180
- Math proficiency
- 42% ▼ -18.00%
- Reading proficiency
- 53% ▼ -5.00%
- Median HH income
- $52,139
- Composite
- 40.88/100
- National rank
- #3621
- State rank
- #46 of 73 in FL
Livability — Tamarac
- Score
- 76/100
- State rank
- #239
- US rank
- #3785
Category grades
Schools grade is shown separately in the Schools card above.
Census & demographics
- Census place
- Tamarac, FL
- County
- Broward County · 1,963,430 people
- City population
- 105,666
- Metro
- Miami-Fort Lauderdale-Pompano Beach, FL
- Population (ZIP)
- 54,450
- Household income
- $58,388
- Rent vs Own
- Severe rent burden
- 2809.0
Population outlook (Broward County) Hauer SSP2
- Today (2025)
- 2,207,033 people
- By 2030
- 2,360,704 · +7.0%
- By 2040
- 2,661,208 · +20.6%
- By 2050
- 2,946,698 · +33.5%
- By 2075
- 3,602,273 · +63.2%
- By 2100
- 3,970,984 · +79.9%
Race, ethnicity, and origin ACS 2023
- Neighborhood character
- Diverse neighborhood (Simpson 0.58)
- Race & ethnicity
- Black 61% Hispanic / Latino 17% White 15% Two or more races 11% Asian 4%
- Hispanic origin (detail)
- Puerto Rican 4% Cuban 2% Dominican 1%
- Common ancestry
- Hispanic 13% Romanian 1% Italian 1%
- Foreign-born
- 46% · Canada, Jamaica, Vietnam
- Languages at home
- 64% English-only · Spanish 15% French/Haitian/Cajun 15% Other Indo-European 2%
Political lean MEDSL · Broward
- 2024 margin
- D (+17.0) · D 58.0% · R 41.0%
- 2008→2024 swing
- -17.8pp toward R · 2008: 34.7pp · 2024: 17.0pp
- All cycles
- 2024: D+17.0 2020: D+29.8 2016: D+35.0 2012: D+34.9 2008: D+34.7
Not yet ingested
- Civics
- —
Market trends
- HPI YoY
- ▼ -202.84%
- Current HPI
- 328.4307
- Rent YoY
- ▼ -1.38%
- Metro
- Miami-Fort Lauderdale-Pompano Beach, FL
- State GDP YoY
- ▲ 3.28%
- F500 in state
- 36
Industry mix (Fortune 500 HQ in FL)
| Industry | F500 HQs | Revenue |
|---|---|---|
| Industrial Technology | 2 | $29B |
|
||
| Insurance | 2 | $17B |
|
||
| Retail | 1 | $60B |
|
||
| Technology Distribution | 1 | $58B |
|
||
| Homebuilding | 1 | $35B |
|
||
| Technology Manufacturing | 1 | $35B |
|
||
Price history
1 event — show timeline
- 2025-01-30 Listed $120,000 Beaches MLS
Cash-flow waterfall
monthlySold comps — $/sqft
last 12 mo · ≤1 miLoading sold comps…