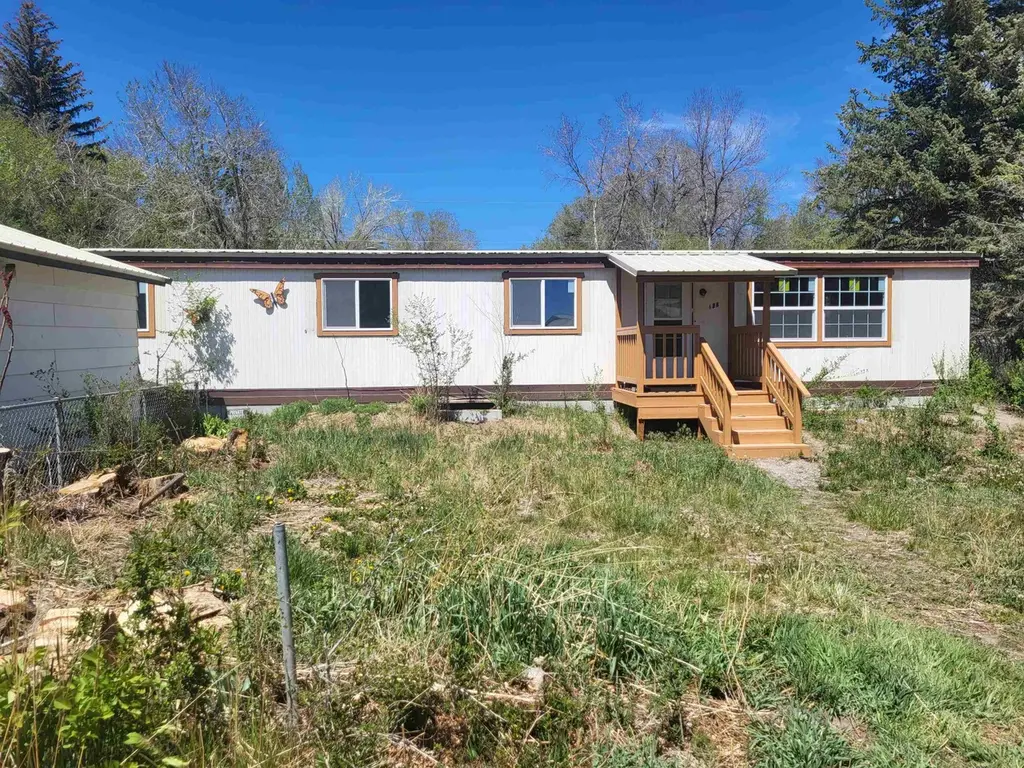
628 Vine St · Riverton, WY
Flood risk 1/10 · Minimal
- FEMA flood zone
- D
- Chance of flooding over 30 yrs
- 0.0%
- Est. flood insurance / yr
- $544 – $1,084
Fire risk 7/10 · Major
- Est. fire insurance / yr
- $564 – $1,046
Heat risk 3/10 · Minor
- Hot days now (above 91°F)
- 6 days/yr
- Hot days in 30 yrs
- 14 days/yr
Wind risk 1/10 · Minimal
- Chance of severe wind over 30 yrs
- —
Air-quality risk 3/10 · Minor
- Unhealthy air days now
- 1 days/yr
- Unhealthy air days in 30 yrs
- 4 days/yr
Risk factors via First Street. Map © Google.
Why this score? — see what drove the B- grade
The composite is a weighted blend of 9 inputs, each scored 0–100. Each bar is that input's sub-score; the figure is the points it added to the 100-point composite (weight × sub-score).
- Cash flow +30.0/30.0
- 1% rule +10.0/10.0
- DSCR +10.0/10.0
- ARV discount +7.5/15.0
- Schools +3.7/10.0
- Livability +3.2/5.0
- Rent growth +2.5/5.0
- Condition / age +2.5/5.0
- Appreciation +0.0/10.0
$80,000
🖨 Deal sheet 📄 Offer letter ✓ Due diligence
Key facts
- Renewal of bathrooms
- Metal roof
- Leclair irrigation
Tags
Property features AI
Exterior
- Parking: 2-car garage
- Utilities: Natural gas available; Public sewer
- Home design: Manufactured home (attached); Residential property
- Construction: Masonite exterior
- Exterior features: Deck; Shed(s)
Interior
- Heating & cooling: Forced air heating
- Interior features: Crawl space basement
Neighborhood map
What this means for you Summary
Snapshot
- This is a 3-bed/2.0-bath single-family listed at $80k.
Deal economics
- At list price, monthly cash flow is $548 ($7k/yr) — positive.
- The deal already cash-flows at list — no discount required.
- Meets the 1% rule at list price ($1k rent vs $80k).
- Recommended offer: $78k (3.0% below list) — sets the bar for market timing.
- Cap rate 14.5% vs local median 3.7% in Riverton — top-decile yield for the area; either an underpriced asset or a hidden risk that comps aren't pricing in. Stress-test before assuming the spread holds.
Location & tenants
- Location reads 65/100 on livability (#79 in WY) — a middle-class / working-renter tenant base. Strengths: cost of living A+, housing A, health & safety A; Watch: schools C-, crime F, amenities F.
- Fremont County School District #25 (town): math 38% / reading 48% proficiency, ranked #36 of 41 in WY (top 88%) — families likely to look elsewhere, expect single-tenant / working-renter base with shorter leases.
- Market conditions: 189 active listings in the ZIP; 22 units permitted in Fremont County in 2024 (0 in 5+ unit buildings).
Forward outlook
- Local home prices are declining (-3.0%/yr); year-one equity from $553 of loan paydown is wiped out by about $2k of value loss. Plan a longer hold.
- Fremont County population projected at -13% by 2050 — secular population decline; favor cash flow + early exit over multi-decade hold.
- At projected returns (-3.0% appreciation + 3.0% rent growth), your $22k cash investment doubles in ~5 years — after that, you're playing with house money.
Negotiation context
- It's been on market 39 days — a 3% lower offer ($78k) is reasonable based on typical stale-listing flexibility.
Risks & watch-outs
- Climate carrying-cost: major wildfire risk — expect insurance premiums to compound above CPI over the hold.
Questions for the listing agent
- It's been on market 39 days. Have you received any prior offers? Is the seller open to a 3% concession, seller financing, or rate buy-down credit?
- Is there a deadline driving the sale (1031 exchange, divorce, estate, relocation)? That informs how much negotiation room exists.
- Crime grade is F in this area — have there been break-ins, vandalism, or insurance claims at this property in the last 3 years? What carrier currently insures it and at what premium?
- What's the average days-on-market for RENTAL listings here right now (not sales)? A rising rental-DOM trend means longer vacancies and softer asking-rent achievability than the comps imply.
- What's the recent tenant-quality profile in this submarket — average credit score on applications, eviction rate, late-payment / NSF rate, and stable-employment percentage? A property-management company in the area should have these aggregated.
- How much new for-sale + rental construction is in the pipeline within 1–3 miles? Heavy new supply typically softens prices + rents 12–24 months out; constrained supply supports both.
Investment metrics
- 1% rule
- 1.65% ✓
- Cap rate
- 14.51%
- Cash-on-cash
- 29.36%
- DSCR
- 2.31
- GRM
- 5.1
CMA / ARV
- ARV (on-the-fly)
- $235,200
- Comps found
- 4
Show comp detail 4 sales within ~0.75 mi
| Address | Dist | Beds/Ba | Sqft | Sold | Price | $/sf | Match |
|---|---|---|---|---|---|---|---|
| 85 Webbwood Rd Rd | 0.10mi | 3/2.0 | 1,532 (+14%) | 4mo | $269,000 | $176 | 69 |
| 118 E Sunset Dr | 0.71mi | 3/1.0 | 1,400 (+4%) | 0mo | $141,467 | $101 | 56 |
| 605 Spencer St | 0.75mi | 3/2.0 | 1,440 (+7%) | 11mo | $133,000 | $92 | 44 |
| 927 Elk Dr | 0.72mi | 3/1.0 | 1,400 (+4%) | 23mo | $245,000 | $175 | 36 |
Match score weights: distance 35% · size 25% · config 20% · recency 20%. Top-matched comps best support the ARV.
Projected returns pro-forma
-3.0% appreciation · 3.0% rent growth · sell at horizon
- IRR
- 23.8%
- Equity multiple
- 1.98×
- Total profit
- $21,921
- Equity at exit
- $11,928
- IRR
- 31.7%
- Equity multiple
- 3.86×
- Total profit
- $63,961
- Equity at exit
- $6,917
Cash invested: $22,400 (down + closing). Projections, not guarantees.
Landlord ↔ Tenant lean methodology
- Overall (STATE)
- 90 Strongly Landlord-Friendly
- State Wyoming
- 90 Strongly Landlord-Friendly · R+25
- County
- — inherits STATE
- City
- — inherits STATE
ZIP-level market 82501
- Active inventory
- 189
- Price-to-rent
- 5.1×
Monthly cashflow live
- Estimated rent
- $1,318 medium interval (Pro) →
- Mortgage (P&I)
- −$420
- Tax from tax record
- −$40 /mo · $484/yr
- Insurance
- −$33
- HOA
- −$0
- Vacancy / Maint / Mgmt
- −$277
- Net cashflow
- $548
Break-even live
UW: 25.0% down · 7.5% · 30yr · 1.5% tax · 5.0% vac · 8.0% maint · 8.0% mgmt
Financing live
Cash to close
- Down payment
- $20,000
- Closing costs
- $2,400
- Reserves months
- —
- Total cash needed
- —
Loan-product check · same deal, 3 products live
Conventional
25% down · 7.5% · 30yr
- Down + closing
- —
- Monthly P&I
- —
- Monthly cashflow
- —
- DSCR
- —
- Eligible?
- —
Personal DTI + credit; lowest rate.
DSCR
20% down · 8.5% · 30yr
- Down + closing
- —
- Monthly P&I
- —
- Monthly cashflow
- —
- DSCR
- —
- Eligible?
- —
No personal income docs; deal must DSCR.
Hard money
10% down · 12.0% · 12mo
- Down + closing
- —
- Monthly P&I
- —
- Monthly cashflow
- —
- DSCR
- —
- Eligible?
- —
Short-term bridge; refi at stabilization.
Listing history 18 events
-
2026-06-19days on market $80,000 Active 39 DOM
-
2026-06-18days on market $80,000 Active 38 DOM
-
2026-06-17days on market $80,000 Active 37 DOM
-
2026-06-16days on market $80,000 Active 36 DOM
-
2026-06-15days on market $80,000 Active 35 DOM
-
2026-06-14days on market $80,000 Active 33 DOM
-
2026-06-12days on market $80,000 Active 32 DOM
-
2026-06-09days on market $80,000 Active 29 DOM
-
2026-06-08days on market $80,000 Active 28 DOM
-
2026-06-07days on market $80,000 Active 27 DOM
-
2026-06-05days on market $80,000 Active 25 DOM
-
2026-06-04days on market $80,000 Active 23 DOM
-
2026-06-02days on market $80,000 Active 22 DOM
-
2026-06-01price $80,000 Active 21 DOM
-
2026-06-01days on market $95,000 Active 21 DOM
-
2026-05-31days on market $95,000 Active 20 DOM
-
2026-05-31days on market $95,000 Active 19 DOM
-
2026-05-07$95,000 Active
ⓘ Source: listings_history table (triggers on properties + properties_extension) + one-shot
backfill from property_details.listing_events for pre-trigger history.
Tax reassessment forecast WY · Resets to sale price
- Current annual tax
- $484 · $40/mo
- Projected year-2 tax
- $488 · $41/mo
- Expected delta
- +$4/yr ($0/mo · 0.7%)
ⓘ Screening estimate from a state-policy table — verify with the county assessor before closing.
Climate risk First Street
- Flood 1/10 Low FEMA zone D · 0% chance over 30 yrs
- Wildfire 7/10 Severe
- Heat 3/10 Moderate 6 d/yr ≥91°F today · 14 d/yr by 30 yrs out
- Wind 1/10 Low
- Air quality 3/10 Moderate 1 unhealthy d/yr today · 4 by 30 yrs out
Nearby sold comps map
Loading sold comps map…
Walkable amenities ~0.75 mi
Loading nearby amenities…
Taxation est. · year 1
- Rental income
- $15,816
- − Mortgage interest
- −$4,481
- − Property taxes
- −$484
- − Insurance
- −$400
- − Repairs & maintenance
- −$1,265
- − Management
- −$1,265
- − Depreciation
- −$2,327
- Taxable income
- $5,592
- Est. tax owed @ 24.0%
- −$1,342
- After-tax cash flow
- $5,234/yr
For passive investors: Depreciation is non-cash, so a rental often shows a tax loss while cash-flowing — sheltering income. Rental losses are passive: they offset passive income freely, and up to $25,000/yr can offset ordinary (W-2) income if you actively participate and your MAGI is under $100k (phasing out to $0 by $150k); unused losses carry forward. On sale, claimed depreciation is recaptured at up to 25%, and gains may owe capital-gains tax (a 1031 exchange can defer both). Figures are a year-1 estimate at your 24.0% rate — not tax advice; consult a CPA.
Schools (NCES district)
- District
- Fremont County School District #25
- NCES district ID
- 5605220
- Math proficiency
- 38% ▼ -5.00%
- Reading proficiency
- 48% ▼ -1.00%
- Median HH income
- $47,564
- Composite
- 36.71/100
- National rank
- #4596
- State rank
- #36 of 41 in WY
Livability — Riverton
- Score
- 65/100
- State rank
- #79
- US rank
- #12716
Category grades
Schools grade is shown separately in the Schools card above.
Census & demographics
- County
- Fremont County · 19,413 people
- City population
- 19,413
- Metro
- Riverton, WY
- Population (ZIP)
- 19,413
- Household income
- $60,449
- Rent vs Own
- Severe rent burden
- 304.0
Population outlook (Fremont County) Hauer SSP2
- Today (2025)
- 39,368 people
- By 2030
- 38,412 · -2.4%
- By 2040
- 36,224 · -8.0%
- By 2050
- 34,314 · -12.8%
- By 2075
- 30,353 · -22.9%
- By 2100
- 25,821 · -34.4%
Race, ethnicity, and origin ACS 2023
- Neighborhood character
- Predominantly White (72%)
- Race & ethnicity
- White 72% Native American 13% Hispanic / Latino 9% Two or more races 7%
- Hispanic origin (detail)
- Mexican 7%
- Common ancestry
- Portuguese 4% Lithuanian 3% Italian 3%
- Foreign-born
- 2% · Canada
- Languages at home
- 95% English-only · Spanish 2% Tagalog/Filipino 1%
Political lean MEDSL · Fremont
- 2024 margin
- Solid R (+37.4) · D 30.4% · R 67.7% · Other 1.9%
- 2008→2024 swing
- -8.6pp toward R · 2008: -28.8pp · 2024: -37.4pp
- All cycles
- 2024: R+37.4 2020: R+35.8 2016: R+42.1 2012: R+34.1 2008: R+28.8
Not yet ingested
- Civics
- —
Market trends
- HPI YoY
- ▼ -201.60%
- Current HPI
- 139.0105
- Rent YoY
- —
- Metro
- Riverton, WY
- State GDP YoY
- —
- F500 in state
- 0
Price history
1 event — show timeline
- 2026-05-07 Listed $95,000 WMLS
Property tax history
+5.0%/yrLatest (2025): $484 · -0.6% YoY. Source: county tax records.
Cash-flow waterfall
monthlySold comps — $/sqft
last 12 mo · ≤1 miLoading sold comps…