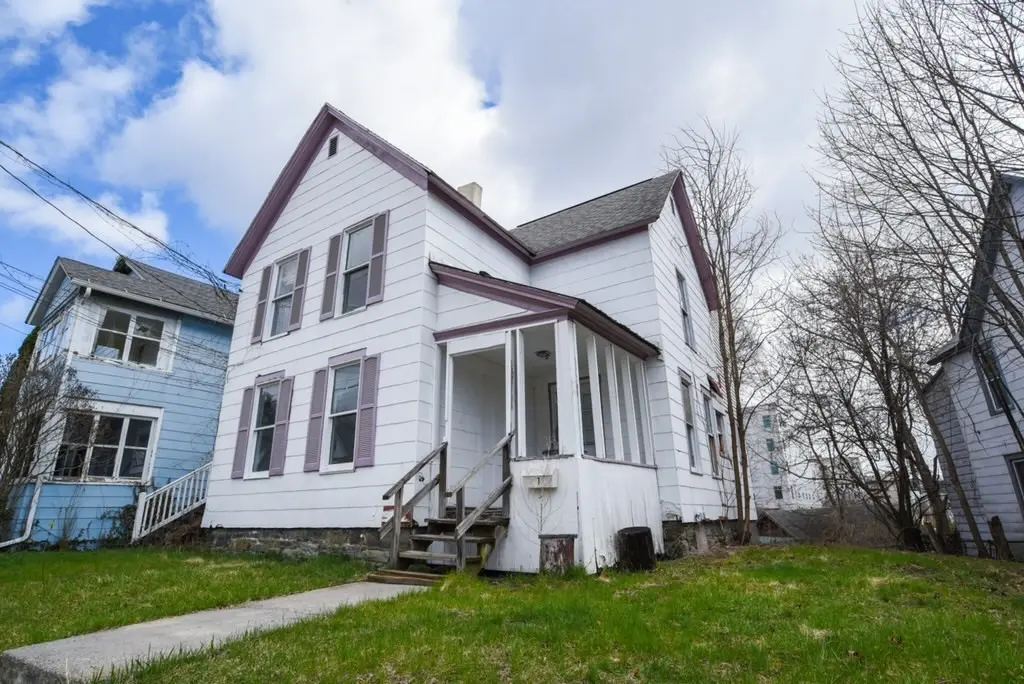
71 St Charles St · Johnson City, NY
Flood risk 1/10 · Minimal
- FEMA flood zone
- X
- Chance of flooding over 30 yrs
- 0.0%
- Est. flood insurance / yr
- $473 – $860
Fire risk 3/10 · Minor
- Est. fire insurance / yr
- $691 – $1,283
Heat risk 3/10 · Minor
- Hot days now (above 94°F)
- 8 days/yr
- Hot days in 30 yrs
- 17 days/yr
Wind risk 2/10 · Minimal
- Chance of severe wind over 30 yrs
- 1.0%
Air-quality risk 2/10 · Minimal
- Unhealthy air days now
- 0 days/yr
- Unhealthy air days in 30 yrs
- 1 days/yr
Risk factors via First Street. Map © Google.
Why this score? — see what drove the A grade
The composite is a weighted blend of 9 inputs, each scored 0–100. Each bar is that input's sub-score; the figure is the points it added to the 100-point composite (weight × sub-score).
- Cash flow +30.0/30.0
- ARV discount +15.0/15.0
- 1% rule +10.0/10.0
- DSCR +10.0/10.0
- Appreciation +10.0/10.0
- Rent growth +4.9/5.0
- Livability +3.8/5.0
- Schools +3.3/10.0
- Condition / age +2.5/5.0
$89,999
🖨 Deal sheet 📄 Offer letter ✓ Due diligence
Listing remarks MLS
Bring your toolbox and creativity to this versatile 4 bedroom, 2 bathroom starter home located just minutes from downtown Johnson City. Perfect for buyers seeking a great deal and the opportunity to build equity, this home offers strong potential for customization. Situated on a manageable lot, the backyard borders the Wilson Hospital campus, providing a unique and highly accessible location close to major employers, shopping, and everyday amenities. Whether you're an owner occupant looking to build sweat equity or an investor searching for your next project, this property is full of opportunity!
Key facts
- Accessible location
- Manageable lot
- 6,969 sq ft lot
Tags
Neighborhood map
What this means for you Summary
Snapshot
- This is a 6-bed/2.0-bath single-family listed at $90k.
Deal economics
- At list price, monthly cash flow is $665 ($8k/yr) — positive.
- The deal already cash-flows at list — no discount required.
- Meets the 1% rule at list price ($2k rent vs $90k).
- Recommended offer: $85k (6.0% below list) — sets the bar for market timing.
- Cap rate 15.2% vs local median 6.2% in Johnson City — top-decile yield for the area; either an underpriced asset or a hidden risk that comps aren't pricing in. Stress-test before assuming the spread holds.
Location & tenants
- Location reads 76/100 on livability (#238 in NY, #3,739 nationally) — a middle-class / working-renter tenant base. Strengths: cost of living A+, housing A+, health & safety A+; Watch: crime F, employment D-.
- Johnson City Central School District (suburban): math 38% / reading 41% proficiency, ranked #535 of 590 in NY (top 91%) — families likely to look elsewhere, expect single-tenant / working-renter base with shorter leases.
- Market conditions: Rents rising fast (+9.5%/yr); 99 active listings in the ZIP; 340 units permitted in Broome County in 2024 (269 in 5+ unit buildings).
- This rent runs 39% of the median local income ($59k/yr) — at the standard rent-burdened threshold; future hikes will face affordability resistance.
Forward outlook
- In year one you build about $10k of equity ($622 loan paydown + $9k appreciation (10.0% local appreciation)).
- Broome County population projected at -13% by 2050 — secular population decline; favor cash flow + early exit over multi-decade hold.
- At projected returns (10.0% appreciation + 8.0% rent growth), your $25k cash investment doubles in ~2 years — after that, you're playing with house money.
- By year 4, paydown + projected appreciation supports a ~$34k cash-out refi (75% LTV) — recoverable capital for the next deal without selling this one.
Negotiation context
- It's been on market 67 days — a 6% lower offer ($85k) is reasonable based on typical stale-listing flexibility.
- 2 sale attempts since 24y ago; this cycle's ask has dropped $20k (18%) from the opening price — seller is motivated, your offer sets the floor, not the list.
- Current owner paid $16k; list at $90k implies a 462% gain — meaningful room to come down on a strong offer.
Risks & watch-outs
- Watch-outs: property tax is 4.7% of price; built in 1920 — expect roof / HVAC / electrical / plumbing capex.
Questions for the listing agent
- It's been on market 67 days. Have you received any prior offers? Is the seller open to a 6% concession, seller financing, or rate buy-down credit?
- Built in 1920 — when were the roof, HVAC, electrical panel, plumbing, and water heater last replaced?
- Property tax is high relative to price — has the assessment been appealed recently, and will the sale trigger a re-assessment?
- Why hasn't it sold? Are there any deal-killer items the seller is aware of (foundation, flood, title, zoning, code violations)?
- Is there a deadline driving the sale (1031 exchange, divorce, estate, relocation)? That informs how much negotiation room exists.
- Crime grade is F in this area — have there been break-ins, vandalism, or insurance claims at this property in the last 3 years? What carrier currently insures it and at what premium?
- What's the average days-on-market for RENTAL listings here right now (not sales)? A rising rental-DOM trend means longer vacancies and softer asking-rent achievability than the comps imply.
- What's the recent tenant-quality profile in this submarket — average credit score on applications, eviction rate, late-payment / NSF rate, and stable-employment percentage? A property-management company in the area should have these aggregated.
- How much new for-sale + rental construction is in the pipeline within 1–3 miles? Heavy new supply typically softens prices + rents 12–24 months out; constrained supply supports both.
Investment metrics
- 1% rule
- 2.15% ✓
- Cap rate
- 15.16%
- Cash-on-cash
- 31.66%
- DSCR
- 2.41
- GRM
- 3.9
CMA / ARV
- ARV (median comp)
- $138,230
- List price
- $89,999
- Delta
- -34.89%
- Verdict
- UNDERPRICED
- Comps
- 20 within 1.0 mi
Show comp detail 2 sales within ~0.75 mi
| Address | Dist | Beds/Ba | Sqft | Sold | Price | $/sf | Match |
|---|---|---|---|---|---|---|---|
| 25 Concord St | 0.52mi | 5/2.0 (-1) | 1,440 (-1%) | 19mo | $200,000 | $139 | 54 |
| 211 Floral Ave | 0.41mi | 5/2.0 (-1) | 1,238 (-14%) | 10mo | $170,000 | $137 | 44 |
Match score weights: distance 35% · size 25% · config 20% · recency 20%. Top-matched comps best support the ARV.
Projected returns pro-forma
10.0% appreciation · 8.0% rent growth · sell at horizon
- IRR
- 52.2%
- Equity multiple
- 5.04×
- Total profit
- $101,749
- Equity at exit
- $81,078
- IRR
- 48.3%
- Equity multiple
- 12.59×
- Total profit
- $291,999
- Equity at exit
- $174,848
Cash invested: $25,200 (down + closing). Projections, not guarantees.
Landlord ↔ Tenant lean methodology
- Overall (STATE)
- 15 Strongly Tenant-Friendly
- State New York
- 15 Strongly Tenant-Friendly · D+10
- County
- — inherits STATE
- City
- — inherits STATE
ZIP-level market 13790
- Home prices YoY
- 6.8%
- Rents YoY
- 9.5%
- Active inventory
- 99
- Price-to-rent
- 3.9×
Monthly cashflow live
- Estimated rent
- $1,933 medium interval (Pro) →
- Mortgage (P&I)
- −$472
- Tax from tax record
- −$353 /mo · $4,235/yr
- Insurance
- −$37
- HOA
- −$0
- Vacancy / Maint / Mgmt
- −$406
- Net cashflow
- $665
Break-even live
UW: 25.0% down · 7.5% · 30yr · 1.5% tax · 5.0% vac · 8.0% maint · 8.0% mgmt
Financing live
Cash to close
- Down payment
- $22,500
- Closing costs
- $2,700
- Reserves months
- —
- Total cash needed
- —
Loan-product check · same deal, 3 products live
Conventional
25% down · 7.5% · 30yr
- Down + closing
- —
- Monthly P&I
- —
- Monthly cashflow
- —
- DSCR
- —
- Eligible?
- —
Personal DTI + credit; lowest rate.
DSCR
20% down · 8.5% · 30yr
- Down + closing
- —
- Monthly P&I
- —
- Monthly cashflow
- —
- DSCR
- —
- Eligible?
- —
No personal income docs; deal must DSCR.
Hard money
10% down · 12.0% · 12mo
- Down + closing
- —
- Monthly P&I
- —
- Monthly cashflow
- —
- DSCR
- —
- Eligible?
- —
Short-term bridge; refi at stabilization.
Listing history 21 events
-
2026-06-19days on market $89,999 Active 67 DOM
-
2026-06-18days on market $89,999 Active 66 DOM
-
2026-06-17days on market $89,999 Active 65 DOM
-
2026-06-16days on market $89,999 Active 64 DOM
-
2026-06-15days on market $89,999 Active 63 DOM
-
2026-06-14days on market $89,999 Active 61 DOM
-
2026-06-13pricedays on market $89,999 Active 60 DOM
-
2026-06-10days on market $100,000 Active 58 DOM
-
2026-06-09days on market $100,000 Active 57 DOM
-
2026-06-08days on market $100,000 Active 56 DOM
-
2026-06-07days on market $100,000 Active 55 DOM
-
2026-06-05days on market $100,000 Active 52 DOM
-
2026-06-03days on market $100,000 Active 51 DOM
-
2026-06-02days on market $100,000 Active 50 DOM
-
2026-06-01days on market $100,000 Active 49 DOM
-
2026-05-31days on market $100,000 Active 48 DOM
-
2026-05-30days on market $100,000 Active 47 DOM
-
2026-05-19price $100,000 662-char remark
Show marketing remark (662 chars)
Bring your toolbox and creativity to this versatile 4 bedroom, 2 bathroom starter home located just minutes from downtown Johnson City. Perfect for buyers seeking a great deal and the opportunity to build equity, this home offers strong potential for customization. Situated on a manageable lot, the backyard borders the Wilson Hospital campus, providing a unique and highly accessible location close to major employers, shopping, and everyday amenities. Whether you're an owner occupant looking to build sweat equity or an investor searching for your next project, this property is full of‌‌‌‌‌‌‌ opportunity!
-
2026-04-13$110,000 Active 662-char remark
Show marketing remark (662 chars)
Bring your toolbox and creativity to this versatile 4 bedroom, 2 bathroom starter home located just minutes from downtown Johnson City. Perfect for buyers seeking a great deal and the opportunity to build equity, this home offers strong potential for customization. Situated on a manageable lot, the backyard borders the Wilson Hospital campus, providing a unique and highly accessible location close to major employers, shopping, and everyday amenities. Whether you're an owner occupant looking to build sweat equity or an investor searching for your next project, this property is full of‌‌‌‌‌‌‌ opportunity!
-
2002-08-19soldstatus $16,000 181-char remark
Show marketing remark (181 chars)
MODERN FURNACE, 1ST FLR LAUNDRY. APPLIANCES AS IS: 1ST FLR REFRIG, WASHER & DRYER IN BSMT. ALL INCOME & EXPENSES ESTIMATED. WALKING DISTANCE TO WILSON HOSPITAL/DOWNTOWN.
-
2002-02-08$24,500 181-char remark
Show marketing remark (181 chars)
MODERN FURNACE, 1ST FLR LAUNDRY. APPLIANCES AS IS: 1ST FLR REFRIG, WASHER & DRYER IN BSMT. ALL INCOME & EXPENSES ESTIMATED. WALKING DISTANCE TO WILSON HOSPITAL/DOWNTOWN.
ⓘ Source: listings_history table (triggers on properties + properties_extension) + one-shot
backfill from property_details.listing_events for pre-trigger history.
Tax reassessment forecast NY · Partial reset (capped growth)
- Current annual tax
- $4,235 · $353/mo
- Projected year-2 tax
- $4,235 · $353/mo
- Expected delta
- $0/yr ($0/mo · 0.0%)
ⓘ Screening estimate from a state-policy table — verify with the county assessor before closing.
Climate risk First Street
- Flood 1/10 Low FEMA zone X · 0% chance over 30 yrs
- Wildfire 3/10 Moderate
- Heat 3/10 Moderate 8 d/yr ≥94°F today · 17 d/yr by 30 yrs out
- Wind 2/10 Low 100% chance of damaging wind over 30 yrs
- Air quality 2/10 Low 0 unhealthy d/yr today · 1 by 30 yrs out
Nearby sold comps map
Loading sold comps map…
Walkable amenities ~0.75 mi
Loading nearby amenities…
Taxation est. · year 1
- Rental income
- $23,197
- − Mortgage interest
- −$5,041
- − Property taxes
- −$4,235
- − Insurance
- −$450
- − Repairs & maintenance
- −$1,856
- − Management
- −$1,856
- − Depreciation
- −$2,618
- Taxable income
- $7,141
- Est. tax owed @ 24.0%
- −$1,714
- After-tax cash flow
- $6,263/yr
For passive investors: Depreciation is non-cash, so a rental often shows a tax loss while cash-flowing — sheltering income. Rental losses are passive: they offset passive income freely, and up to $25,000/yr can offset ordinary (W-2) income if you actively participate and your MAGI is under $100k (phasing out to $0 by $150k); unused losses carry forward. On sale, claimed depreciation is recaptured at up to 25%, and gains may owe capital-gains tax (a 1031 exchange can defer both). Figures are a year-1 estimate at your 24.0% rate — not tax advice; consult a CPA.
Schools (NCES district)
- District
- Johnson City Central School District
- NCES district ID
- 3615900
- Math proficiency
- 38% ▼ -8.00%
- Reading proficiency
- 41% ▲ 2.00%
- Median HH income
- $40,514
- Composite
- 33.17/100
- National rank
- #5545
- State rank
- #535 of 590 in NY
Livability — Johnson City
- Score
- 76/100
- State rank
- #238
- US rank
- #3739
Category grades
Schools grade is shown separately in the Schools card above.
Census & demographics
- Census place
- Johnson City, NY
- County
- Broome County · 126,805 people
- City population
- 18,739
- Metro
- Binghamton, NY
- Population (ZIP)
- 18,739
- Household income
- $59,045
- Rent vs Own
- Severe rent burden
- 1233.0
Population outlook (Broome County) Hauer SSP2
- Today (2025)
- 187,989 people
- By 2030
- 183,066 · -2.6%
- By 2040
- 172,228 · -8.4%
- By 2050
- 163,161 · -13.2%
- By 2075
- 153,641 · -18.3%
- By 2100
- 140,851 · -25.1%
Race, ethnicity, and origin ACS 2023
- Neighborhood character
- Predominantly White (75%)
- Race & ethnicity
- White 75% Two or more races 9% Asian 8% Black 6% Hispanic / Latino 4%
- Common ancestry
- Romanian 6% Lithuanian 3% Scotch-Irish 2%
- Foreign-born
- 9% · Canada, China, Vietnam
- Languages at home
- 88% English-only · Other Indo-European 4% French/Haitian/Cajun 2% Spanish 2%
Political lean MEDSL · Broome
- 2024 margin
- Toss-up / Even · D 50.2% · R 49.8%
- 2008→2024 swing
- -7.6pp toward R · 2008: 8.0pp · 2024: 0.4pp
- All cycles
- 2024: D+0.4 2020: D+3.5 2016: R+3.7 2012: D+4.6 2008: D+8.0
Not yet ingested
- Civics
- —
Market trends
- HPI YoY
- ▲ 18.06%
- Current HPI
- 285.3668
- Rent YoY
- ▲ 9.47%
- Metro
- Binghamton, NY
- State GDP YoY
- ▲ 2.60%
- F500 in state
- 92
Industry mix (Fortune 500 HQ in NY)
| Industry | F500 HQs | Revenue |
|---|---|---|
| Financial Services | 10 | $950B |
|
||
| Consumer Goods | 9 | $162B |
|
||
| Insurance | 4 | $225B |
|
||
| Telecommunications | 2 | $144B |
|
||
| Pharmaceuticals | 2 | $112B |
|
||
| Media / Entertainment | 2 | $69B |
|
||
Price history
+308.2% since first listed4 events — show timeline
- 2026-05-19 Price Changed $100,000 GBAOR
- 2026-04-13 Listed $110,000 GBAOR
- 2002-08-19 Sold (MLS) $16,000 GBAOR
- 2002-02-08 Listed $24,500 GBAOR
Property tax history
+2.2%/yrLatest (2025): $4,235 · +1.7% YoY. Source: county tax records.
Cash-flow waterfall
monthlySold comps — $/sqft
last 12 mo · ≤1 miLoading sold comps…