245 Rumsey Rd Unit 6O · Yonkers, NY
Flood risk 6/10 · Moderate
- FEMA flood zone
- X (unshaded)
- Chance of flooding over 30 yrs
- 0.75%
- Est. flood insurance / yr
- $473 – $860
Fire risk 2/10 · Minimal
- Est. fire insurance / yr
- $691 – $1,283
Heat risk 6/10 · Moderate
- Hot days now (above 99°F)
- 7 days/yr
- Hot days in 30 yrs
- 15 days/yr
Wind risk 6/10 · Moderate
- Chance of severe wind over 30 yrs
- 27.0%
Air-quality risk 3/10 · Minor
- Unhealthy air days now
- 3 days/yr
- Unhealthy air days in 30 yrs
- 4 days/yr
Risk factors via First Street. Map © Google.
Why this score? — see what drove the C- grade
The composite is a weighted blend of 9 inputs, each scored 0–100. Each bar is that input's sub-score; the figure is the points it added to the 100-point composite (weight × sub-score).
- Cash flow +15.1/30.0
- 1% rule +9.4/10.0
- ARV discount +7.5/15.0
- DSCR +4.6/10.0
- Schools +4.1/10.0
- Rent growth +3.6/5.0
- Livability +3.4/5.0
- Condition / age +2.5/5.0
- Appreciation +0.0/10.0
$199,900
🖨 Deal sheet 📄 Offer letter ✓ Due diligence
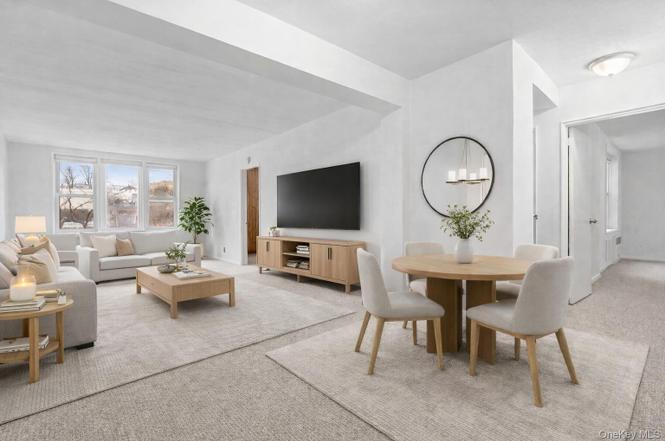
Listing remarks
Welcome home to this bright and spacious 2-bedroom, 1-bath cooperative in the well-maintained Parkview complex in Yonkers. Freshly painted throughout and featuring brand new wall-to-wall carpeting, this move-in-ready apartment offers generous room sizes, excellent natural light, and a clean, refreshed feel. The oversized living room provides ample space for both relaxing and entertaining, while the adjacent dining area easily accommodates a full dining setup. The kitchen features classic white cabinetry, granite countertops, stainless steel appliances, and warm wood flooring, creating a functional and timeless cooking space. Both bedrooms are well proportioned with great closet space, inclu
Key facts
- Wood flooring
- Full dining setup
- Great closet space
Tags
Property features AI
Finance
- HOA & community: Cooperative ownership
Exterior
- Parking: Assigned parking (monthly fee applicable)
- Utilities: Public sewer; Cable available; Electricity available and connected; Trash collection (public)
- Home design: Stock cooperative
- Construction: Brick construction
- Exterior features: Brick construction; Not waterfront
Interior
- Kitchen: Dishwasher; Gas cooktop; Gas oven; Refrigerator; Stainless steel appliances
- Bathrooms: One full bathroom
- Heating & cooling: Hot water heating; Wall/window air conditioning units
- Interior features: Elevator; Granite counters
Neighborhood map
What this means for you Summary
Snapshot
- This is a 2-bed/1.0-bath condo listed at $200k.
Deal economics
- At list price, monthly cash flow is $64 ($772/yr) — positive.
- The deal already cash-flows at list — no discount required.
- Meets the 1% rule at list price ($3k rent vs $200k).
- Recommended offer: $197k (1.5% below list) — sets the bar for market timing.
- Cap rate 6.7% vs local median 5.3% in Yonkers — meaningfully above typical; check what's discounted (condition, days-on-market, listing class) to confirm the premium yield is real.
Location & tenants
- Location reads 68/100 on livability (#528 in NY) — a middle-class / working-renter tenant base. Strengths: employment A, commute B; Watch: amenities F, cost of living F.
- Yonkers City School District (suburban): math 41% / reading 54% proficiency, ranked #413 of 590 in NY (top 70%) — families likely to look elsewhere, expect single-tenant / working-renter base with shorter leases; 64% free/reduced lunch — lower-income household profile, screen leases tightly.
- Zoned schools: Yonkers Early Childhood Academy (327 students, 72% FRL); Yonkers Middle School (math 17% / reading 37%, grade F, #587 of 729 statewide, top 81%, 601 students, 88% FRL); Yonkers High School (math 92% / reading 88%, grade A+, #238 of 1,100 statewide, top 23%, 1,060 students, 76% FRL) — zoned schools average 79% FRL vs 64% district-wide (15 pts higher); higher-poverty schools than district average — tighter screening recommended.
- Market conditions: Rents rising fast (+4.4%/yr); 183 active listings in the ZIP; 40 comparable units currently listed for rent nearby; rentals at typical pace (median 19d on market — plan ~3-4 weeks tenant-placement turnaround); 954 units permitted in Westchester County in 2024 (649 in 5+ unit buildings).
- At $2,871/mo this rent would consume 53% of the median local household income ($65k/yr) (locally 6045% of renters already pay >50% of income on rent) — very limited rent-growth headroom before tenants either downsize or default.
Forward outlook
- Local home prices are declining (-3.0%/yr); year-one equity from $1k of loan paydown is wiped out by about $6k of value loss. Plan a longer hold.
- Westchester County population projected at +10% by 2050 — modest demand growth; plan on rents tracking national, not racing it.
Negotiation context
- It's been on market 27 days — a 2% lower offer ($197k) is reasonable based on typical stale-listing flexibility.
- 5 sale attempts since 3y ago with the ask held roughly flat each time — persistent listings suggest the price (not the market) is what's stuck; bring a comps-based counter.
Risks & watch-outs
- Watch-outs: HOA is 29% of rent; built in 1958 — expect roof / HVAC / electrical / plumbing capex.
- Climate carrying-cost: major flood risk; major wind risk, 27% chance of damaging wind over 30y; extreme-heat days projected 7→15/yr by 2055 (HVAC capex compounding) — expect insurance premiums to compound above CPI over the hold.
Questions for the listing agent
- Built in 1958 — when were the roof, HVAC, electrical panel, plumbing, and water heater last replaced?
- What does the HOA fee cover, when was the last increase, and are there any pending special assessments or reserve-fund shortfalls?
- Any open or pending special assessments — roof, HVAC, plumbing, elevator, façade? What's the per-unit balance and payoff schedule, and is the seller paying it off at close or rolling it to the buyer?
- Is there a deadline driving the sale (1031 exchange, divorce, estate, relocation)? That informs how much negotiation room exists.
- What's the average days-on-market for RENTAL listings here right now (not sales)? A rising rental-DOM trend means longer vacancies and softer asking-rent achievability than the comps imply.
- What's the recent tenant-quality profile in this submarket — average credit score on applications, eviction rate, late-payment / NSF rate, and stable-employment percentage? A property-management company in the area should have these aggregated.
- How much new apartment / multifamily construction is in the pipeline within 1–3 miles? Heavy new supply (>2% of stock underway) typically softens rents 12–24 months out; light construction supports rent growth.
Investment metrics
- 1% rule
- 1.44% ✓
- Cap rate
- 6.68%
- Cash-on-cash
- 1.38%
- DSCR
- 1.06
- GRM
- 5.8
CMA / ARV
No comps found within radius.
Projected returns pro-forma
-3.0% appreciation · 4.39% rent growth · sell at horizon
- IRR
- -11.4%
- Equity multiple
- 0.58×
- Total profit
- $-23,676
- Equity at exit
- $29,806
- IRR
- 0.9%
- Equity multiple
- 1.07×
- Total profit
- $4,071
- Equity at exit
- $17,284
Cash invested: $55,972 (down + closing). Projections, not guarantees.
Landlord ↔ Tenant lean methodology
- Overall (CITY)
- 5 Strongly Tenant-Friendly
- State New York
- 15 Strongly Tenant-Friendly · D+10
- County
- — inherits STATE
- City Yonkers
- 5 Strongly Tenant-Friendly · D+20
ZIP-level market 10701
- Rents YoY
- 4.4%
- Active inventory
- 183
- Price-to-rent
- 5.8×
Monthly cashflow live
- Estimated rent
- $2,871 high interval (Pro) →
- Mortgage (P&I)
- −$1,048
- Tax est. 1.5%
- −$250 /mo · $2,998/yr
- Insurance
- −$83
- HOA est. from 3 same-building comps
- −$822
- Vacancy / Maint / Mgmt
- −$603
- Net cashflow
- $64
Break-even live
UW: 25.0% down · 7.5% · 30yr · 1.5% tax · 5.0% vac · 8.0% maint · 8.0% mgmt
Financing live
Cash to close
- Down payment
- $49,975
- Closing costs
- $5,997
- Reserves months
- —
- Total cash needed
- —
Loan-product check · same deal, 3 products live
Conventional
25% down · 7.5% · 30yr
- Down + closing
- —
- Monthly P&I
- —
- Monthly cashflow
- —
- DSCR
- —
- Eligible?
- —
Personal DTI + credit; lowest rate.
DSCR
20% down · 8.5% · 30yr
- Down + closing
- —
- Monthly P&I
- —
- Monthly cashflow
- —
- DSCR
- —
- Eligible?
- —
No personal income docs; deal must DSCR.
Hard money
10% down · 12.0% · 12mo
- Down + closing
- —
- Monthly P&I
- —
- Monthly cashflow
- —
- DSCR
- —
- Eligible?
- —
Short-term bridge; refi at stabilization.
Rent comps 40 comps
| Address | Beds | Baths | Sqft | Rent | $/sqft | DOM | Units | Dist |
|---|---|---|---|---|---|---|---|---|
| 39 Spruce St Unit 1 Yonkers, NY | 3.0 | 1.5 | 920 | $3,300 | $3.59 | 44d | 1 | 0.16mi |
| 189 Elm St Unit 1 Yonkers, NY | 3.0 | 1.0 | 1000 | $2,650 | $2.65 | 44d | 1 | 0.41mi |
| 162 Willow St Yonkers, NY | 1.0 | 1.0 | 700 | $2,100 | $3.00 | 7d | 1 | 0.41mi |
| 162 Willow St Unit 1F Yonkers, NY | 1.0 | 1.0 | 700 | $2,200 | $3.14 | 15d | 1 | 0.41mi |
| 11 Garfield St Unit 2 Yonkers, NY | 2.0 | 1.0 | 1250 | $2,250 | $1.80 | 15d | 1 | 0.46mi |
| 39 Victor St Unit 2 Yonkers, NY | 3.0 | 1.0 | 900 | $2,650 | $2.94 | 44d | 1 | 0.48mi |
| 45 Linden St Yonkers, NY | 3.0 | 3.0 | 800 | $3,100 | $3.88 | 4d | 1 | 0.60mi |
| 20 Porach St Apt -1B Yonkers, NY | 2.0 | 1.0 | 750 | $2,400 | $3.20 | 44d | 1 | 0.62mi |
| 14 Highland Ave Unit 2A Yonkers, NY | 1.0 | 1.0 | 1000 | $1,500 | $1.50 | 19d | 1 | 0.69mi |
| 594 Yonkers Ave Unit 5 Yonkers, NY | 2.0 | 1.0 | 900 | $2,500 | $2.78 | 24d | 1 | 0.71mi |
| 594 Yonkers Ave Unit 5 Yonkers, NY | 2.0 | 1.0 | 900 | $2,500 | $2.78 | 44d | 1 | 0.71mi |
| 65 Caroline Ave Unit 1L Yonkers, NY | 3.0 | 1.0 | 1050 | $2,700 | $2.57 | 44d | 1 | 0.73mi |
| 52 Groshon Ave Apt 2N Yonkers, NY | 3.0 | 1.0 | 1000 | $2,469 | $2.47 | 44d | 1 | 0.75mi |
| 36 Dunwoodie St Unit 1 Yonkers, NY | 3.0 | 1.0 | 1300 | $3,500 | $2.69 | 44d | 1 | 0.78mi |
| 23 Alida St Unit 2s Yonkers, NY | 2.0 | 1.0 | 1000 | $2,900 | $2.90 | 24d | 1 | 0.79mi |
| 30 Locust Hill Ave Yonkers, NY | 1.0–2.0 | 1.0 | 735 | $2,500 | $3.40 | 44d | 3 | 0.81mi |
| 30 Locust Hill Ave Yonkers, NY | 1.0–2.0 | 1.0 | 735 | $2,500 | $3.40 | 7d | 2 | 0.81mi |
| 106 McLean Ave Yonkers, NY | 3.0 | 1.0 | 1000 | $3,200 | $3.20 | 44d | 1 | 0.82mi |
| 4 Ritters Ln Unit 1FL Yonkers, NY | 3.0 | 1.0 | 1100 | $3,300 | $3.00 | 44d | 1 | 0.86mi |
| 50 Nepperhan St Yonkers, NY | 3.0 | 1.0–2.0 | 887 | $4,063 | $4.58 | 2d | 20 | 0.96mi |
| 52 Lewis Pkwy Unit 1545731P Yonkers, NY | 3.0 | 2.0 | 1496 | $5,806 | $3.88 | 15d | 1 | 0.97mi |
| 50 Main St Unit 3F Yonkers, NY | 1.0 | 1.0 | 900 | $2,000 | $2.22 | 24d | 1 | 0.98mi |
| 44 Hudson St Yonkers, NY | 2.0 | 1.0–2.0 | 922 | $4,300 | $4.66 | 7d | 25 | 0.98mi |
| 14 Chamberlain Ave Unit 1 Yonkers, NY | 2.0 | 2.0 | 1150 | $4,200 | $3.65 | 10d | 1 | 0.99mi |
| 16 Pier St Yonkers, NY | 3.0 | 1.0 | 1000 | $3,200 | $3.20 | 16d | 1 | 0.99mi |
| 212 Buena Vista Ave Unit 3F Yonkers, NY | 1.0 | 1.0 | 800 | $2,100 | $2.62 | 19d | 1 | 1.00mi |
| 85 Bennett Ave Unit 2 Yonkers, NY | 2.0 | 1.0 | 1000 | $2,500 | $2.50 | 44d | 1 | 1.01mi |
| 66 Main St Yonkers, NY | 2.0 | 1.0–2.0 | 906 | $3,323 | $3.67 | 3d | 4 | 1.01mi |
| 117 Morris St Yonkers, NY | 1.0 | 1.0 | 700 | $2,000 | $2.86 | 5d | 1 | 1.02mi |
| 57 Putnam Ave Yonkers, NY | 2.0 | 1.0 | 900 | $3,000 | $3.33 | 22d | 1 | 1.03mi |
| 57 Putnam Ave Yonkers, NY | 2.0 | 1.0 | 900 | $3,000 | $3.33 | 11d | 1 | 1.03mi |
| 280 Hawthorne Ave Yonkers, NY | 1.0 | 1.0 | 700 | $2,100 | $3.00 | 7d | 2 | 1.03mi |
| 1 Alexander St Yonkers, NY | 2.0 | 1.0–2.0 | 837 | $4,000 | $4.78 | 7d | 48 | 1.13mi |
| 250 N Broadway Unit 2E Yonkers, NY | 2.0 | 1.0 | 950 | $2,400 | $2.53 | 24d | 1 | 1.16mi |
| 249 McLean Ave Unit 1B Yonkers, NY | 1.0 | 1.0 | 700 | $2,500 | $3.57 | 18d | 1 | 1.16mi |
| 20 Water Grant St Yonkers, NY | 1.0–2.0 | 1.0–2.0 | 827 | $3,756 | $4.54 | 1d | 22 | 1.18mi |
| 57 Alexander St Yonkers, NY | 2.0 | 1.0–2.0 | 765 | $3,690 | $4.82 | 2d | 21 | 1.22mi |
| 79 Alexander St Yonkers, NY | 3.0 | 1.0–2.5 | 997 | $3,532 | $3.54 | 2d | 1 | 1.25mi |
| 155 Lake Ave Yonkers, NY | 3.0 | 1.0 | 1000 | $3,200 | $3.20 | 16d | 1 | 1.30mi |
| 150 Glenwood Ave Apt G1 Yonkers, NY | 1.0 | 1.0 | 850 | $2,000 | $2.35 | 44d | 1 | 1.31mi |
HOA detail condo
- Monthly dues
- $0 · $0/yr
- Assessments
- None detected in remarks — confirm with the listing agent.
Listing history 24 events
-
2026-06-18days on market $199,900 Active 27 DOM
-
2026-06-17days on market $199,900 Active 26 DOM
-
2026-06-16days on market $199,900 Active 25 DOM
-
2026-06-15days on market $199,900 Active 24 DOM
-
2026-06-13days on market $199,900 Active 22 DOM
-
2026-06-09days on market $199,900 Active 18 DOM
-
2026-06-08days on market $199,900 Active 17 DOM
-
2026-06-07days on market $199,900 Active 16 DOM
-
2026-06-04days on market $199,900 Active 13 DOM
-
2026-06-03days on market $199,900 Active 12 DOM
-
2026-06-02days on market $199,900 Active 11 DOM
-
2026-06-01days on market $199,900 Active 10 DOM
-
2026-05-31days on market $199,900 Active 9 DOM
-
2026-05-27status Active
-
2026-01-12$199,900 Active
-
2025-07-13historical
-
2025-06-24status Active
-
2025-03-11status Pending
-
2025-01-14price $169,000
-
2024-09-17price $179,999
-
2024-05-14status Active
-
2024-01-10status Pending
-
2023-12-06price $190,000
-
2023-10-16$200,000 Active
ⓘ Source: listings_history table (triggers on properties + properties_extension) + one-shot
backfill from property_details.listing_events for pre-trigger history.
Climate risk First Street
- Flood 6/10 Major FEMA zone X (unshaded) · 75% chance over 30 yrs
- Wildfire 2/10 Low
- Heat 6/10 Major 7 d/yr ≥99°F today · 15 d/yr by 30 yrs out
- Wind 6/10 Major 27% chance of damaging wind over 30 yrs
- Air quality 3/10 Moderate 3 unhealthy d/yr today · 4 by 30 yrs out
Nearby sold comps map
Loading sold comps map…
Walkable amenities ~0.75 mi
Loading nearby amenities…
Taxation est. · year 1
- Rental income
- $34,448
- − Mortgage interest
- −$11,198
- − Property taxes
- −$2,998
- − Insurance
- −$1,000
- − Repairs & maintenance
- −$2,756
- − Management
- −$2,756
- − HOA
- −$9,864
- − Depreciation
- −$5,815
- Taxable loss
- −$1,939
- Est. tax savings @ 24.0%
- +$465
- After-tax cash flow
- $1,237/yr
For passive investors: Depreciation is non-cash, so a rental often shows a tax loss while cash-flowing — sheltering income. Rental losses are passive: they offset passive income freely, and up to $25,000/yr can offset ordinary (W-2) income if you actively participate and your MAGI is under $100k (phasing out to $0 by $150k); unused losses carry forward. On sale, claimed depreciation is recaptured at up to 25%, and gains may owe capital-gains tax (a 1031 exchange can defer both). Figures are a year-1 estimate at your 24.0% rate — not tax advice; consult a CPA.
Schools (NCES district)
- District
- Yonkers City School District
- NCES district ID
- 3631920
- Math proficiency
- 41% ▼ -1.00%
- Reading proficiency
- 54% ▲ 14.00%
- Median HH income
- $58,042
- Composite
- 41.43/100
- National rank
- #3471
- State rank
- #413 of 590 in NY
Livability — Yonkers
- Score
- 68/100
- State rank
- #528
- US rank
- #9394
Category grades
Schools grade is shown separately in the Schools card above.
Census & demographics
- Census place
- Yonkers, NY
- County
- Westchester County · 709,332 people
- City population
- 212,407
- Metro
- New York-Newark-Jersey City, NY-NJ-PA
- Population (ZIP)
- 70,676
- Household income
- $64,776
- Rent vs Own
- Severe rent burden
- 6045.0
Population outlook (Westchester County) Hauer SSP2
- Today (2025)
- 1,028,035 people
- By 2030
- 1,051,636 · +2.3%
- By 2040
- 1,098,520 · +6.9%
- By 2050
- 1,136,044 · +10.5%
- By 2075
- 1,196,925 · +16.4%
- By 2100
- 1,175,147 · +14.3%
Race, ethnicity, and origin ACS 2023
- Neighborhood character
- Diverse neighborhood (Simpson 0.65)
- Race & ethnicity
- Hispanic / Latino 52% White 21% Black 21% Two or more races 18% Asian 3% Native American 1%
- Hispanic origin (detail)
- Mexican 11% Puerto Rican 9% Dominican 19%
- Common ancestry
- Romanian 1% Russian 1% Subsaharan African 1%
- Foreign-born
- 35% · Canada, Jamaica, South Korea
- Languages at home
- 45% English-only · Spanish 42% Other Indo-European 3% Arabic 2%
Political lean MEDSL · Westchester
- 2024 margin
- Strong D (+26.3) · D 63.1% · R 36.9%
- 2008→2024 swing
- -1.3pp toward R · 2008: 27.6pp · 2024: 26.3pp
- All cycles
- 2024: D+26.3 2020: D+36.3 2016: D+32.8 2012: D+22.2 2008: D+27.6
Not yet ingested
- Civics
- —
Market trends
- HPI YoY
- ▼ -373.14%
- Current HPI
- 332.0999
- Rent YoY
- ▲ 4.39%
- Metro
- New York-Newark-Jersey City, NY-NJ-PA
- State GDP YoY
- ▲ 2.60%
- F500 in state
- 92
Industry mix (Fortune 500 HQ in NY)
| Industry | F500 HQs | Revenue |
|---|---|---|
| Financial Services | 10 | $950B |
|
||
| Consumer Goods | 9 | $162B |
|
||
| Insurance | 4 | $225B |
|
||
| Telecommunications | 2 | $144B |
|
||
| Pharmaceuticals | 2 | $112B |
|
||
| Media / Entertainment | 2 | $69B |
|
||
Price history
-0.1% since first listed11 events — show timeline
- 2026-05-27 Relisted — OneKey® MLS as Distributed by MLS Grid
- 2026-01-12 Listed $199,900 OneKey® MLS as Distributed by MLS Grid
- 2025-07-13 Listing Removed — OneKey® MLS as Distributed by MLS Grid
- 2025-06-24 Relisted — OneKey® MLS as Distributed by MLS Grid
- 2025-03-11 Pending — OneKey® MLS as Distributed by MLS Grid
- 2025-01-14 Price Changed $169,000 OneKey® MLS as Distributed by MLS Grid
- 2024-09-17 Price Changed $179,999 OneKey® MLS as Distributed by MLS Grid
- 2024-05-14 Relisted — OneKey® MLS as Distributed by MLS Grid
- 2024-01-10 Pending — OneKey® MLS as Distributed by MLS Grid
- 2023-12-06 Price Changed $190,000 OneKey® MLS as Distributed by MLS Grid
- 2023-10-16 Listed $200,000 OneKey® MLS as Distributed by MLS Grid
Cash-flow waterfall
monthlySold comps — $/sqft
last 12 mo · ≤1 miLoading sold comps…