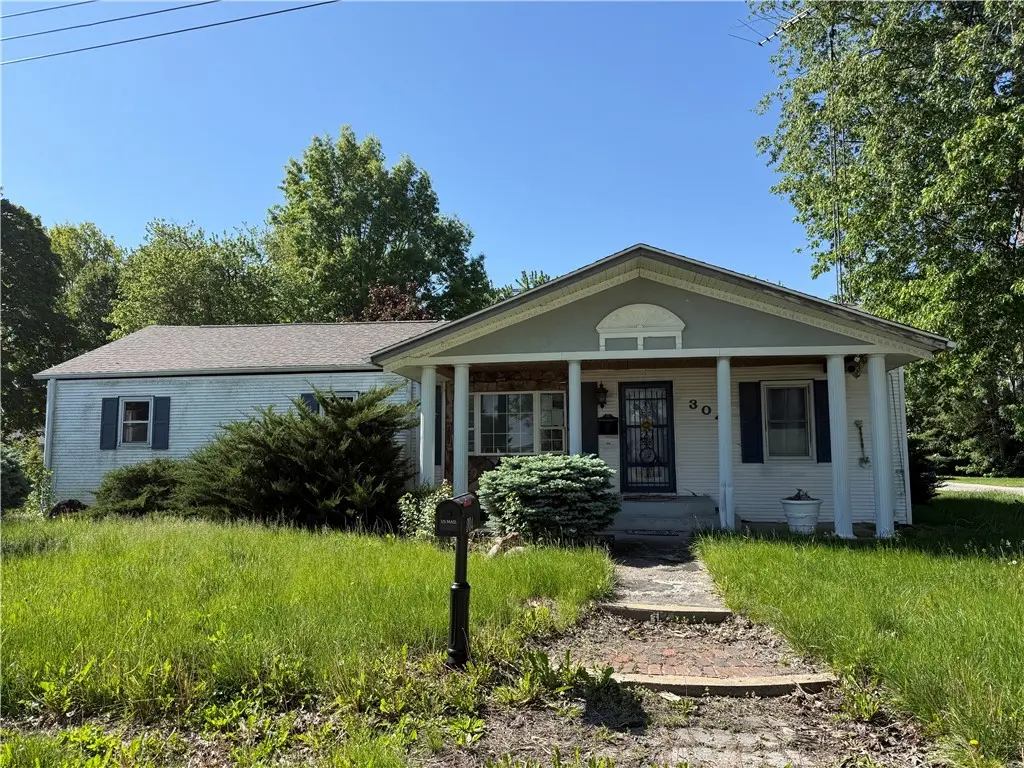
304 Buchanan St · Ashland, IL
Flood risk 1/10 · Minimal
- FEMA flood zone
- X (unshaded)
- Chance of flooding over 30 yrs
- 0.0%
- Est. flood insurance / yr
- $507 – $1,088
Fire risk 1/10 · Minimal
- Est. fire insurance / yr
- $804 – $1,492
Heat risk 3/10 · Minor
- Hot days now (above 105°F)
- 7 days/yr
- Hot days in 30 yrs
- 20 days/yr
Wind risk 2/10 · Minimal
- Chance of severe wind over 30 yrs
- 1.0%
Air-quality risk 2/10 · Minimal
- Unhealthy air days now
- 1 days/yr
- Unhealthy air days in 30 yrs
- 2 days/yr
Risk factors via First Street. Map © Google.
Why this score? — see what drove the D+ grade
The composite is a weighted blend of 9 inputs, each scored 0–100. Each bar is that input's sub-score; the figure is the points it added to the 100-point composite (weight × sub-score).
- Cash flow +20.9/30.0
- DSCR +6.6/10.0
- 1% rule +5.9/10.0
- ARV discount +4.1/15.0
- Livability +3.1/5.0
- Rent growth +2.5/5.0
- Condition / age +2.5/5.0
- Schools +2.1/10.0
- Appreciation +0.0/10.0
$94,900
🖨 Deal sheet (PDF) 📄 Offer letter ✓ Due diligence
Listing remarks
Welcome home to this charming 4 bedroom property that offers more space than meets the eye. Inside, you will find a surprisingly spacious layout featuring a large kitchen, generous bathroom, and a cozy fireplace that adds warmth and character. The expansive yard provides plenty of room for outdoor enjoyment, while the 2 car detached garage and additional 1 car detached garage offers abundant space for vehicles, storage, hobbies, or a workshop. Located in a quiet community with small-town schools, this home is full of potential and ready for its next owner to make it their own. A great opportunity to add your personal touch while enjoying the comfort and charm of small-town living.
Key facts
- 0.39 acre lot
- 3 garage spots
- Built 1940
Property features AI
Exterior
- Parking: Detached 3-car garage
- Utilities: Public water; Public sewer
- Home design: Single-family residence; One level / single-story
- Construction: Stone and stucco construction; Crawl space foundation; Built in 2026
- Exterior features: Shingle roof; Concrete and gravel road access; R-1 zoning
Interior
- Kitchen: Oven
- Bedrooms: 6 total rooms (includes bedrooms and living spaces)
- Bathrooms: 1 full bathroom
- Heating & cooling: Central air conditioning; Natural gas forced-air heating
- Interior features: Gas water heater; Oven; One fireplace
- Laundry & utility: Main level laundry
Neighborhood map
What this means for you Summary
Snapshot
- This is a 3-bed/1.0-bath other listed at $95k.
Deal economics
- At list price, monthly cash flow is $132 ($2k/yr) — positive.
- The deal already cash-flows at list — no discount required.
- Meets the 1% rule at list price ($1k rent vs $95k).
- Recommended offer: $92k (3.0% below list) — sets the bar for market timing.
Location & tenants
- Location reads 62/100 on livability (#875 in IL) — a middle-class / working-renter tenant base. Strengths: crime A+, cost of living A+, housing A+; Watch: schools F, amenities F, commute F.
- A-C Central CUSD 262 (rural): math 15% / reading 25% proficiency, ranked #691 of 919 in IL (top 75%) — low school quality limits family demand, transient renter base, plan for 1-2y turnover.
- Market conditions: 6 active listings in the ZIP; 2 units permitted in Cass County in 2024 (0 in 5+ unit buildings).
Forward outlook
- Local home prices are declining (-3.0%/yr); year-one equity from $656 of loan paydown is wiped out by about $3k of value loss. Plan a longer hold.
- Cass County population projected at -28% by 2050 — secular population decline; favor cash flow + early exit over multi-decade hold.
Negotiation context
- It's been on market 43 days — a 3% lower offer ($92k) is reasonable based on typical stale-listing flexibility.
- Current owner paid $30k; list at $95k implies a 222% gain — meaningful room to come down on a strong offer.
Risks & watch-outs
- Watch-outs: built in 1940 — expect roof / HVAC / electrical / plumbing capex.
Questions for the listing agent
- It's been on market 43 days. Have you received any prior offers? Is the seller open to a 3% concession, seller financing, or rate buy-down credit?
- Built in 1940 — when were the roof, HVAC, electrical panel, plumbing, and water heater last replaced?
- Is there a deadline driving the sale (1031 exchange, divorce, estate, relocation)? That informs how much negotiation room exists.
- Schools are F-rated, which usually means shorter tenancies and higher turnover. Who's the typical renter profile here, and what's been the actual vacancy rate?
- The area grade is low — what's the realistic commute time and amenity access for the typical tenant pool here? Any planned neighborhood developments (good or bad) we should know about?
- What's the average days-on-market for RENTAL listings here right now (not sales)? A rising rental-DOM trend means longer vacancies and softer asking-rent achievability than the comps imply.
- What's the recent tenant-quality profile in this submarket — average credit score on applications, eviction rate, late-payment / NSF rate, and stable-employment percentage? A property-management company in the area should have these aggregated.
- How much new for-sale + rental construction is in the pipeline within 1–3 miles? Heavy new supply typically softens prices + rents 12–24 months out; constrained supply supports both.
Investment metrics
- 1% rule
- 1.09% ✓
- Cap rate
- 7.96%
- Cash-on-cash
- 5.95%
- DSCR
- 1.26
- GRM
- 7.7
CMA / ARV
- ARV (median comp)
- $88,162
- List price
- $94,900
- Delta
- 7.64%
- Verdict
- FAIR
- Comps
- 4 within 1.0 mi
Projected returns pro-forma
-3.0% appreciation · 3.0% rent growth · sell at horizon
- IRR
- -7.1%
- Equity multiple
- 0.74×
- Total profit
- $-6,950
- Equity at exit
- $14,150
- IRR
- 2.6%
- Equity multiple
- 1.18×
- Total profit
- $4,891
- Equity at exit
- $8,205
Cash invested: $26,572 (down + closing). Projections, not guarantees.
Landlord ↔ Tenant lean methodology
- Overall (STATE)
- 43 Moderately Tenant-Leaning
- State Illinois
- 43 Moderately Tenant-Leaning · D+7
- County
- — inherits STATE
- City
- — inherits STATE
ZIP-level market 62612
- Home prices YoY
- -15.3%
- Active inventory
- 6
- Price-to-rent
- 7.7×
Monthly cashflow live
- Estimated rent
- $1,032 medium interval (Pro) →
- Mortgage (P&I)
- −$498
- Tax from tax record
- −$146 /mo · $1,751/yr
- Insurance
- −$40
- HOA
- −$0
- Vacancy / Maint / Mgmt
- −$217
- Net cashflow
- $132
Break-even live
Sensitivity live
| Price | -10% $186 | -5% $159 | +0% $132 | +5% $105 | +10% $78 |
|---|---|---|---|---|---|
| Rent | -10% $50 | -5% $91 | +0% $132 | +5% $173 | +10% $213 |
| Rate | -1.0pp $180 | -0.5pp $156 | base $132 | +0.5pp $107 | +1.0pp $82 |
UW: 25.0% down · 7.5% · 30yr · 1.5% tax · 5.0% vac · 8.0% maint · 8.0% mgmt
Financing live
Cash to close
- Down payment
- $23,725
- Closing costs
- $2,847
- Reserves months
- —
- Total cash needed
- —
Loan-product check · same deal, 3 products live
Conventional
25% down · 7.5% · 30yr
- Down + closing
- —
- Monthly P&I
- —
- Monthly cashflow
- —
- DSCR
- —
- Eligible?
- —
Personal DTI + credit; lowest rate.
DSCR
20% down · 8.5% · 30yr
- Down + closing
- —
- Monthly P&I
- —
- Monthly cashflow
- —
- DSCR
- —
- Eligible?
- —
No personal income docs; deal must DSCR.
Hard money
10% down · 12.0% · 12mo
- Down + closing
- —
- Monthly P&I
- —
- Monthly cashflow
- —
- DSCR
- —
- Eligible?
- —
Short-term bridge; refi at stabilization.
Listing history 20 events
-
2026-06-21days on market $94,900 Active 43 DOM
-
2026-06-18days on market $94,900 Active 41 DOM
-
2026-06-17days on market $94,900 Active 40 DOM
-
2026-06-16days on market $94,900 Active 39 DOM
-
2026-06-16remarks 689-char remark
-
2026-06-16price $94,900 Active 38 DOM
-
2026-06-15days on market $99,900 Active 38 DOM
-
2026-06-13days on market $99,900 Active 36 DOM
-
2026-06-12days on market $99,900 Active 35 DOM
-
2026-06-09days on market $99,900 Active 32 DOM
-
2026-06-08days on market $99,900 Active 31 DOM
-
2026-06-07days on market $99,900 Active 30 DOM
-
2026-06-05days on market $99,900 Active 28 DOM
-
2026-06-04days on market $99,900 Active 26 DOM
-
2026-06-02days on market $99,900 Active 25 DOM
-
2026-06-01days on market $99,900 Active 24 DOM
-
2026-05-31days on market $99,900 Active 23 DOM
-
2026-05-31days on market $99,900 Active 22 DOM
-
2026-05-08$99,900 Active 242-char remark
-
1976-08-11soldstatus $29,500
ⓘ Source: listings_history table (triggers on properties + properties_extension) + one-shot
backfill from property_details.listing_events for pre-trigger history.
Tax reassessment forecast IL · Partial reset (capped growth)
- Current annual tax
- $1,751 · $146/mo
- Projected year-2 tax
- $1,953 · $163/mo
- Expected delta
- +$202/yr (+$17/mo · 11.5%)
ⓘ Screening estimate from a state-policy table — verify with the county assessor before closing.
Climate risk First Street
- Flood 1/10 Low FEMA zone X (unshaded) · 0% chance over 30 yrs
- Wildfire 1/10 Low
- Heat 3/10 Moderate 7 d/yr ≥105°F today · 20 d/yr by 30 yrs out
- Wind 2/10 Low 100% chance of damaging wind over 30 yrs
- Air quality 2/10 Low 1 unhealthy d/yr today · 2 by 30 yrs out
Nearby sold comps map
Loading sold comps map…
Walkable amenities ~0.75 mi
Loading nearby amenities…
Taxation est. · year 1
- Rental income
- $12,379
- − Mortgage interest
- −$5,316
- − Property taxes
- −$1,751
- − Insurance
- −$474
- − Repairs & maintenance
- −$990
- − Management
- −$990
- − Depreciation
- −$2,761
- Taxable income
- $96
- Est. tax owed @ 24.0%
- −$23
- After-tax cash flow
- $1,559/yr
For passive investors: Depreciation is non-cash, so a rental often shows a tax loss while cash-flowing — sheltering income. Rental losses are passive: they offset passive income freely, and up to $25,000/yr can offset ordinary (W-2) income if you actively participate and your MAGI is under $100k (phasing out to $0 by $150k); unused losses carry forward. On sale, claimed depreciation is recaptured at up to 25%, and gains may owe capital-gains tax (a 1031 exchange can defer both). Figures are a year-1 estimate at your 24.0% rate — not tax advice; consult a CPA.
Schools (NCES district)
- District
- A-C Central CUSD 262
- NCES district ID
- 1700105
- Math proficiency
- 15% ▬ 0.00%
- Reading proficiency
- 25% ▲ 5.00%
- Median HH income
- $53,111
- Composite
- 21.43/100
- National rank
- #13637
- State rank
- #691 of 919 in IL
Livability — Ashland
- Score
- 62/100
- State rank
- #875
- US rank
- #17006
Category grades
Schools grade is shown separately in the Schools card above.
Census & demographics
- Census place
- Ashland, IL
- Population (ZIP)
- 1,490
Population outlook (Cass County) Hauer SSP2
- Today (2025)
- 11,533 people
- By 2030
- 10,842 · -6.0%
- By 2040
- 9,523 · -17.4%
- By 2050
- 8,253 · -28.4%
- By 2075
- 5,555 · -51.8%
- By 2100
- 3,375 · -70.7%
Race, ethnicity, and origin ACS 2023
- Neighborhood character
- Predominantly White (98%)
- Race & ethnicity
- White 98% Two or more races 1%
- Common ancestry
- English 2% Lithuanian 1% Serbian 1%
Political lean MEDSL · Cass
- 2024 margin
- Solid R (+43.4) · D 27.4% · R 70.8% · Other 1.7%
- 2008→2024 swing
- -44.7pp toward R · 2008: 1.4pp · 2024: -43.4pp
- All cycles
- 2024: R+43.4 2020: R+37.7 2016: R+31.6 2012: R+13.5 2008: D+1.4
Not yet ingested
- Civics
- —
Market trends
- HPI YoY
- ▼ -29.05%
- Current HPI
- 160.7689
- Rent YoY
- —
- Metro
- —
- State GDP YoY
- ▲ 1.59%
- F500 in state
- 60
Industry mix (Fortune 500 HQ in IL)
| Industry | F500 HQs | Revenue |
|---|---|---|
| Insurance | 4 | $201B |
|
||
| Consumer Goods | 4 | $87B |
|
||
| Industrial Machinery | 3 | $64B |
|
||
| Healthcare | 2 | $55B |
|
||
| Retail / Pharmacy | 1 | $148B |
|
||
| Agriculture / Food | 1 | $86B |
|
||
Price history
+221.7% since first listed3 events — show timeline
- 2026-06-15 Price Changed $94,900 CIBR
- 2026-05-08 Listed $99,900 CIBR
- 1976-08-11 Sold (Public Records) $29,500 Public Records
Property tax history
-0.7%/yrLatest (2024): $1,751 · -2.7% YoY. Source: county tax records.
Cash-flow waterfall
monthlySold comps — $/sqft
last 12 mo · ≤1 miLoading sold comps…