13516 Old Glory Rd · Lore City, OH
Flood risk 4/10 · Minor
- FEMA flood zone
- X (unshaded)
- Chance of flooding over 30 yrs
- 0.33%
- Est. flood insurance / yr
- $473 – $860
Fire risk 3/10 · Minor
- Est. fire insurance / yr
- $713 – $1,323
Heat risk 3/10 · Minor
- Hot days now (above 98°F)
- 7 days/yr
- Hot days in 30 yrs
- 18 days/yr
Wind risk 1/10 · Minimal
- Chance of severe wind over 30 yrs
- 0.0%
Air-quality risk 2/10 · Minimal
- Unhealthy air days now
- 1 days/yr
- Unhealthy air days in 30 yrs
- 1 days/yr
Risk factors via First Street. Map © Google.
Why this score? — see what drove the B- grade
The composite is a weighted blend of 9 inputs, each scored 0–100. Each bar is that input's sub-score; the figure is the points it added to the 100-point composite (weight × sub-score).
- Cash flow +27.3/30.0
- DSCR +9.5/10.0
- ARV discount +7.5/15.0
- Appreciation +6.8/10.0
- 1% rule +6.1/10.0
- Schools +4.1/10.0
- Livability +3.1/5.0
- Rent growth +2.5/5.0
- Condition / age +2.5/5.0
$76,500
🖨 Deal sheet (PDF) 📄 Offer letter ✓ Due diligence
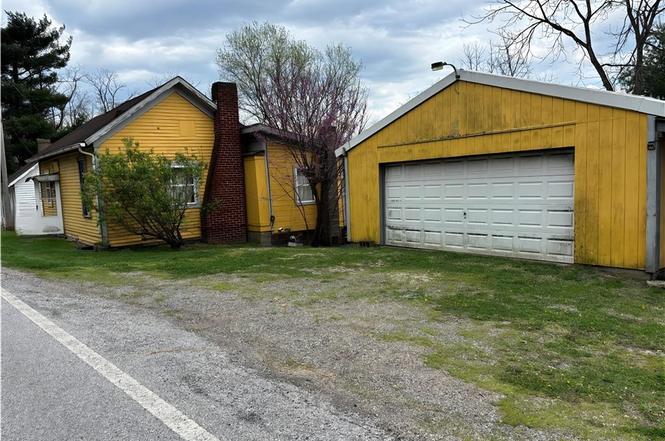
Listing remarks
Older one story home that has the utilities shut off for now. Guernsey Muskingum Electric and Guernsey County Water. Home has two buildings, a 1994 24' x 40' garage with cement floors, electric opener, shelving and a small side porch. Also a 2006, 24'x 24' wood shop building with an attached carport - RV parking area. Road frontage on both SR 265 and Old Glory Road. There is 5.42 acres partially wooded and cleared flat land. Assessment of $2 for MWCD. Mineral rights Do Not Transfer. New Survey to be completed on the . 25 acre parcel before closing by the seller. NEW survey has been completed making it now 0.21.
Key facts
- Attached carport
- Electric opener
- Road frontage
Tags
Property features AI
Exterior
- Parking: Detached 2-car garage; 1-space carport (RV-capable carport)
- Utilities: Public water; Septic sewer
- Home design: Single-story home; Has a view; Fixer condition
- Construction: Wood siding; Shingle roof; Block foundation; Built according to public records
- Exterior features: Rear porch; Deck; Back yard; Many trees / wooded lot; RV/boat storage; Workshop
Interior
- Kitchen: Eat-in kitchen
- Bedrooms: One main-level bedroom
- Flooring: Carpet in living areas and one additional room; Wood flooring in the eat-in kitchen
- Bathrooms: One full bathroom (main level)
- Heating & cooling: Propane heating
- Interior features: Eat-in kitchen; Window coverings
- Laundry & utility: Washer and dryer located in the kitchen (hookups/appliances present)
Neighborhood map
What this means for you Summary
Snapshot
- This is a 1-bed/1.0-bath single-family listed at $76k.
Deal economics
- At list price, monthly cash flow is $222 ($3k/yr) — positive.
- The deal already cash-flows at list — no discount required.
- Meets the 1% rule at list price ($849 rent vs $76k).
- Recommended offer: $67k (12.0% below list) — sets the bar for market timing.
Location & tenants
- Location reads 61/100 on livability (#927 in OH) — a middle-class / working-renter tenant base. Strengths: cost of living A+, housing A+; Watch: crime D, amenities F, commute F.
- Rolling Hills Local (rural): math 44% / reading 54% proficiency, ranked #463 of 656 in OH (top 71%) — families likely to look elsewhere, expect single-tenant / working-renter base with shorter leases.
- Market conditions: 23 active listings in the ZIP; 37 units permitted in Guernsey County in 2024 (0 in 5+ unit buildings).
- This rent is only 17% of the median local income ($61k/yr) — well below the 30% rent-burden line; pricing power to push rent on renewal without tenant pushback.
Forward outlook
- In year one you build about $3k of equity ($529 loan paydown + $3k appreciation (3.6% local appreciation)).
- Guernsey County population projected at -20% by 2050 — secular population decline; favor cash flow + early exit over multi-decade hold.
- At projected returns (3.6% appreciation + 3.0% rent growth), your $21k cash investment doubles in ~4 years — after that, you're playing with house money.
- By year 10, paydown + projected appreciation supports a ~$32k cash-out refi (75% LTV) — recoverable capital for the next deal without selling this one.
Negotiation context
- It's been on market 432 days — a 12% lower offer ($67k) is reasonable based on typical stale-listing flexibility.
Questions for the listing agent
- It's been on market 432 days. Have you received any prior offers? Is the seller open to a 12% concession, seller financing, or rate buy-down credit?
- Why hasn't it sold? Are there any deal-killer items the seller is aware of (foundation, flood, title, zoning, code violations)?
- Is there a deadline driving the sale (1031 exchange, divorce, estate, relocation)? That informs how much negotiation room exists.
- Crime grade is D in this area — have there been break-ins, vandalism, or insurance claims at this property in the last 3 years? What carrier currently insures it and at what premium?
- What's the average days-on-market for RENTAL listings here right now (not sales)? A rising rental-DOM trend means longer vacancies and softer asking-rent achievability than the comps imply.
- What's the recent tenant-quality profile in this submarket — average credit score on applications, eviction rate, late-payment / NSF rate, and stable-employment percentage? A property-management company in the area should have these aggregated.
- How much new for-sale + rental construction is in the pipeline within 1–3 miles? Heavy new supply typically softens prices + rents 12–24 months out; constrained supply supports both.
Investment metrics
- 1% rule
- 1.11% ✓
- Cap rate
- 9.77%
- Cash-on-cash
- 12.41%
- DSCR
- 1.55
- GRM
- 7.5
CMA / ARV
No comps found within radius.
Projected returns pro-forma
3.59% appreciation · 3.0% rent growth · sell at horizon
- IRR
- 20.4%
- Equity multiple
- 2.20×
- Total profit
- $25,697
- Equity at exit
- $36,959
- IRR
- 21.1%
- Equity multiple
- 4.21×
- Total profit
- $68,759
- Equity at exit
- $59,036
Cash invested: $21,420 (down + closing). Projections, not guarantees.
Landlord ↔ Tenant lean methodology
- Overall (STATE)
- 73 Landlord-Friendly
- State Ohio
- 73 Landlord-Friendly · R+6
- County
- — inherits STATE
- City
- — inherits STATE
ZIP-level market 43755
- Home prices YoY
- 2.4%
- Active inventory
- 23
- Price-to-rent
- 7.5×
Monthly cashflow live
- Estimated rent
- $849 medium interval (Pro) →
- Mortgage (P&I)
- −$401
- Tax from tax record
- −$17 /mo · $198/yr
- Insurance
- −$32
- HOA
- −$0
- Vacancy / Maint / Mgmt
- −$178
- Net cashflow
- $222
Break-even live
Sensitivity live
| Price | -10% $265 | -5% $243 | +0% $222 | +5% $200 | +10% $178 |
|---|---|---|---|---|---|
| Rent | -10% $154 | -5% $188 | +0% $222 | +5% $255 | +10% $289 |
| Rate | -1.0pp $260 | -0.5pp $241 | base $222 | +0.5pp $202 | +1.0pp $182 |
UW: 25.0% down · 7.5% · 30yr · 1.5% tax · 5.0% vac · 8.0% maint · 8.0% mgmt
Financing live
Cash to close
- Down payment
- $19,125
- Closing costs
- $2,295
- Reserves months
- —
- Total cash needed
- —
Loan-product check · same deal, 3 products live
Conventional
25% down · 7.5% · 30yr
- Down + closing
- —
- Monthly P&I
- —
- Monthly cashflow
- —
- DSCR
- —
- Eligible?
- —
Personal DTI + credit; lowest rate.
DSCR
20% down · 8.5% · 30yr
- Down + closing
- —
- Monthly P&I
- —
- Monthly cashflow
- —
- DSCR
- —
- Eligible?
- —
No personal income docs; deal must DSCR.
Hard money
10% down · 12.0% · 12mo
- Down + closing
- —
- Monthly P&I
- —
- Monthly cashflow
- —
- DSCR
- —
- Eligible?
- —
Short-term bridge; refi at stabilization.
Listing history 19 events
-
2026-06-21days on market $76,500 Active 432 DOM
-
2026-06-18days on market $76,500 Active 430 DOM
-
2026-06-17days on market $76,500 Active 429 DOM
-
2026-06-16days on market $76,500 Active 428 DOM
-
2026-06-15days on market $76,500 Active 427 DOM
-
2026-06-13days on market $76,500 Active 425 DOM
-
2026-06-12pricestatusdays on market $76,500 Active 424 DOM
-
2026-06-09days on market $79,900 Contingent 421 DOM
-
2026-06-08days on market $79,900 Contingent 420 DOM
-
2026-06-08days on market $79,900 Contingent 419 DOM
-
2026-06-07days on market $79,900 Contingent 418 DOM
-
2026-06-04days on market $79,900 Contingent 415 DOM
-
2026-06-02days on market $79,900 Contingent 414 DOM
-
2026-06-01days on market $79,900 Contingent 413 DOM
-
2026-05-31days on market $79,900 Contingent 412 DOM
-
2026-04-13historical Contingent
-
2026-03-31price $79,900
-
2025-10-10price $89,900
-
2025-04-12$99,900 Active
ⓘ Source: listings_history table (triggers on properties + properties_extension) + one-shot
backfill from property_details.listing_events for pre-trigger history.
Tax reassessment forecast OH · Partial reset (capped growth)
- Current annual tax
- $198 · $17/mo
- Projected year-2 tax
- $696 · $58/mo
- Expected delta
- +$498/yr (+$41/mo · 251.0%)
ⓘ Screening estimate from a state-policy table — verify with the county assessor before closing.
Climate risk First Street
- Flood 4/10 Moderate FEMA zone X (unshaded) · 33% chance over 30 yrs
- Wildfire 3/10 Moderate
- Heat 3/10 Moderate 7 d/yr ≥98°F today · 18 d/yr by 30 yrs out
- Wind 1/10 Low 0% chance of damaging wind over 30 yrs
- Air quality 2/10 Low 1 unhealthy d/yr today · 1 by 30 yrs out
Nearby sold comps map
Loading sold comps map…
Walkable amenities ~0.75 mi
Loading nearby amenities…
Taxation est. · year 1
- Rental income
- $10,194
- − Mortgage interest
- −$4,285
- − Property taxes
- −$198
- − Insurance
- −$382
- − Repairs & maintenance
- −$816
- − Management
- −$816
- − Depreciation
- −$2,225
- Taxable income
- $1,471
- Est. tax owed @ 24.0%
- −$353
- After-tax cash flow
- $2,305/yr
For passive investors: Depreciation is non-cash, so a rental often shows a tax loss while cash-flowing — sheltering income. Rental losses are passive: they offset passive income freely, and up to $25,000/yr can offset ordinary (W-2) income if you actively participate and your MAGI is under $100k (phasing out to $0 by $150k); unused losses carry forward. On sale, claimed depreciation is recaptured at up to 25%, and gains may owe capital-gains tax (a 1031 exchange can defer both). Figures are a year-1 estimate at your 24.0% rate — not tax advice; consult a CPA.
Schools (NCES district)
- District
- Rolling Hills Local
- NCES district ID
- 3904730
- Math proficiency
- 44% ▼ -16.00%
- Reading proficiency
- 54% ▼ -4.00%
- Median HH income
- $39,979
- Composite
- 40.96/100
- National rank
- #3602
- State rank
- #463 of 656 in OH
Livability — Lore City
- Score
- 61/100
- State rank
- #927
- US rank
- #17730
Category grades
Schools grade is shown separately in the Schools card above.
Census & demographics
- County
- Guernsey · 34,843 people
- Population (ZIP)
- 1,561
- Household income
- $61,492
- Rent vs Own
Population outlook (Guernsey County) Hauer SSP2
- Today (2025)
- 37,281 people
- By 2030
- 35,900 · -3.7%
- By 2040
- 32,861 · -11.9%
- By 2050
- 29,700 · -20.3%
- By 2075
- 22,199 · -40.5%
- By 2100
- 15,192 · -59.3%
Race, ethnicity, and origin ACS 2023
- Neighborhood character
- Predominantly White (96%)
- Race & ethnicity
- White 96% Two or more races 2% Hispanic / Latino 1%
- Common ancestry
- Slovak 5% Lithuanian 4% Romanian 4%
- Languages at home
- 99% English-only · Spanish 1%
Political lean MEDSL · Guernsey
- 2024 margin
- Solid R (+52.1) · D 23.6% · R 75.7%
- 2008→2024 swing
- -43.0pp toward R · 2008: -9.1pp · 2024: -52.1pp
- All cycles
- 2024: R+52.1 2020: R+48.4 2016: R+42.6 2012: R+9.7 2008: R+9.1
Not yet ingested
- Civics
- —
Market trends
- HPI YoY
- ▲ 3.59%
- Current HPI
- 151.2599
- Rent YoY
- —
- Metro
- —
- State GDP YoY
- ▲ 1.98%
- F500 in state
- 48
Industry mix (Fortune 500 HQ in OH)
| Industry | F500 HQs | Revenue |
|---|---|---|
| Insurance | 3 | $145B |
|
||
| Industrial Machinery | 3 | $49B |
|
||
| Financial Services | 3 | $24B |
|
||
| Consumer Goods | 2 | $93B |
|
||
| Aerospace / Defense | 2 | $47B |
|
||
| Utilities | 2 | $33B |
|
||
Price history
-20.0% since first listed4 events — show timeline
- 2026-04-13 Contingent — MLSNOW
- 2026-03-31 Price Changed $79,900 MLSNOW
- 2025-10-10 Price Changed $89,900 MLSNOW
- 2025-04-12 Listed $99,900 MLSNOW
Property tax history
+4.4%/yrLatest (2025): $198 · +2.4% YoY. Source: county tax records.
Cash-flow waterfall
monthlySold comps — $/sqft
last 12 mo · ≤1 miLoading sold comps…