 Duplex
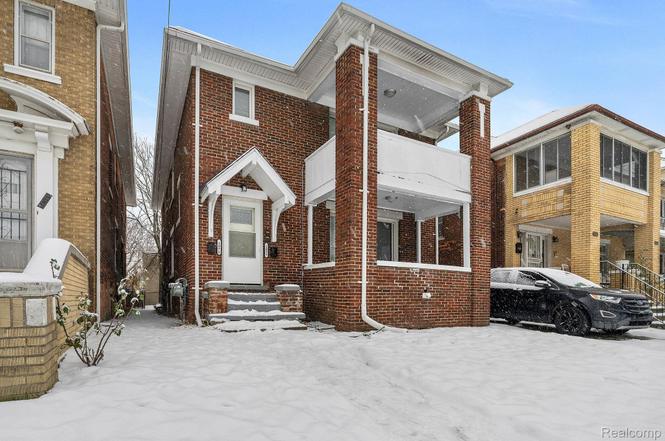
1975 Taylor St · Detroit, MI
Flood risk 1/10 · Minimal
- FEMA flood zone
- X (unshaded)
- Chance of flooding over 30 yrs
- 0.0%
- Est. flood insurance / yr
- $473 – $860
Fire risk 1/10 · Minimal
- Est. fire insurance / yr
- $784 – $1,456
Heat risk 3/10 · Minor
- Hot days now (above 97°F)
- 7 days/yr
- Hot days in 30 yrs
- 15 days/yr
Wind risk 2/10 · Minimal
- Chance of severe wind over 30 yrs
- —
Air-quality risk 4/10 · Minor
- Unhealthy air days now
- 4 days/yr
- Unhealthy air days in 30 yrs
- 6 days/yr
Risk factors via First Street. Map © Google.
Why this score? — see what drove the C+ grade
The composite is a weighted blend of 9 inputs, each scored 0–100. Each bar is that input's sub-score; the figure is the points it added to the 100-point composite (weight × sub-score).
- Cash flow +26.4/30.0
- DSCR +9.0/10.0
- ARV discount +7.5/15.0
- 1% rule +7.0/10.0
- Rent growth +3.8/5.0
- Livability +3.7/5.0
- Condition / age +2.5/5.0
- Schools +1.3/10.0
- Appreciation +0.0/10.0
$240,000
🖨 Deal sheet 📄 Offer letter ✓ Due diligence
Multi-family units
County records classify this as Multi-Family (2-4 Unit). Listing-text estimate: 2 units. confirmed
Listing remarks MLS
Fully renovated brick duplex located in one of Detroit's most desirable and rapidly appreciating neighborhoods. Just minutes from Boston-Edison, Virginia Park, New Center, Henry Ford Hospital, and Downtown Detroit, this turn-key multifamily presents an outstanding opportunity for both investors and owner-occupants. Each unit offers 3 spacious bedrooms, 1 full bathroom, generous living and dining areas, decorative fireplaces, and covered outdoor porch space. Both units are currently vacant and were most recently rented for $1,400 per month per unit, providing immediate income potential and flexibility for the next owner. Recent improvements include brand-new kitchens, updated bathrooms, new furnaces, new hot water tanks, fresh flooring, paint, and extensive renovations throughout. The property also features a full basement with ample storage space, separate mechanical systems, and a detached garage for additional storage or parking. Conveniently located near major employers, restaurants, shopping, cultural attractions, and freeway access. Whether you're looking to house hack, add a strong cash-flowing asset to your portfolio, or capitalize on Detroit's continued growth, this move-in-ready duplex is an opportunity you won't want to miss.
Key facts
- Ample storage space
- Full basement
- Updated bathrooms
Tags
Property features AI
Finance
- Other: Pets allowed — contact for details
- Financial info:
- HOA & community:
Exterior
- Parking:
- Security:
- Utilities: Public water; Public sewer
- Home design: Multi-family residential building; Two stories; Two units of similar size
- Construction: Block and brick construction
- Exterior features: Paved road access; Lot approximately 0.1 acre (35 x 127); Zoned for multifamily/residential
Interior
- Kitchen:
- Bedrooms: Two separate 3-bedroom units
- Flooring:
- Bathrooms: Two full bathrooms and two half bathrooms (total across property)
- Heating & cooling: Forced air heating with natural gas; No central cooling
- Interior features: Full basement
- Laundry & utility:
Neighborhood map
What this means for you Summary
Snapshot
- This is a 2 × 3-bed/1.5-bath units multifamily listed at $240k.
Deal economics
- At list price, monthly cash flow is $624 ($7k/yr) — positive. Per door: $312/mo.
- The deal already cash-flows at list — no discount required.
- Meets the 1% rule at list price ($3k rent vs $240k).
Location & tenants
- Location reads 73/100 on livability (#218 in MI) — a middle-class / working-renter tenant base. Strengths: amenities A+, commute A+, cost of living A+; Watch: schools F, crime F, employment F.
- Detroit Public Schools Community District (urban): math 10% / reading 24% proficiency, ranked #499 of 540 in MI (top 92%) — low school quality limits family demand, transient renter base, plan for 1-2y turnover; 90% free/reduced lunch — lower-income household profile, screen leases tightly.
- Market conditions: Rents rising fast (+5.2%/yr); 271 active listings in the ZIP; 7 comparable units currently listed for rent nearby; rentals at typical pace (median 15d on market — plan ~3-4 weeks tenant-placement turnaround); 2,639 units permitted in Wayne County in 2024 (1,216 in 5+ unit buildings).
- At $2,887/mo this rent would consume 77% of the median local household income ($45k/yr) (locally 646% of renters already pay >50% of income on rent) — very limited rent-growth headroom before tenants either downsize or default.
Forward outlook
- Local home prices are declining (-3.0%/yr); year-one equity from $2k of loan paydown is wiped out by about $7k of value loss. Plan a longer hold.
- Wayne County population projected at -17% by 2050 — secular population decline; favor cash flow + early exit over multi-decade hold.
- At projected returns (-3.0% appreciation + 5.2% rent growth), your $67k cash investment doubles in ~9 years — after that, you're playing with house money.
Negotiation context
- Only 8 days on market — expect competitive offers; lowballing is unlikely to land.
- 14 sale attempts since 14y ago with the ask held roughly flat each time — persistent listings suggest the price (not the market) is what's stuck; bring a comps-based counter.
- Current owner paid $56k; list at $240k implies a 329% gain — meaningful room to come down on a strong offer.
Risks & watch-outs
- Watch-outs: built in 1917 — expect roof / HVAC / electrical / plumbing capex.
Questions for the listing agent
- Can we see the unit-by-unit rent roll, current vacancy, and any below-market leases? What's the average tenancy length?
- What capital expenditures (roof, boiler, parking lot, exteriors) have been made in the last 5 years, and what's planned in the next 2?
- Built in 1917 — when were the roof, HVAC, electrical panel, plumbing, and water heater last replaced?
- Is there a deadline driving the sale (1031 exchange, divorce, estate, relocation)? That informs how much negotiation room exists.
- Schools are F-rated, which usually means shorter tenancies and higher turnover. Who's the typical renter profile here, and what's been the actual vacancy rate?
- Crime grade is F in this area — have there been break-ins, vandalism, or insurance claims at this property in the last 3 years? What carrier currently insures it and at what premium?
- What's the average days-on-market for RENTAL listings here right now (not sales)? A rising rental-DOM trend means longer vacancies and softer asking-rent achievability than the comps imply.
- What's the recent tenant-quality profile in this submarket — average credit score on applications, eviction rate, late-payment / NSF rate, and stable-employment percentage? A property-management company in the area should have these aggregated.
- How much new apartment / multifamily construction is in the pipeline within 1–3 miles? Heavy new supply (>2% of stock underway) typically softens rents 12–24 months out; light construction supports rent growth.
Investment metrics
- 1% rule
- 1.20% ✓
- Cap rate
- 9.41%
- Cash-on-cash
- 11.14%
- DSCR
- 1.50
- GRM
- 6.9
CMA / ARV
- ARV (on-the-fly)
- $116,560
- Comps found
- 12
Show comp detail 12 sales within ~0.75 mi
| Address | Dist | Beds/Ba | Sqft | Sold | Price | $/sf | Match |
|---|---|---|---|---|---|---|---|
| 1933 Taylor St | 0.04mi | 6/2.0 | 2,318 (-6%) | 4mo | $230,000 | $99 | 84 |
| 1729 Lee Pl | 0.26mi | 6/2.0 | 2,340 (-6%) | 1mo | $25,000 | $11 | 78 |
| 1639 Gladstone St | 0.24mi | 6/2.5 | 2,522 (+2%) | 8mo | $63,000 | $25 | 77 |
| 2255 Clairmount St | 0.18mi | 6/2.5 | 2,300 (-7%) | 1mo | $105,000 | $46 | 76 |
| 2250 Taylor St | 0.17mi | 6/2.0 | 2,682 (+8%) | 3mo | $100,000 | $37 | 75 |
| 2254 Taylor St | 0.18mi | 6/2.0 | 2,614 (+5%) | 9mo | $105,000 | $40 | 75 |
| 2286 Taylor St | 0.21mi | 6/2.5 | 2,674 (+8%) | 4mo | $125,000 | $47 | 71 |
| 2240 Taylor St | 0.17mi | 6/2.0 | 2,836 (+14%) | 3mo | $135,000 | $48 | 65 |
| 7501 Dunedin St | 0.74mi | 6/2.0 | 2,490 (+0%) | 10mo | $337,225 | $135 | 56 |
| 1997 Virginia Park St | 0.45mi | 6/2.5 | 2,674 (+8%) | 10mo | $290,000 | $108 | 56 |
| 2513 W Euclid St | 0.54mi | 6/2.0 | 2,788 (+12%) | 7mo | $200,000 | $72 | 48 |
| 1547 Lawrence St | 0.74mi | 6/2.5 | 2,802 (+13%) | 9mo | $15,000 | $5 | 34 |
Match score weights: distance 35% · size 25% · config 20% · recency 20%. Top-matched comps best support the ARV.
Projected returns pro-forma
-3.0% appreciation · 5.2% rent growth · sell at horizon
- IRR
- 2.8%
- Equity multiple
- 1.11×
- Total profit
- $7,418
- Equity at exit
- $35,785
- IRR
- 14.4%
- Equity multiple
- 2.28×
- Total profit
- $85,832
- Equity at exit
- $20,751
Cash invested: $67,200 (down + closing). Projections, not guarantees.
Landlord ↔ Tenant lean methodology
- Overall (STATE)
- 62 Landlord-Friendly
- State Michigan
- 62 Landlord-Friendly · EVEN
- County
- — inherits STATE
- City
- — inherits STATE
ZIP-level market 48206
- Rents YoY
- 5.2%
- Active inventory
- 271
- Price-to-rent
- 13.9×
Monthly cashflow live
- Estimated rent
- $2,887 high interval (Pro) →
- Mortgage (P&I)
- −$1,259
- Tax from tax record
- −$298 /mo · $3,579/yr
- Insurance
- −$100
- HOA
- −$0
- Vacancy / Maint / Mgmt
- −$606
- Net cashflow
- $624
Break-even live
2-unit breakdown (identical units grouped — click to expand)
| Units | Beds | Baths | Est. rent |
|---|---|---|---|
| 2× units | 3 | 1.5 | $2,886 |
| #1 | 3 | 1.5 | $1,443 |
| #2 | 3 | 1.5 | $1,443 |
| Total (2 units) | $2,887 | ||
UW: 25.0% down · 7.5% · 30yr · 1.5% tax · 5.0% vac · 8.0% maint · 8.0% mgmt
Financing live
Cash to close
- Down payment
- $60,000
- Closing costs
- $7,200
- Reserves months
- —
- Total cash needed
- —
Loan-product check · same deal, 3 products live
Conventional
25% down · 7.5% · 30yr
- Down + closing
- —
- Monthly P&I
- —
- Monthly cashflow
- —
- DSCR
- —
- Eligible?
- —
Personal DTI + credit; lowest rate.
DSCR
20% down · 8.5% · 30yr
- Down + closing
- —
- Monthly P&I
- —
- Monthly cashflow
- —
- DSCR
- —
- Eligible?
- —
No personal income docs; deal must DSCR.
Hard money
10% down · 12.0% · 12mo
- Down + closing
- —
- Monthly P&I
- —
- Monthly cashflow
- —
- DSCR
- —
- Eligible?
- —
Short-term bridge; refi at stabilization.
Rent comps 7 comps
| Address | Beds | Baths | Sqft | Rent | $/sqft | DOM | Units | Dist |
|---|---|---|---|---|---|---|---|---|
| 2028 Gladstone St Unit 1 Detroit, MI | 5.0 | 2.0 | 2500 | $2,850 | $1.14 | 3d | 1 | 0.12mi |
| 8951 La Salle Blvd Detroit, MI | 5.0 | 2.5 | 2440 | $2,500 | $1.02 | 14d | 1 | 0.30mi |
| 2509 Gladstone St Unit NA Detroit, MI | 6.0 | 3.0 | 3008 | $2,000 | $0.66 | 10d | 1 | 0.42mi |
| 1699 Glynn Ct Detroit, MI | 5.0 | 3.5 | 2542 | $2,500 | $0.98 | 22d | 1 | 0.52mi |
| 3799 W Philadelphia St Detroit, MI | 5.0 | 2.0 | 2200 | $1,650 | $0.75 | 16d | 1 | 1.11mi |
| 41 Richton St Highland Park, MI | 5.0 | 2.0 | 1871 | $1,800 | $0.96 | 14d | 1 | 1.46mi |
| 41 Richton St Highland Park, MI | 5.0 | 2.0 | 1871 | $1,800 | $0.96 | 2d | 1 | 1.46mi |
Listing history 7 events
-
2026-06-18days on market $240,000 Active 8 DOM
-
2026-06-17days on market $240,000 Active 7 DOM
-
2026-06-16days on market $240,000 Active 6 DOM
-
2026-06-15days on market $240,000 Active 5 DOM
-
2026-06-13days on market $240,000 Active 3 DOM
-
2026-06-13remarks 699-char remark
-
2026-06-13$240,000 Active 2 DOM
ⓘ Source: listings_history table (triggers on properties + properties_extension) + one-shot
backfill from property_details.listing_events for pre-trigger history.
Tax reassessment forecast MI · Partial reset (capped growth)
- Current annual tax
- $3,579 · $298/mo
- Projected year-2 tax
- $3,638 · $303/mo
- Expected delta
- +$58/yr (+$5/mo · 1.6%)
ⓘ Screening estimate from a state-policy table — verify with the county assessor before closing.
Climate risk First Street
- Flood 1/10 Low FEMA zone X (unshaded) · 0% chance over 30 yrs
- Wildfire 1/10 Low
- Heat 3/10 Moderate 7 d/yr ≥97°F today · 15 d/yr by 30 yrs out
- Wind 2/10 Low
- Air quality 4/10 Moderate 4 unhealthy d/yr today · 6 by 30 yrs out
Nearby sold comps map
Loading sold comps map…
Walkable amenities ~0.75 mi
Loading nearby amenities…
Taxation est. · year 1
- Rental income
- $34,644
- − Mortgage interest
- −$13,444
- − Property taxes
- −$3,579
- − Insurance
- −$1,200
- − Repairs & maintenance
- −$2,772
- − Management
- −$2,772
- − Depreciation
- −$6,982
- Taxable income
- $3,896
- Est. tax owed @ 24.0%
- −$935
- After-tax cash flow
- $6,552/yr
For passive investors: Depreciation is non-cash, so a rental often shows a tax loss while cash-flowing — sheltering income. Rental losses are passive: they offset passive income freely, and up to $25,000/yr can offset ordinary (W-2) income if you actively participate and your MAGI is under $100k (phasing out to $0 by $150k); unused losses carry forward. On sale, claimed depreciation is recaptured at up to 25%, and gains may owe capital-gains tax (a 1031 exchange can defer both). Figures are a year-1 estimate at your 24.0% rate — not tax advice; consult a CPA.
Schools (NCES district)
- District
- Detroit Public Schools Community District
- NCES district ID
- 2601103
- Math proficiency
- 10% ▼ -2.00%
- Reading proficiency
- 24% ▲ 6.00%
- Median HH income
- $25,815
- Composite
- 13.06/100
- National rank
- #9564
- State rank
- #499 of 540 in MI
Livability — Detroit
- Score
- 73/100
- State rank
- #218
- US rank
- #5427
Category grades
Schools grade is shown separately in the Schools card above.
Census & demographics
- Census place
- Detroit, MI
- County
- Wayne County · 1,562,939 people
- City population
- 572,865
- Metro
- Detroit-Warren-Dearborn, MI
- Population (ZIP)
- 15,227
- Household income
- $45,046
- Rent vs Own
- Severe rent burden
- 646.0
Population outlook (Wayne County) Hauer SSP2
- Today (2025)
- 1,675,273 people
- By 2030
- 1,620,300 · -3.3%
- By 2040
- 1,502,341 · -10.3%
- By 2050
- 1,384,039 · -17.4%
- By 2075
- 1,124,592 · -32.9%
- By 2100
- 881,193 · -47.4%
Race, ethnicity, and origin ACS 2023
- Neighborhood character
- Predominantly Black (81%)
- Race & ethnicity
- Black 81% White 12% Two or more races 5% Hispanic / Latino 3%
- Common ancestry
- Iranian 3% Romanian 1% Slovak 1%
- Foreign-born
- 4% · Canada
- Languages at home
- 94% English-only · Spanish 4% Other Indo-European 1%
Political lean MEDSL · Wayne
- 2024 margin
- Strong D (+29.0) · D 62.7% · R 33.7% · Other 3.6%
- 2008→2024 swing
- -20.5pp toward R · 2008: 49.5pp · 2024: 29.0pp
- All cycles
- 2024: D+29.0 2020: D+38.1 2016: D+37.3 2012: D+46.9 2008: D+49.5
Not yet ingested
- Civics
- —
Market trends
- HPI YoY
- ▼ -139.60%
- Current HPI
- 130.9545
- Rent YoY
- ▲ 5.20%
- Metro
- Detroit-Warren-Dearborn, MI
- State GDP YoY
- ▲ 1.37%
- F500 in state
- 28
Industry mix (Fortune 500 HQ in MI)
| Industry | F500 HQs | Revenue |
|---|---|---|
| Automotive Parts | 3 | $48B |
|
||
| Automotive | 2 | $372B |
|
||
| Chemicals | 1 | $45B |
|
||
| Automotive Retail | 1 | $29B |
|
||
| Healthcare / Medical Devices | 1 | $23B |
|
||
| Automotive Technology | 1 | $20B |
|
||
Price history
+166.7% since first listed38 events — show timeline
- 2026-06-10 Listed $240,000 REALCOMP
- 2026-06-10 Listed $240,000 MiRealSource-MiMLS
- 2026-05-01 Listing Removed — MiRealSource-MiMLS
- 2026-04-30 Listing Removed — REALCOMP
- 2026-03-23 Price Changed $249,999 MiRealSource-MiMLS
- 2026-03-23 Price Changed $249,999 REALCOMP
- 2026-02-24 Listed $275,000 REALCOMP
- 2026-02-24 Listed $275,000 MiRealSource-MiMLS
- 2026-02-24 Listing Removed — MiRealSource-MiMLS
- 2026-02-23 Listing Removed — REALCOMP
- 2026-02-20 Price Changed $275,000 MiRealSource-MiMLS
- 2026-02-19 Price Changed $275,000 REALCOMP
- 2026-02-15 Listed $220,000 REALCOMP
- 2026-02-15 Listed $220,000 MiRealSource-MiMLS
- 2026-02-13 Price Changed $230,000 MiRealSource-MiMLS
- 2026-02-13 Price Changed $230,000 REALCOMP
- 2026-02-13 Listing Removed — MiRealSource-MiMLS
- 2026-02-12 Listing Removed — REALCOMP
- 2026-01-06 Listing Removed — MiRealSource-MiMLS
- 2026-01-06 Listed $260,000 REALCOMP
- 2026-01-06 Listed $260,000 MiRealSource-MiMLS
- 2026-01-05 Listing Removed — REALCOMP
- 2025-12-08 Listed $290,000 REALCOMP
- 2025-12-08 Listed $290,000 MiRealSource-MiMLS
- 2020-08-03 Sold (Public Records) $56,000 Public Records
- 2020-06-30 Sold (MLS) $56,000 MiRealSource-MiMLS
- 2020-06-30 Sold (MLS) $56,000 REALCOMP
- 2020-06-23 Pending — MiRealSource-MiMLS
- 2020-06-23 Pending — REALCOMP
- 2020-06-11 Price Changed $59,000 MiRealSource-MiMLS
- 2020-06-10 Price Changed $59,000 REALCOMP
- 2020-05-22 Listed $65,000 MiRealSource-MiMLS
- 2020-05-22 Listed $65,000 REALCOMP
- 2013-10-24 Listing Removed — MiRealSource-MiMLS
- 2013-10-18 Listed $29,900 MiRealSource-MiMLS
- 2013-01-06 Listing Removed — MiRealSource-MiMLS
- 2012-09-17 Listed $39,900 MiRealSource-MiMLS
- 2007-05-22 Sold (Public Records) $90,000 Public Records
Property tax history
+5.9%/yrLatest (2025): $3,579 · -22.1% YoY. Source: county tax records.
Cash-flow waterfall
monthlySold comps — $/sqft
last 12 mo · ≤1 miLoading sold comps…