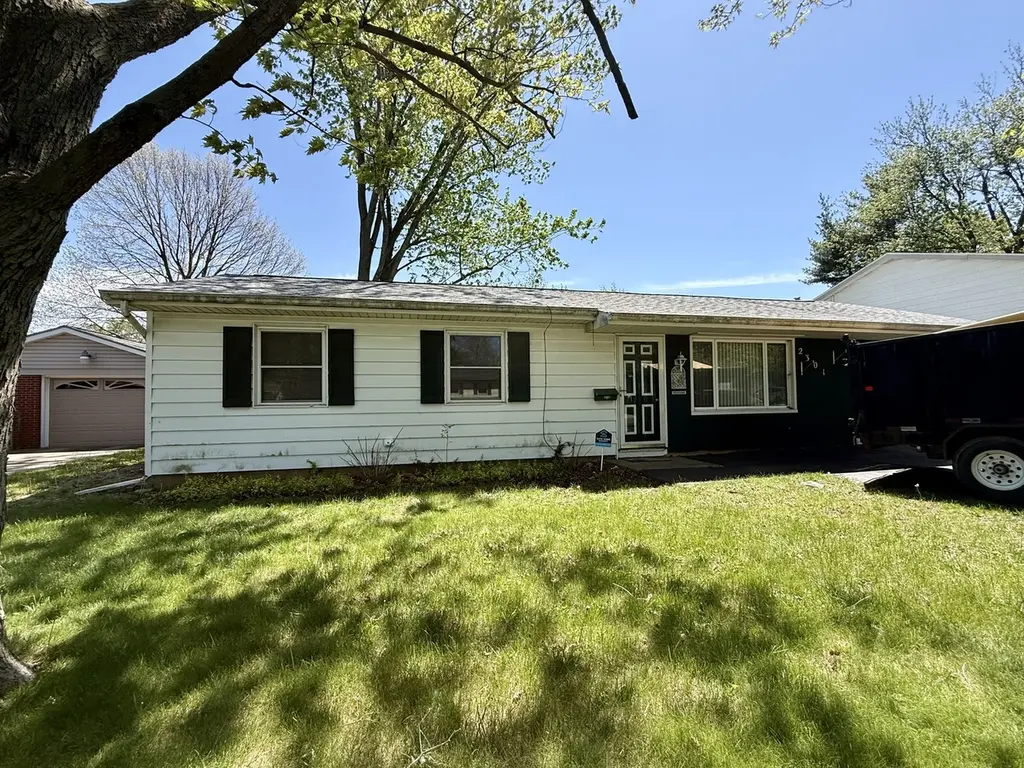
2301 E Rainbow Vw · Urbana, IL
Flood risk 1/10 · Minimal
- FEMA flood zone
- X (unshaded)
- Chance of flooding over 30 yrs
- 0.0%
- Est. flood insurance / yr
- $507 – $1,088
Fire risk 1/10 · Minimal
- Est. fire insurance / yr
- $804 – $1,492
Heat risk 3/10 · Minor
- Hot days now (above 104°F)
- 7 days/yr
- Hot days in 30 yrs
- 19 days/yr
Wind risk 2/10 · Minimal
- Chance of severe wind over 30 yrs
- 1.0%
Air-quality risk 2/10 · Minimal
- Unhealthy air days now
- 1 days/yr
- Unhealthy air days in 30 yrs
- 2 days/yr
Risk factors via First Street. Map © Google.
Why this score? — see what drove the B grade
The composite is a weighted blend of 9 inputs, each scored 0–100. Each bar is that input's sub-score; the figure is the points it added to the 100-point composite (weight × sub-score).
- Cash flow +27.9/30.0
- ARV discount +15.0/15.0
- DSCR +9.8/10.0
- 1% rule +6.8/10.0
- Rent growth +5.0/5.0
- Livability +4.0/5.0
- Condition / age +2.5/5.0
- Schools +1.0/10.0
- Appreciation +0.0/10.0
$125,000
🖨 Deal sheet 📄 Offer letter ✓ Due diligence
Key facts
- 7,405 sq ft lot
- Garage
- Built 1965
Neighborhood map
What this means for you Summary
Snapshot
- This is a 3-bed/1.5-bath single-family listed at $125k.
Deal economics
- At list price, monthly cash flow is $383 ($5k/yr) — positive.
- The deal already cash-flows at list — no discount required.
- Meets the 1% rule at list price ($1k rent vs $125k).
- Cap rate 10.0% vs local median 3.6% in Urbana — top-decile yield for the area; either an underpriced asset or a hidden risk that comps aren't pricing in. Stress-test before assuming the spread holds.
Location & tenants
- Location reads 80/100 on livability (#110 in IL, #1,793 nationally) — a professional / high-income tenant draw. Strengths: amenities A+, commute A+, cost of living A+; Watch: employment D, crime F.
- Urbana SD 116 (urban): math 11% / reading 13% proficiency, ranked #568 of 620 in IL (top 92%) — low school quality limits family demand, transient renter base, plan for 1-2y turnover; 64% free/reduced lunch — lower-income household profile, screen leases tightly.
- Zoned schools: Dr Preston L Williams Jr Elem Sch (math 5% / reading 5%, grade F, #1,741 of 2,056 statewide, top 93%, 446 students, 0% FRL); Urbana Middle School (math 6% / reading 6%, grade F, #634 of 665 statewide, top 95%, 903 students, 0% FRL); Urbana High School (math 21% / reading 29%, grade F, #247 of 693 statewide, top 36%, 1,220 students, 0% FRL) — zoned schools average 0% FRL vs 64% district-wide (64 pts lower); this property's tenant base skews higher-income than the district average.
- Market conditions: Rents rising fast (+11.8%/yr); 122 active listings in the ZIP; 11 comparable units currently listed for rent nearby; rentals lingering (median 44d on market — plan ~5-8 weeks vacancy on turnover, expect pricing pressure); 55% of comp listings sitting > 30 days — soft ceiling on asking rent; 573 units permitted in Champaign County in 2024 (359 in 5+ unit buildings).
Forward outlook
- Local home prices are declining (-3.0%/yr); year-one equity from $864 of loan paydown is wiped out by about $4k of value loss. Plan a longer hold.
- Champaign County population projected at +15% by 2050 — modest demand growth; plan on rents tracking national, not racing it.
- At projected returns (-3.0% appreciation + 8.0% rent growth), your $35k cash investment doubles in ~7 years — after that, you're playing with house money.
Negotiation context
- Only 3 days on market — expect competitive offers; lowballing is unlikely to land.
Questions for the listing agent
- Built in 1965 — when were the roof, HVAC, electrical panel, plumbing, and water heater last replaced?
- Is there a deadline driving the sale (1031 exchange, divorce, estate, relocation)? That informs how much negotiation room exists.
- Schools are D-rated, which usually means shorter tenancies and higher turnover. Who's the typical renter profile here, and what's been the actual vacancy rate?
- Crime grade is F in this area — have there been break-ins, vandalism, or insurance claims at this property in the last 3 years? What carrier currently insures it and at what premium?
- What's the average days-on-market for RENTAL listings here right now (not sales)? A rising rental-DOM trend means longer vacancies and softer asking-rent achievability than the comps imply.
- What's the recent tenant-quality profile in this submarket — average credit score on applications, eviction rate, late-payment / NSF rate, and stable-employment percentage? A property-management company in the area should have these aggregated.
- How much new for-sale + rental construction is in the pipeline within 1–3 miles? Heavy new supply typically softens prices + rents 12–24 months out; constrained supply supports both.
Investment metrics
- 1% rule
- 1.18% ✓
- Cap rate
- 9.97%
- Cash-on-cash
- 13.14%
- DSCR
- 1.58
- GRM
- 7.1
CMA / ARV
- ARV (on-the-fly)
- $150,720
- Comps found
- 12
Show comp detail 12 sales within ~0.75 mi
| Address | Dist | Beds/Ba | Sqft | Sold | Price | $/sf | Match |
|---|---|---|---|---|---|---|---|
| 2301 E Rainbow Vw | 0.00mi | 3/1.5 | 960 (0%) | 0mo | $125,000 | $130 | 100 |
| 1905 Rainbow Vw | 0.31mi | 3/1.0 | 961 (+0%) | 5mo | $100,000 | $104 | 79 |
| 1112 Lanore Dr | 0.44mi | 3/1.0 | 925 (-4%) | 1mo | $145,000 | $157 | 71 |
| 312 S Glenn Dr | 0.41mi | 3/1.0 | 925 (-4%) | 4mo | $115,000 | $124 | 69 |
| 1304 Ogelthorpe Ave | 0.19mi | 3/1.0 | 1,069 (+11%) | 2mo | $190,000 | $178 | 69 |
| 601 S Sunny Ln | 0.39mi | 3/1.0 | 1,026 (+7%) | 0mo | $189,500 | $185 | 68 |
| 806 S Sunny Ln | 0.35mi | 3/1.0 | 1,020 (+6%) | 5mo | $189,000 | $185 | 68 |
| 2417 E Green St | 0.47mi | 2/1.0 (-1) | 910 (-5%) | 3mo | $112,500 | $124 | 60 |
| 2314 1/2 E Main St | 0.69mi | 3/1.0 | 993 (+3%) | 2mo | $123,000 | $124 | 58 |
| 1512 Ogelthorpe Ave | 0.33mi | 4/2.0 (+1) | 1,078 (+12%) | 4mo | $220,000 | $204 | 54 |
| 2422 E Green St | 0.50mi | 3/1.0 | 840 (-12%) | 3mo | $145,000 | $173 | 51 |
| 1103 Austin Dr | 0.51mi | 3/1.0 | 1,089 (+13%) | 3mo | $139,000 | $128 | 49 |
Match score weights: distance 35% · size 25% · config 20% · recency 20%. Top-matched comps best support the ARV.
Projected returns pro-forma
-3.0% appreciation · 8.0% rent growth · sell at horizon
- IRR
- 8.2%
- Equity multiple
- 1.34×
- Total profit
- $11,920
- Equity at exit
- $18,638
- IRR
- 21.2%
- Equity multiple
- 3.20×
- Total profit
- $77,163
- Equity at exit
- $10,808
Cash invested: $35,000 (down + closing). Projections, not guarantees.
Landlord ↔ Tenant lean methodology
- Overall (STATE)
- 43 Moderately Tenant-Leaning
- State Illinois
- 43 Moderately Tenant-Leaning · D+7
- County
- — inherits STATE
- City
- — inherits STATE
ZIP-level market 61802
- Home prices YoY
- -20.5%
- Rents YoY
- 11.8%
- Active inventory
- 122
- Price-to-rent
- 7.1×
Monthly cashflow live
- Estimated rent
- $1,474 high interval (Pro) →
- Mortgage (P&I)
- −$656
- Tax from tax record
- −$74 /mo · $887/yr
- Insurance
- −$52
- HOA
- −$0
- Vacancy / Maint / Mgmt
- −$310
- Net cashflow
- $383
Break-even live
UW: 25.0% down · 7.5% · 30yr · 1.5% tax · 5.0% vac · 8.0% maint · 8.0% mgmt
Financing live
Cash to close
- Down payment
- $31,250
- Closing costs
- $3,750
- Reserves months
- —
- Total cash needed
- —
Loan-product check · same deal, 3 products live
Conventional
25% down · 7.5% · 30yr
- Down + closing
- —
- Monthly P&I
- —
- Monthly cashflow
- —
- DSCR
- —
- Eligible?
- —
Personal DTI + credit; lowest rate.
DSCR
20% down · 8.5% · 30yr
- Down + closing
- —
- Monthly P&I
- —
- Monthly cashflow
- —
- DSCR
- —
- Eligible?
- —
No personal income docs; deal must DSCR.
Hard money
10% down · 12.0% · 12mo
- Down + closing
- —
- Monthly P&I
- —
- Monthly cashflow
- —
- DSCR
- —
- Eligible?
- —
Short-term bridge; refi at stabilization.
Rent comps 11 comps
| Address | Beds | Baths | Sqft | Rent | $/sqft | DOM | Units | Dist |
|---|---|---|---|---|---|---|---|---|
| 2307 Lantern Hill Dr Urbana, IL | 3.0 | 1.0 | 905 | $1,500 | $1.66 | 43d | 1 | 0.05mi |
| 1507 E Washington St Urbana, IL | 2.0 | 1.0 | 850 | $950 | $1.12 | 43d | 1 | 0.64mi |
| 1601 E Florida Ave Urbana, IL | 2.0–3.0 | 2.0–3.0 | 949 | $1,459 | $1.54 | 13d | 1 | 0.73mi |
| 1806 S Cottage Grove Ave Urbana, IL | 2.0–3.0 | 1.5–2.0 | 1000 | $1,295 | $1.29 | 13d | 3 | 1.03mi |
| 1201 S Lynn St Urbana, IL | 2.0 | 1.0 | 747 | $1,350 | $1.81 | 44d | 1 | 1.07mi |
| 804 E Michigan Ave Urbana, IL | 2.0 | 1.0 | 761 | $1,325 | $1.74 | 43d | 1 | 1.08mi |
| 615 E Colorado Ave Unit B Urbana, IL | 3.0 | 1.5 | 1056 | $1,495 | $1.42 | 13d | 1 | 1.31mi |
| 615 E Colorado Ave Unit B Urbana, IL | 3.0 | 1.5 | 1056 | $1,395 | $1.32 | 43d | 1 | 1.31mi |
| 306 E Michigan Ave Urbana, IL | 2.0 | 1.5 | 800 | $1,100 | $1.38 | 21d | 1 | 1.37mi |
| 503 S Urbana Ave Urbana, IL | 2.0 | 1.5 | 775 | $1,275 | $1.65 | 13d | 2 | 1.42mi |
| 503 S Urbana Ave Apt C Urbana, IL | 2.0 | 1.5 | 775 | $1,250 | $1.61 | 43d | 1 | 1.42mi |
Listing history 2 events
-
2026-04-25status Pending
-
2026-04-09historical
ⓘ Source: listings_history table (triggers on properties + properties_extension) + one-shot
backfill from property_details.listing_events for pre-trigger history.
Tax reassessment forecast IL · Partial reset (capped growth)
- Current annual tax
- $887 · $74/mo
- Projected year-2 tax
- $1,862 · $155/mo
- Expected delta
- +$975/yr (+$81/mo · 109.9%)
ⓘ Screening estimate from a state-policy table — verify with the county assessor before closing.
Climate risk First Street
- Flood 1/10 Low FEMA zone X (unshaded) · 0% chance over 30 yrs
- Wildfire 1/10 Low
- Heat 3/10 Moderate 7 d/yr ≥104°F today · 19 d/yr by 30 yrs out
- Wind 2/10 Low 100% chance of damaging wind over 30 yrs
- Air quality 2/10 Low 1 unhealthy d/yr today · 2 by 30 yrs out
Nearby sold comps map
Loading sold comps map…
Walkable amenities ~0.75 mi
Loading nearby amenities…
Taxation est. · year 1
- Rental income
- $17,693
- − Mortgage interest
- −$7,002
- − Property taxes
- −$887
- − Insurance
- −$625
- − Repairs & maintenance
- −$1,415
- − Management
- −$1,415
- − Depreciation
- −$3,636
- Taxable income
- $2,712
- Est. tax owed @ 24.0%
- −$651
- After-tax cash flow
- $3,949/yr
For passive investors: Depreciation is non-cash, so a rental often shows a tax loss while cash-flowing — sheltering income. Rental losses are passive: they offset passive income freely, and up to $25,000/yr can offset ordinary (W-2) income if you actively participate and your MAGI is under $100k (phasing out to $0 by $150k); unused losses carry forward. On sale, claimed depreciation is recaptured at up to 25%, and gains may owe capital-gains tax (a 1031 exchange can defer both). Figures are a year-1 estimate at your 24.0% rate — not tax advice; consult a CPA.
Schools (NCES district)
- District
- Urbana SD 116
- NCES district ID
- 1739960
- Math proficiency
- 11% ▼ -5.00%
- Reading proficiency
- 13% ▼ -7.00%
- Median HH income
- $33,678
- Composite
- 9.72/100
- National rank
- #9830
- State rank
- #568 of 620 in IL
Livability — Urbana
- Score
- 80/100
- State rank
- #110
- US rank
- #1793
Category grades
Schools grade is shown separately in the Schools card above.
Census & demographics
- Census place
- Urbana, IL
- County
- Champaign County · 182,148 people
- City population
- 48,184
- Metro
- Champaign-Urbana, IL
- Population (ZIP)
- 20,293
- Household income
- $61,620
- Rent vs Own
- Severe rent burden
- 809.0
Population outlook (Champaign County) Hauer SSP2
- Today (2025)
- 223,848 people
- By 2030
- 231,416 · +3.4%
- By 2040
- 244,321 · +9.1%
- By 2050
- 256,432 · +14.6%
- By 2075
- 285,823 · +27.7%
- By 2100
- 296,406 · +32.4%
Race, ethnicity, and origin ACS 2023
- Neighborhood character
- Diverse neighborhood (Simpson 0.58)
- Race & ethnicity
- White 61% Black 18% Hispanic / Latino 11% Asian 7% Two or more races 6%
- Hispanic origin (detail)
- Mexican 7% Puerto Rican 1%
- Common ancestry
- Romanian 3% Lithuanian 2% Italian 1%
- Foreign-born
- 12% · China, Canada, South Korea
- Languages at home
- 83% English-only · Spanish 7% Other Indo-European 2% Chinese 2%
Political lean MEDSL · Champaign
- 2024 margin
- Strong D (+24.1) · D 61.3% · R 37.2% · Other 1.5%
- 2008→2024 swing
- +6.6pp toward D · 2008: 17.5pp · 2024: 24.1pp
- All cycles
- 2024: D+24.1 2020: D+22.8 2016: D+18.4 2012: D+6.8 2008: D+17.5
Not yet ingested
- Civics
- —
Market trends
- HPI YoY
- ▼ -53.21%
- Current HPI
- 206.3079
- Rent YoY
- ▲ 11.85%
- Metro
- Champaign-Urbana, IL
- State GDP YoY
- ▲ 1.59%
- F500 in state
- 60
Industry mix (Fortune 500 HQ in IL)
| Industry | F500 HQs | Revenue |
|---|---|---|
| Insurance | 4 | $201B |
|
||
| Consumer Goods | 4 | $87B |
|
||
| Industrial Machinery | 3 | $64B |
|
||
| Healthcare | 2 | $55B |
|
||
| Retail / Pharmacy | 1 | $148B |
|
||
| Agriculture / Food | 1 | $86B |
|
||
Property tax history
-0.1%/yrLatest (2024): $887 · -3.0% YoY. Source: county tax records.
Cash-flow waterfall
monthlySold comps — $/sqft
last 12 mo · ≤1 miLoading sold comps…