248 Dogwood Dr · Wading River, NY
Flood risk 1/10 · Minimal
- FEMA flood zone
- X (unshaded)
- Chance of flooding over 30 yrs
- 0.0%
- Est. flood insurance / yr
- $473 – $860
Fire risk 3/10 · Minor
- Est. fire insurance / yr
- $691 – $1,283
Heat risk 4/10 · Minor
- Hot days now (above 93°F)
- 7 days/yr
- Hot days in 30 yrs
- 17 days/yr
Wind risk 8/10 · Major
- Chance of severe wind over 30 yrs
- 80.0%
Air-quality risk 3/10 · Minor
- Unhealthy air days now
- 2 days/yr
- Unhealthy air days in 30 yrs
- 3 days/yr
Risk factors via First Street. Map © Google.
Why this score? — see what drove the C grade
The composite is a weighted blend of 9 inputs, each scored 0–100. Each bar is that input's sub-score; the figure is the points it added to the 100-point composite (weight × sub-score).
- Cash flow +19.2/30.0
- ARV discount +11.5/15.0
- Schools +7.4/10.0
- DSCR +6.1/10.0
- 1% rule +4.3/10.0
- Livability +3.2/5.0
- Rent growth +2.5/5.0
- Condition / age +2.5/5.0
- Appreciation +0.0/10.0
$689,000
🖨 Deal sheet 📄 Offer letter ✓ Due diligence
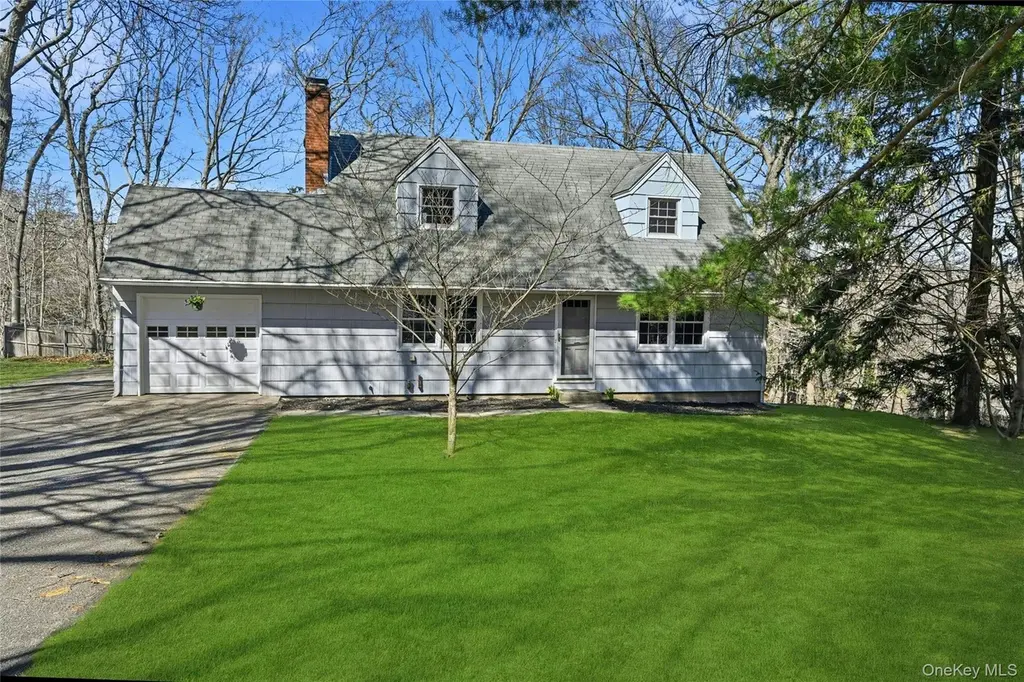
Listing remarks
Charming Cape Cod in private cul-d-sac with lots of privacy surrounded by nature! All new chef's kitchen with quartz counters and designer white cabinetry and stainless appliances, luxury vinyl flooring. Spacious living room with walls of windows, wood fireplace and gleaming oak floors throughout! 4 Bedrooms and 2 NEW Baths. Daylight basement with outside entrance would be a perfect playroom. Attached garage and newer cast iron heating system with new oil tank. Upgraded electric, Shoreham Wading River schools! Great community and great location close to center of town and beaches.
Key facts
- 0.6 acre lot
- Garage
- Built 1960
Neighborhood map
What this means for you Summary
Snapshot
- This is a 3-bed/2.0-bath single-family listed at $689k.
Deal economics
- At list price, monthly cash flow is $743 ($9k/yr) — positive.
- The deal already cash-flows at list — no discount required.
- To meet the 1% rule (rent ≥ 1% of price), the offer needs to be $641k (6.9% below list).
- Recommended offer: $641k (6.9% below list) — sets the bar for 1% rule.
- Cap rate 7.6% vs local median 4.8% in Wading River — top-decile yield for the area; either an underpriced asset or a hidden risk that comps aren't pricing in. Stress-test before assuming the spread holds.
Location & tenants
- Location reads 64/100 on livability (#779 in NY) — a middle-class / working-renter tenant base. Strengths: employment A+, housing A+, crime A; Watch: amenities F, commute F, cost of living F.
- Shoreham-Wading River Central School District (suburban): math 80% / reading 81% proficiency, ranked #36 of 590 in NY (top 6%) — strong family-tenant draw, lease renewals of 3-5y typical; only 3% free/reduced lunch — higher-income household profile.
- Market conditions: 65 active listings in the ZIP; 4 comparable units currently listed for rent nearby; rentals at typical pace (median 22d on market — plan ~3-4 weeks tenant-placement turnaround); 1,366 units permitted in Suffolk County in 2024 (216 in 5+ unit buildings).
Forward outlook
- Local home prices are declining (-3.0%/yr); year-one equity from $5k of loan paydown is wiped out by about $21k of value loss. Plan a longer hold.
- Suffolk County population projected to shrink 5% by 2050 — rents likely to lag national; underwrite the cash flow, not the appreciation.
Negotiation context
- It's been on market 30 days — a 2% lower offer ($679k) is reasonable based on typical stale-listing flexibility.
Risks & watch-outs
- Climate carrying-cost: severe wind risk, 80% chance of damaging wind over 30y — expect insurance premiums to compound above CPI over the hold.
Questions for the listing agent
- Built in 1960 — when were the roof, HVAC, electrical panel, plumbing, and water heater last replaced?
- Is there a deadline driving the sale (1031 exchange, divorce, estate, relocation)? That informs how much negotiation room exists.
- Schools are B-rated — typically a magnet for longer-tenancy family renters. What's the average tenant stay here, and is there a school-zone premium baked into asking?
- What's the average days-on-market for RENTAL listings here right now (not sales)? A rising rental-DOM trend means longer vacancies and softer asking-rent achievability than the comps imply.
- What's the recent tenant-quality profile in this submarket — average credit score on applications, eviction rate, late-payment / NSF rate, and stable-employment percentage? A property-management company in the area should have these aggregated.
- How much new for-sale + rental construction is in the pipeline within 1–3 miles? Heavy new supply typically softens prices + rents 12–24 months out; constrained supply supports both.
Investment metrics
- 1% rule
- 0.93% ✗
- Cap rate
- 7.59%
- Cash-on-cash
- 4.62%
- DSCR
- 1.21
- GRM
- 9.0
CMA / ARV
- ARV (median comp)
- $756,211
- List price
- $689,000
- Delta
- -8.89%
- Verdict
- FAIR
- Comps
- 20 within 1.0 mi
Show comp detail 5 sales within ~0.75 mi
| Address | Dist | Beds/Ba | Sqft | Sold | Price | $/sf | Match |
|---|---|---|---|---|---|---|---|
| 31 Remsen Rd | 0.21mi | 3/2.5 | 1,746 (+7%) | 7mo | $625,000 | $358 | 71 |
| 3 Russell Dr | 0.52mi | 3/2.0 | 1,595 (-3%) | 10mo | $799,000 | $501 | 63 |
| 47 Remsen Rd | 0.25mi | 3/3.0 | 1,800 (+10%) | 24mo | $682,000 | $379 | 48 |
| 464 Remsen Rd | 0.67mi | 3/2.0 | 1,740 (+6%) | 14mo | $660,000 | $379 | 47 |
| 26 Zophar Mills Rd | 0.54mi | 3/3.0 | 1,850 (+13%) | 16mo | $722,000 | $390 | 36 |
Match score weights: distance 35% · size 25% · config 20% · recency 20%. Top-matched comps best support the ARV.
Projected returns pro-forma
-3.0% appreciation · 3.0% rent growth · sell at horizon
- IRR
- -9.1%
- Equity multiple
- 0.67×
- Total profit
- $-64,493
- Equity at exit
- $102,732
- IRR
- 0.3%
- Equity multiple
- 1.02×
- Total profit
- $4,079
- Equity at exit
- $59,572
Cash invested: $192,920 (down + closing). Projections, not guarantees.
Landlord ↔ Tenant lean methodology
- Overall (STATE)
- 15 Strongly Tenant-Friendly
- State New York
- 15 Strongly Tenant-Friendly · D+10
- County
- — inherits STATE
- City
- — inherits STATE
ZIP-level market 11792
- Home prices YoY
- -5.2%
- Active inventory
- 65
- Price-to-rent
- 9.0×
Monthly cashflow live
- Estimated rent
- $6,412 medium interval (Pro) →
- Mortgage (P&I)
- −$3,613
- Tax from tax record
- −$422 /mo · $5,063/yr
- Insurance
- −$287
- HOA
- −$0
- Vacancy / Maint / Mgmt
- −$1,346
- Net cashflow
- $743
Break-even live
UW: 25.0% down · 7.5% · 30yr · 1.5% tax · 5.0% vac · 8.0% maint · 8.0% mgmt
Financing live
Cash to close
- Down payment
- $172,250
- Closing costs
- $20,670
- Reserves months
- —
- Total cash needed
- —
Loan-product check · same deal, 3 products live
Conventional
25% down · 7.5% · 30yr
- Down + closing
- —
- Monthly P&I
- —
- Monthly cashflow
- —
- DSCR
- —
- Eligible?
- —
Personal DTI + credit; lowest rate.
DSCR
20% down · 8.5% · 30yr
- Down + closing
- —
- Monthly P&I
- —
- Monthly cashflow
- —
- DSCR
- —
- Eligible?
- —
No personal income docs; deal must DSCR.
Hard money
10% down · 12.0% · 12mo
- Down + closing
- —
- Monthly P&I
- —
- Monthly cashflow
- —
- DSCR
- —
- Eligible?
- —
Short-term bridge; refi at stabilization.
Rent comps 4 comps
| Address | Beds | Baths | Sqft | Rent | $/sqft | DOM | Units | Dist |
|---|---|---|---|---|---|---|---|---|
| 126 Overhill Rd Wading River, NY | 3.0 | 2.5 | 1600 | $7,000 | $4.38 | 1d | 1 | 0.23mi |
| 212 Creek Rd Unit 1510784P Wading River, NY | 4.0 | 3.0 | 1797 | $6,360 | $3.54 | 22d | 1 | 1.04mi |
| 184 Creek Rd Unit 1510783P Wading River, NY | 3.0 | 2.0 | 1722 | $5,010 | $2.91 | 24d | 1 | 1.05mi |
| 148 Creek Rd Unit 1510782P Wading River, NY | 2.0 | 2.0 | 1194 | $4,718 | $3.95 | 2d | 1 | 1.07mi |
Listing history 2 events
-
2026-04-10$689,000 Active
-
2026-04-08historical
ⓘ Source: listings_history table (triggers on properties + properties_extension) + one-shot
backfill from property_details.listing_events for pre-trigger history.
Tax reassessment forecast NY · Partial reset (capped growth)
- Current annual tax
- $5,063 · $422/mo
- Projected year-2 tax
- $8,353 · $696/mo
- Expected delta
- +$3,291/yr (+$274/mo · 65.0%)
ⓘ Screening estimate from a state-policy table — verify with the county assessor before closing.
Climate risk First Street
- Flood 1/10 Low FEMA zone X (unshaded) · 0% chance over 30 yrs
- Wildfire 3/10 Moderate
- Heat 4/10 Moderate 7 d/yr ≥93°F today · 17 d/yr by 30 yrs out
- Wind 8/10 Severe 80% chance of damaging wind over 30 yrs
- Air quality 3/10 Moderate 2 unhealthy d/yr today · 3 by 30 yrs out
Nearby sold comps map
Loading sold comps map…
Walkable amenities ~0.75 mi
Loading nearby amenities…
Taxation est. · year 1
- Rental income
- $76,941
- − Mortgage interest
- −$38,595
- − Property taxes
- −$5,063
- − Insurance
- −$3,445
- − Repairs & maintenance
- −$6,155
- − Management
- −$6,155
- − Depreciation
- −$20,044
- Taxable loss
- −$2,516
- Est. tax savings @ 24.0%
- +$604
- After-tax cash flow
- $9,521/yr
For passive investors: Depreciation is non-cash, so a rental often shows a tax loss while cash-flowing — sheltering income. Rental losses are passive: they offset passive income freely, and up to $25,000/yr can offset ordinary (W-2) income if you actively participate and your MAGI is under $100k (phasing out to $0 by $150k); unused losses carry forward. On sale, claimed depreciation is recaptured at up to 25%, and gains may owe capital-gains tax (a 1031 exchange can defer both). Figures are a year-1 estimate at your 24.0% rate — not tax advice; consult a CPA.
Schools (NCES district)
- District
- Shoreham-Wading River Central School District
- NCES district ID
- 3626840
- Math proficiency
- 80% ▼ -1.00%
- Reading proficiency
- 81% ▲ 6.00%
- Median HH income
- $115,782
- Composite
- 74.37/100
- National rank
- #160
- State rank
- #36 of 590 in NY
Livability — Wading River
- Score
- 64/100
- State rank
- #779
- US rank
- #14836
Category grades
Schools grade is shown separately in the Schools card above.
Census & demographics
- Census place
- Wading River, NY
- City population
- 8,562
- Population (ZIP)
- 8,562
Population outlook (Suffolk County) Hauer SSP2
- Today (2025)
- 1,505,262 people
- By 2030
- 1,498,318 · -0.5%
- By 2040
- 1,471,101 · -2.3%
- By 2050
- 1,424,848 · -5.3%
- By 2075
- 1,337,157 · -11.2%
- By 2100
- 1,217,720 · -19.1%
Race, ethnicity, and origin ACS 2023
- Neighborhood character
- Predominantly White (87%)
- Race & ethnicity
- White 87% Hispanic / Latino 10% Two or more races 4% Black 1%
- Hispanic origin (detail)
- Dominican 1%
- Common ancestry
- Romanian 4% Portuguese 2% Italian 2%
- Foreign-born
- 9% · Canada, Jamaica
- Languages at home
- 91% English-only · Spanish 4% Other Indo-European 3% Russian/Polish/Slavic 2%
Political lean MEDSL · Suffolk
- 2024 margin
- Lean R (+10.0) · D 45.0% · R 55.0%
- 2008→2024 swing
- -16.0pp toward R · 2008: 6.0pp · 2024: -10.0pp
- All cycles
- 2024: R+10.0 2020: R+0.0 2016: R+8.2 2012: D+2.9 2008: D+6.0
Not yet ingested
- Civics
- —
Market trends
- HPI YoY
- ▼ -18.79%
- Current HPI
- 344.4308
- Rent YoY
- —
- Metro
- —
- State GDP YoY
- ▲ 2.60%
- F500 in state
- 92
Industry mix (Fortune 500 HQ in NY)
| Industry | F500 HQs | Revenue |
|---|---|---|
| Financial Services | 10 | $950B |
|
||
| Consumer Goods | 9 | $162B |
|
||
| Insurance | 4 | $225B |
|
||
| Telecommunications | 2 | $144B |
|
||
| Pharmaceuticals | 2 | $112B |
|
||
| Media / Entertainment | 2 | $69B |
|
||
Price history
2 events — show timeline
- 2026-04-10 Listed $689,000 OneKey® MLS as Distributed by MLS Grid
- 2026-04-08 Coming Soon — OneKey® MLS as Distributed by MLS Grid
Property tax history
-1.2%/yrLatest (2025): $5,063 · +0.0% YoY. Source: county tax records.
Cash-flow waterfall
monthlySold comps — $/sqft
last 12 mo · ≤1 miLoading sold comps…