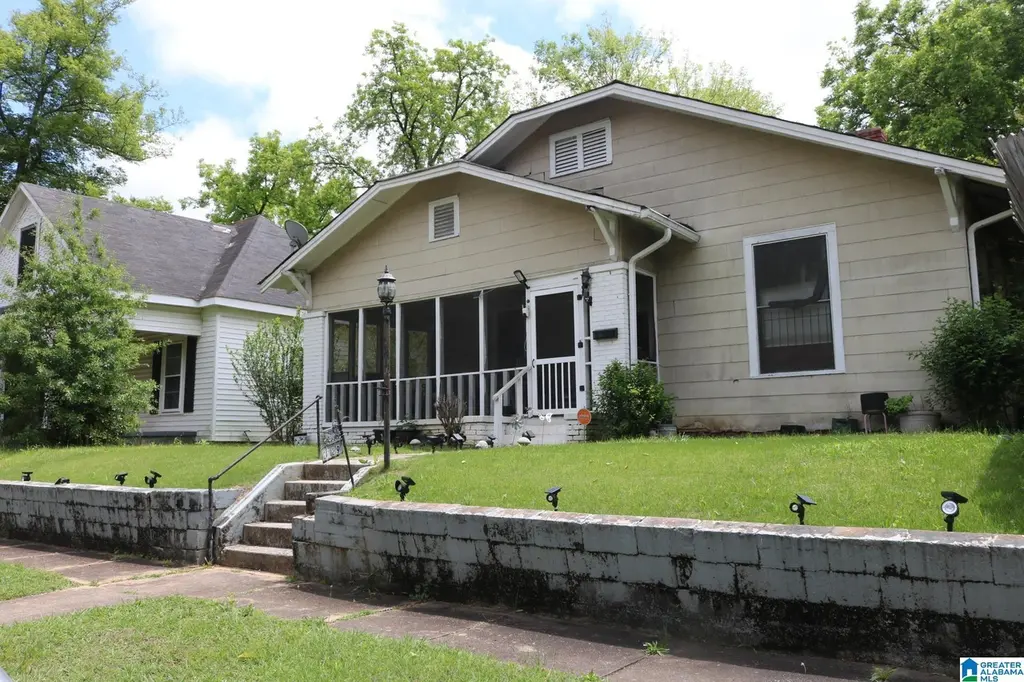
2329 20th Street Ensley S · Birmingham, AL
Flood risk 1/10 · Minimal
- FEMA flood zone
- X (unshaded)
- Chance of flooding over 30 yrs
- 0.0%
- Est. flood insurance / yr
- $473 – $860
Fire risk 1/10 · Minimal
- Est. fire insurance / yr
- $916 – $1,700
Heat risk 6/10 · Moderate
- Hot days now (above 106°F)
- 7 days/yr
- Hot days in 30 yrs
- 18 days/yr
Wind risk 6/10 · Moderate
- Chance of severe wind over 30 yrs
- 27.0%
Air-quality risk 4/10 · Minor
- Unhealthy air days now
- 5 days/yr
- Unhealthy air days in 30 yrs
- 5 days/yr
Risk factors via First Street. Map © Google.
Why this score? — see what drove the B+ grade
The composite is a weighted blend of 9 inputs, each scored 0–100. Each bar is that input's sub-score; the figure is the points it added to the 100-point composite (weight × sub-score).
- Cash flow +30.0/30.0
- ARV discount +15.0/15.0
- 1% rule +10.0/10.0
- DSCR +10.0/10.0
- Appreciation +4.2/10.0
- Livability +3.4/5.0
- Rent growth +2.5/5.0
- Condition / age +2.5/5.0
- Schools +0.9/10.0
$69,900
🖨 Deal sheet 📄 Offer letter ✓ Due diligence
Listing remarks
VERY SPACIOUS HOME EASY ACCESS TO THE INTER-STATE
Key facts
- 6,969 sq ft lot
- Built 1920
Property features AI
Finance
- Other: Property is approximately 0.16 acres; Fire, garbage, and library fees are included
- HOA & community: No association fee
Exterior
- Parking: Off-street parking
- Utilities: Public water; Connected sewer; Electric water heater; Internet service availability unknown
- Home design: Existing structure; Not tri-level, split-level, split-foyer, loft, or log home
- Construction: Siding (other); Crawl space foundation
- Exterior features: Porch
Interior
- Kitchen: Laminate countertops; Kitchen on the main level
- Bedrooms: Three bedrooms on the main level
- Flooring: Carpet flooring
- Bathrooms: One full bathroom on the main level
- Heating & cooling: No heating; No air conditioning
- Interior features: Ceilings: other (see remarks); No built-in interior features listed
- Laundry & utility: Main-level laundry with washer hookup; Electric dryer hookup; Attic present
Neighborhood map
What this means for you Summary
Snapshot
- This is a 3-bed/1.0-bath single-family listed at $70k.
Deal economics
- At list price, monthly cash flow is $479 ($6k/yr) — positive.
- The deal already cash-flows at list — no discount required.
- Meets the 1% rule at list price ($1k rent vs $70k).
- Cap rate 14.5% vs local median 6.2% in Birmingham — top-decile yield for the area; either an underpriced asset or a hidden risk that comps aren't pricing in. Stress-test before assuming the spread holds.
Location & tenants
- Location reads 67/100 on livability (#78 in AL) — a middle-class / working-renter tenant base. Strengths: commute A+, cost of living A+, housing A+; Watch: amenities C-, crime F, employment F.
- Birmingham City (urban): math 4% / reading 20% proficiency, ranked #116 of 129 in AL (top 90%) — low school quality limits family demand, transient renter base, plan for 1-2y turnover; 82% free/reduced lunch — lower-income household profile, screen leases tightly.
- Zoned schools: Minor Elementary School (math 0% / reading 14%, grade F, #601 of 627 statewide, top 98%, 454 students, 90% FRL).
- Market conditions: 50 active listings in the ZIP; 40 comparable units currently listed for rent nearby; rentals at typical pace (median 24d on market — plan ~3-4 weeks tenant-placement turnaround); 45% of comp listings sitting > 30 days — soft ceiling on asking rent; lower-income renter base — watch delinquency; 2,114 units permitted in Jefferson County in 2024 (556 in 5+ unit buildings).
- At $1,254/mo this rent would consume 49% of the median local household income ($31k/yr) (locally 621% of renters already pay >50% of income on rent) — very limited rent-growth headroom before tenants either downsize or default.
Forward outlook
- Local home prices are declining (-1.5%/yr); year-one equity from $483 of loan paydown is wiped out by about $1k of value loss. Plan a longer hold.
- Jefferson County population projected to shrink 4% by 2050 — rents likely to lag national; underwrite the cash flow, not the appreciation.
- At projected returns (-1.5% appreciation + 3.0% rent growth), your $20k cash investment doubles in ~4 years — after that, you're playing with house money.
Negotiation context
- Only 1 days on market — expect competitive offers; lowballing is unlikely to land.
- Current owner paid $32k; list at $70k implies a 121% gain — meaningful room to come down on a strong offer.
Risks & watch-outs
- Watch-outs: built in 1920 — expect roof / HVAC / electrical / plumbing capex.
- Climate carrying-cost: major wind risk, 27% chance of damaging wind over 30y; extreme-heat days projected 7→18/yr by 2055 (HVAC capex compounding) — expect insurance premiums to compound above CPI over the hold.
Questions for the listing agent
- Built in 1920 — when were the roof, HVAC, electrical panel, plumbing, and water heater last replaced?
- Is there a deadline driving the sale (1031 exchange, divorce, estate, relocation)? That informs how much negotiation room exists.
- Schools are F-rated, which usually means shorter tenancies and higher turnover. Who's the typical renter profile here, and what's been the actual vacancy rate?
- Crime grade is F in this area — have there been break-ins, vandalism, or insurance claims at this property in the last 3 years? What carrier currently insures it and at what premium?
- What's the average days-on-market for RENTAL listings here right now (not sales)? A rising rental-DOM trend means longer vacancies and softer asking-rent achievability than the comps imply.
- What's the recent tenant-quality profile in this submarket — average credit score on applications, eviction rate, late-payment / NSF rate, and stable-employment percentage? A property-management company in the area should have these aggregated.
- How much new for-sale + rental construction is in the pipeline within 1–3 miles? Heavy new supply typically softens prices + rents 12–24 months out; constrained supply supports both.
Investment metrics
- 1% rule
- 1.79% ✓
- Cap rate
- 14.51%
- Cash-on-cash
- 29.35%
- DSCR
- 2.31
- GRM
- 4.6
CMA / ARV
- ARV (on-the-fly)
- $86,680
- Comps found
- 12
Show comp detail 12 sales within ~0.75 mi
| Address | Dist | Beds/Ba | Sqft | Sold | Price | $/sf | Match |
|---|---|---|---|---|---|---|---|
| 2309 22nd St Ensley | 0.18mi | 4/1.0 (+1) | 1,495 (-5%) | 4mo | $87,500 | $59 | 75 |
| 2321 22nd St Ensley | 0.17mi | 3/1.5 | 1,388 (-12%) | 0mo | $77,000 | $55 | 70 |
| 2517 Avenue | 0.39mi | 4/1.5 (+1) | 1,638 (+4%) | 1mo | $114,429 | $70 | 67 |
| 2720 23rd St W | 0.41mi | 3/1.0 | 1,692 (+7%) | 6mo | $45,000 | $27 | 64 |
| 2671 20th St W | 0.32mi | 3/2.0 | 1,428 (-9%) | 2mo | $205,000 | $144 | 63 |
| 1319 Court R | 0.40mi | 3/2.0 | 1,450 (-8%) | 6mo | $39,900 | $28 | 60 |
| 2728 20th Place Ensley | 0.38mi | 3/1.0 | 1,344 (-15%) | 1mo | $47,000 | $35 | 56 |
| 2436 29th St W | 0.54mi | 3/1.0 | 1,398 (-11%) | 2mo | $98,100 | $70 | 54 |
| 2854 20th St W | 0.64mi | 3/1.5 | 1,634 (+4%) | 10mo | $62,000 | $38 | 54 |
| 2627 28th St | 0.38mi | 3/2.0 | 1,412 (-10%) | 8mo | $179,900 | $127 | 54 |
| 3100 Pike Rd | 0.67mi | 3/1.0 | 1,461 (-7%) | 6mo | $81,000 | $55 | 51 |
| 1711 7th Ave W | 0.67mi | 3/1.0 | 1,359 (-14%) | 4mo | $57,000 | $42 | 43 |
Match score weights: distance 35% · size 25% · config 20% · recency 20%. Top-matched comps best support the ARV.
Projected returns pro-forma
-1.54% appreciation · 3.0% rent growth · sell at horizon
- IRR
- 26.8%
- Equity multiple
- 2.20×
- Total profit
- $23,573
- Equity at exit
- $15,080
- IRR
- 32.6%
- Equity multiple
- 4.27×
- Total profit
- $63,929
- Equity at exit
- $14,354
Cash invested: $19,572 (down + closing). Projections, not guarantees.
Landlord ↔ Tenant lean methodology
- Overall (STATE)
- 90 Strongly Landlord-Friendly
- State Alabama
- 90 Strongly Landlord-Friendly · R+15
- County
- — inherits STATE
- City
- — inherits STATE
ZIP-level market 35218
- Home prices YoY
- -0.9%
- Active inventory
- 50
- Price-to-rent
- 4.6×
Monthly cashflow live
- Estimated rent
- $1,254 high interval (Pro) →
- Mortgage (P&I)
- −$367
- Tax from tax record
- −$116 /mo · $1,393/yr
- Insurance
- −$29
- HOA
- −$0
- Vacancy / Maint / Mgmt
- −$263
- Net cashflow
- $479
Break-even live
UW: 25.0% down · 7.5% · 30yr · 1.5% tax · 5.0% vac · 8.0% maint · 8.0% mgmt
Financing live
Cash to close
- Down payment
- $17,475
- Closing costs
- $2,097
- Reserves months
- —
- Total cash needed
- —
Loan-product check · same deal, 3 products live
Conventional
25% down · 7.5% · 30yr
- Down + closing
- —
- Monthly P&I
- —
- Monthly cashflow
- —
- DSCR
- —
- Eligible?
- —
Personal DTI + credit; lowest rate.
DSCR
20% down · 8.5% · 30yr
- Down + closing
- —
- Monthly P&I
- —
- Monthly cashflow
- —
- DSCR
- —
- Eligible?
- —
No personal income docs; deal must DSCR.
Hard money
10% down · 12.0% · 12mo
- Down + closing
- —
- Monthly P&I
- —
- Monthly cashflow
- —
- DSCR
- —
- Eligible?
- —
Short-term bridge; refi at stabilization.
Rent comps 40 comps
| Address | Beds | Baths | Sqft | Rent | $/sqft | DOM | Units | Dist |
|---|---|---|---|---|---|---|---|---|
| 2356 22nd Street Ensley Unit ENSLEY Birmingham, AL | 3.0 | 1.0 | 1500 | $985 | $0.66 | 23d | 1 | 0.11mi |
| 2609 20th Street Ensley Birmingham, AL | 3.0 | 2.0 | 1500 | $1,550 | $1.03 | 3d | 1 | 0.19mi |
| 2609 20th Street Ensley Birmingham, AL | 3.0 | 2.0 | 1229 | $1,550 | $1.26 | 43d | 1 | 0.19mi |
| 2621 20th Street Ensley Birmingham, AL | 3.0 | 1.0 | 1117 | $1,295 | $1.16 | 43d | 1 | 0.21mi |
| 2337 23rd Street Ensley Birmingham, AL | 3.0 | 1.0 | 1446 | $1,295 | $0.90 | 43d | 1 | 0.22mi |
| 2714 17th Street Ensley Birmingham, AL | 4.0 | 2.0 | 1976 | $1,553 | $0.79 | 3d | 1 | 0.29mi |
| 2523 16th street Ensley Unit ENSLEY Birmingham, AL | 4.0 | 2.0 | 1584 | $1,300 | $0.82 | 43d | 1 | 0.30mi |
| 2528 25th Street Ensley Birmingham, AL | 3.0 | 1.0 | 1563 | $1,100 | $0.70 | 43d | 1 | 0.33mi |
| 2426 Avenue U Unit U Birmingham, AL | 3.0 | 2.0 | 1260 | $1,175 | $0.93 | 19d | 1 | 0.36mi |
| 2720 23rd Street Ensley Birmingham, AL | 4.0 | 2.0 | 1350 | $1,500 | $1.11 | 3d | 1 | 0.38mi |
| 2720 23rd Street Ensley Birmingham, AL | 4.0 | 2.0 | 1692 | $1,500 | $0.89 | 19d | 1 | 0.38mi |
| 2108 25th Street Ensley Birmingham, AL | 4.0 | 2.0 | 1446 | $1,300 | $0.90 | 43d | 1 | 0.38mi |
| 2213 25th Street Ensley Birmingham, AL | 4.0 | 2.0 | 1197 | $1,150 | $0.96 | 10d | 1 | 0.39mi |
| 2712 24th Street Ensley Unit ENSLEY Birmingham, AL | 3.0 | 1.0 | 1232 | $1,099 | $0.89 | 23d | 1 | 0.40mi |
| 1720 Cullman Ave Unit 2 Birmingham, AL | 3.0 | 1.0 | 1174 | $899 | $0.77 | 21d | 1 | 0.40mi |
| 1720 Cullman Ave Unit 3 Birmingham, AL | 3.0 | 2.0 | 1174 | $950 | $0.81 | 43d | 1 | 0.40mi |
| 1825 18th Street Ensley Unit ENSLEY Birmingham, AL | 3.0 | 1.0 | 1316 | $1,123 | $0.85 | 43d | 1 | 0.46mi |
| 2037 26th Street Ensley Birmingham, AL | 3.0 | 1.0 | 1074 | $995 | $0.93 | 43d | 1 | 0.47mi |
| 2436 Avenue S Birmingham, AL | 4.0 | 2.0 | 1800 | $1,400 | $0.78 | 3d | 1 | 0.48mi |
| 2348 Court R Birmingham, AL | 3.0 | 2.0 | 1792 | $1,769 | $0.99 | 1d | 1 | 0.56mi |
| 2709 30th Street Ensley Birmingham, AL | 4.0 | 2.0 | 1410 | $1,323 | $0.94 | 2d | 1 | 0.56mi |
| 2304 Eufaula Ave Birmingham, AL | 3.0 | 1.0 | 1381 | $980 | $0.71 | 43d | 1 | 0.57mi |
| 2309 Eufaula Ave Birmingham, AL | 4.0 | 2.0 | 1454 | $1,395 | $0.96 | 23d | 1 | 0.59mi |
| 2920 24th Street Ensley Unit ENSLEY Birmingham, AL | 3.0 | 2.0 | 1800 | $1,050 | $0.58 | 23d | 1 | 0.63mi |
| 3113 Pike Rd Birmingham, AL | 3.0 | 2.0 | 1143 | $1,275 | $1.12 | 43d | 1 | 0.67mi |
| 3017 Ensley Ave Birmingham, AL | 3.0 | 1.0 | 1540 | $1,400 | $0.91 | 1d | 1 | 0.70mi |
| 1642 Graymont Ave W Birmingham, AL | 3.0 | 1.0 | 1219 | $1,090 | $0.89 | 2d | 1 | 0.71mi |
| 1701 4th Ter W Birmingham, AL | 4.0 | 2.5 | 1977 | $1,550 | $0.78 | 23d | 1 | 0.72mi |
| 1616 28th Street Ensley Birmingham, AL | 3.0 | 1.0 | 1081 | $1,100 | $1.02 | 43d | 1 | 0.83mi |
| 1621 2nd Ct W Birmingham, AL | 3.0 | 1.0 | 1074 | $1,095 | $1.02 | 43d | 1 | 0.84mi |
| 1724 30th Street Ensley Birmingham, AL | 4.0 | 2.0 | 1428 | $1,395 | $0.98 | 16d | 1 | 0.84mi |
| 3009 Prince Ave Birmingham, AL | 3.0 | 2.0 | 1176 | $1,095 | $0.93 | 23d | 1 | 0.85mi |
| 1701 Avenue I Unit I Birmingham, AL | 4.0 | 2.0 | 1509 | $1,225 | $0.81 | 2d | 1 | 0.85mi |
| 1701 Avenue I Unit I Birmingham, AL | 3.0 | 1.0 | 1140 | $1,200 | $1.05 | 3d | 1 | 0.85mi |
| 1532 Graymont Ave W Birmingham, AL | 4.0 | 2.0 | 1913 | $1,150 | $0.60 | 43d | 1 | 0.86mi |
| 820 17th Street Ensley Birmingham, AL | 3.0 | 2.0 | 1336 | $1,250 | $0.94 | 43d | 1 | 0.87mi |
| 1633 29th Street Ensley Birmingham, AL | 3.0 | 2.0 | 1658 | $1,200 | $0.72 | 43d | 1 | 0.88mi |
| 1521 27th Street Ensley Birmingham, AL | 3.0 | 2.0 | 1120 | $1,000 | $0.89 | 43d | 1 | 0.91mi |
| 811 17th Aly Birmingham, AL | 4.0 | 1.0 | 1146 | $1,050 | $0.92 | 10d | 1 | 0.91mi |
| 1545 29th Street Ensley Birmingham, AL | 3.0 | 1.5 | 1331 | $1,200 | $0.90 | 43d | 1 | 0.95mi |
Listing history 3 events
-
2026-05-09status Pending
-
2026-05-07$69,900 Active
-
1994-08-04soldstatus $31,689
ⓘ Source: listings_history table (triggers on properties + properties_extension) + one-shot
backfill from property_details.listing_events for pre-trigger history.
Tax reassessment forecast AL · Resets to sale price
- Current annual tax
- $1,393 · $116/mo
- Projected year-2 tax
- $1,393 · $116/mo
- Expected delta
- $0/yr ($0/mo · 0.0%)
ⓘ Screening estimate from a state-policy table — verify with the county assessor before closing.
Climate risk First Street
- Flood 1/10 Low FEMA zone X (unshaded) · 0% chance over 30 yrs
- Wildfire 1/10 Low
- Heat 6/10 Major 7 d/yr ≥106°F today · 18 d/yr by 30 yrs out
- Wind 6/10 Major 27% chance of damaging wind over 30 yrs
- Air quality 4/10 Moderate 5 unhealthy d/yr today · 5 by 30 yrs out
Nearby sold comps map
Loading sold comps map…
Walkable amenities ~0.75 mi
Loading nearby amenities…
Taxation est. · year 1
- Rental income
- $15,045
- − Mortgage interest
- −$3,915
- − Property taxes
- −$1,393
- − Insurance
- −$350
- − Repairs & maintenance
- −$1,204
- − Management
- −$1,204
- − Depreciation
- −$2,033
- Taxable income
- $4,946
- Est. tax owed @ 24.0%
- −$1,187
- After-tax cash flow
- $4,557/yr
For passive investors: Depreciation is non-cash, so a rental often shows a tax loss while cash-flowing — sheltering income. Rental losses are passive: they offset passive income freely, and up to $25,000/yr can offset ordinary (W-2) income if you actively participate and your MAGI is under $100k (phasing out to $0 by $150k); unused losses carry forward. On sale, claimed depreciation is recaptured at up to 25%, and gains may owe capital-gains tax (a 1031 exchange can defer both). Figures are a year-1 estimate at your 24.0% rate — not tax advice; consult a CPA.
Schools (NCES district)
- District
- Birmingham City
- NCES district ID
- 0100390
- Math proficiency
- 4% ▼ -17.00%
- Reading proficiency
- 20% ▼ -4.00%
- Median HH income
- $31,988
- Composite
- 9.49/100
- National rank
- #9850
- State rank
- #116 of 129 in AL
Livability — Birmingham
- Score
- 67/100
- State rank
- #78
- US rank
- #10412
Category grades
Schools grade is shown separately in the Schools card above.
Census & demographics
- Census place
- Birmingham, AL
- County
- Jefferson County · 527,445 people
- City population
- 210,422
- Metro
- Birmingham-Hoover, AL
- Population (ZIP)
- 6,981
- Household income
- $30,739
- Rent vs Own
- Severe rent burden
- 621.0
Population outlook (Jefferson County) Hauer SSP2
- Today (2025)
- 669,185 people
- By 2030
- 669,694 · +0.1%
- By 2040
- 661,388 · -1.2%
- By 2050
- 643,086 · -3.9%
- By 2075
- 577,267 · -13.7%
- By 2100
- 474,758 · -29.1%
Race, ethnicity, and origin ACS 2023
- Neighborhood character
- Predominantly Black (76%)
- Race & ethnicity
- Black 76% Two or more races 17% White 5% Hispanic / Latino 4%
- Foreign-born
- 2% · Canada, South Korea
- Languages at home
- 97% English-only · Spanish 1%
Political lean MEDSL · Jefferson
- 2024 margin
- D (+10.4) · D 54.6% · R 44.2% · Other 1.2%
- 2008→2024 swing
- +5.4pp toward D · 2008: 5.1pp · 2024: 10.4pp
- All cycles
- 2024: D+10.4 2020: D+13.2 2016: D+7.2 2012: D+6.0 2008: D+5.1
Not yet ingested
- Civics
- —
Market trends
- HPI YoY
- ▼ -1.54%
- Current HPI
- 170.4053
- Rent YoY
- —
- Metro
- Birmingham-Hoover, AL
- State GDP YoY
- ▲ 2.94%
- F500 in state
- 4
Industry mix (Fortune 500 HQ in AL)
| Industry | F500 HQs | Revenue |
|---|---|---|
| Financial Services | 1 | $8B |
|
||
| Healthcare | 1 | $5B |
|
||
Price history
+120.6% since first listed3 events — show timeline
- 2026-05-09 Pending — Greater Alabama MLS
- 2026-05-07 Listed $69,900 Greater Alabama MLS
- 1994-08-04 Sold (Public Records) $31,689 Public Records
Property tax history
+4.2%/yrLatest (2025): $1,393 · +0.0% YoY. Source: county tax records.
Cash-flow waterfall
monthlySold comps — $/sqft
last 12 mo · ≤1 miLoading sold comps…