1180 N Acadian Thwy · Baton Rouge, LA
Flood risk 1/10 · Minimal
- FEMA flood zone
- X (unshaded)
- Chance of flooding over 30 yrs
- 0.0%
- Est. flood insurance / yr
- $507 – $1,088
Fire risk 1/10 · Minimal
- Est. fire insurance / yr
- $1,269 – $2,357
Heat risk 8/10 · Major
- Hot days now (above 108°F)
- 7 days/yr
- Hot days in 30 yrs
- 20 days/yr
Wind risk 9/10 · Severe
- Chance of severe wind over 30 yrs
- 99.0%
Air-quality risk 2/10 · Minimal
- Unhealthy air days now
- 1 days/yr
- Unhealthy air days in 30 yrs
- 1 days/yr
Risk factors via First Street. Map © Google.
Why this score? — see what drove the D+ grade
The composite is a weighted blend of 9 inputs, each scored 0–100. Each bar is that input's sub-score; the figure is the points it added to the 100-point composite (weight × sub-score).
- Cash flow +18.8/30.0
- ARV discount +7.5/15.0
- DSCR +5.9/10.0
- Rent growth +4.1/5.0
- 1% rule +3.8/10.0
- Livability +3.7/5.0
- Condition / age +2.5/5.0
- Schools +2.4/10.0
- Appreciation +0.0/10.0
$135,000
🖨 Deal sheet 📄 Offer letter ✓ Due diligence
Listing remarks MLS
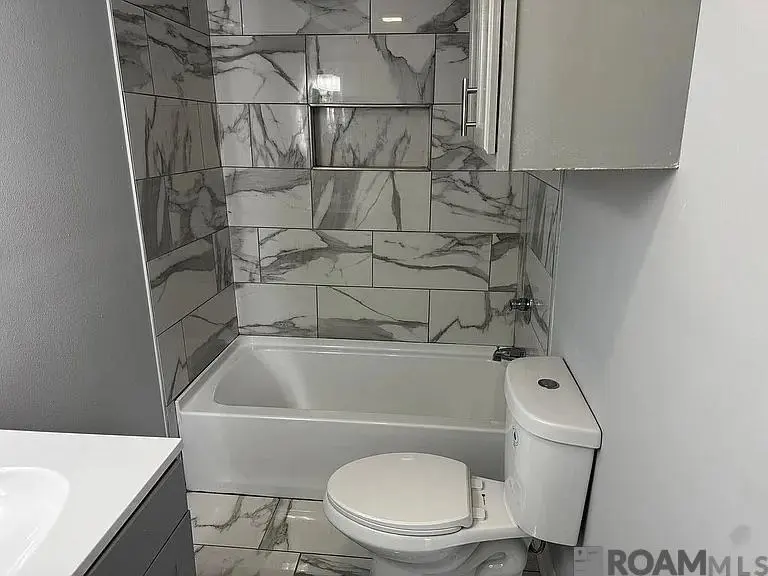
This 3 bedroom 2 bathroom home is fantasticly remodeled
Key facts
- 3,484 sq ft lot
- 2 parking spots
- Built 1960
Property features AI
Finance
- Other: Subdivision: Eden Park; Directions: From I-10 East, right on N. Acadian Thwy, pass Florida and property is on the right
Exterior
- Parking: 2 parking spaces
- Utilities: Public water; Public sewer
- Home design: Detached single-family residence; Residential property
- Construction: Brick construction; Slab foundation; Built on a slab
- Exterior features: Public water; Public sewer; Lot approximately 34 x 101 (0.08 acres)
Interior
- Bathrooms: 2 full bathrooms
- Heating & cooling: Central heating; Central air conditioning
- Interior features: Central heating; Central air conditioning
Neighborhood map
What this means for you Summary
Snapshot
- This is a 3-bed/2.0-bath single-family listed at $135k.
Deal economics
- At list price, monthly cash flow is $136 ($2k/yr) — positive.
- The deal already cash-flows at list — no discount required.
- To meet the 1% rule (rent ≥ 1% of price), the offer needs to be $118k (12.3% below list).
- Recommended offer: $118k (12.3% below list) — sets the bar for 1% rule.
- Cap rate 7.5% vs local median 4.3% in Baton Rouge — top-decile yield for the area; either an underpriced asset or a hidden risk that comps aren't pricing in. Stress-test before assuming the spread holds.
Location & tenants
- Location reads 74/100 on livability (#24 in LA, #4,535 nationally) — a middle-class / working-renter tenant base. Strengths: commute A+, cost of living A+, health & safety A+; Watch: amenities D, crime F, employment D-.
- East Baton Rouge Parish (urban): math 22% / reading 34% proficiency, ranked #47 of 98 in LA (top 48%) — low school quality limits family demand, transient renter base, plan for 1-2y turnover; 77% free/reduced lunch — lower-income household profile, screen leases tightly.
- Market conditions: Rents rising fast (+6.6%/yr); 188 active listings in the ZIP; 37 comparable units currently listed for rent nearby; rentals at typical pace (median 24d on market — plan ~3-4 weeks tenant-placement turnaround); lower-income renter base — watch delinquency; 2,252 units permitted in East Baton Rouge Parish in 2024 (440 in 5+ unit buildings).
- This rent runs 41% of the median local income ($34k/yr) — at the standard rent-burdened threshold; future hikes will face affordability resistance.
Forward outlook
- Local home prices are declining (-3.0%/yr); year-one equity from $933 of loan paydown is wiped out by about $4k of value loss. Plan a longer hold.
- East Baton Rouge County population projected at +4% by 2050 — modest demand growth; plan on rents tracking national, not racing it.
Negotiation context
- It's been on market 45 days — a 3% lower offer ($131k) is reasonable based on typical stale-listing flexibility.
- 5 sale attempts with the ask held roughly flat each time — persistent listings suggest the price (not the market) is what's stuck; bring a comps-based counter.
Risks & watch-outs
- Climate carrying-cost: severe wind risk, 99% chance of damaging wind over 30y; extreme-heat days projected 7→20/yr by 2055 (HVAC capex compounding) — expect insurance premiums to compound above CPI over the hold.
Questions for the listing agent
- It's been on market 45 days. Have you received any prior offers? Is the seller open to a 12% concession, seller financing, or rate buy-down credit?
- Built in 1960 — when were the roof, HVAC, electrical panel, plumbing, and water heater last replaced?
- Is there a deadline driving the sale (1031 exchange, divorce, estate, relocation)? That informs how much negotiation room exists.
- Crime grade is F in this area — have there been break-ins, vandalism, or insurance claims at this property in the last 3 years? What carrier currently insures it and at what premium?
- The area grade is low — what's the realistic commute time and amenity access for the typical tenant pool here? Any planned neighborhood developments (good or bad) we should know about?
- What's the average days-on-market for RENTAL listings here right now (not sales)? A rising rental-DOM trend means longer vacancies and softer asking-rent achievability than the comps imply.
- What's the recent tenant-quality profile in this submarket — average credit score on applications, eviction rate, late-payment / NSF rate, and stable-employment percentage? A property-management company in the area should have these aggregated.
- How much new for-sale + rental construction is in the pipeline within 1–3 miles? Heavy new supply typically softens prices + rents 12–24 months out; constrained supply supports both.
Investment metrics
- 1% rule
- 0.88% ✗
- Cap rate
- 7.50%
- Cash-on-cash
- 4.30%
- DSCR
- 1.19
- GRM
- 9.5
CMA / ARV
- ARV (median comp)
- $39,012
- List price
- $135,000
- Delta
- 246.05%
- Verdict
- OVERPRICED
- Comps
- 20 within 1.0 mi
Show comp detail 12 sales within ~0.75 mi
| Address | Dist | Beds/Ba | Sqft | Sold | Price | $/sf | Match |
|---|---|---|---|---|---|---|---|
| 760 N 29th St | 0.36mi | 2/1.5 (-1) | 1,135 (-2%) | 1mo | $105,000 | $93 | 73 |
| 716 N 36th St | 0.31mi | 3/2.0 | 1,100 (-4%) | 8mo | $49,000 | $45 | 72 |
| 2812 North St | 0.50mi | 3/2.0 | 1,152 (0%) | 8mo | $140,000 | $122 | 70 |
| 3825 Fairfields Ave | 0.60mi | 3/1.0 | 1,152 (0%) | 0mo | $125,000 | $109 | 68 |
| 1152 N 32nd St | 0.09mi | 2/1.0 (-1) | 1,000 (-13%) | 2mo | $12,500 | $13 | 63 |
| 3420 Main St | 0.46mi | 2/1.0 (-1) | 1,118 (-3%) | 6mo | $54,500 | $49 | 60 |
| 2711 Jackson Ave | 0.63mi | 3/2.0 | 1,200 (+4%) | 7mo | $79,000 | $66 | 58 |
| 421 N 24th St | 0.75mi | 3/2.0 | 1,197 (+4%) | 1mo | $190,000 | $159 | 58 |
| 4366 Jefferson Ave | 0.66mi | 3/1.0 | 1,200 (+4%) | 2mo | $49,900 | $42 | 57 |
| 1108 N Acadian Thruway | 0.08mi | 2/5.5 (-1) | 1,000 (-13%) | 2mo | $13,100 | $13 | 54 |
| 2645 Jefferson Ave | 0.56mi | 2/1.0 (-1) | 1,123 (-2%) | 8mo | $9,750 | $9 | 54 |
| 4051 N Barrow Dr | 0.62mi | 3/2.0 | 1,040 (-10%) | 5mo | $175,000 | $168 | 51 |
Match score weights: distance 35% · size 25% · config 20% · recency 20%. Top-matched comps best support the ARV.
Projected returns pro-forma
-3.0% appreciation · 6.59% rent growth · sell at horizon
- IRR
- -6.1%
- Equity multiple
- 0.77×
- Total profit
- $-8,873
- Equity at exit
- $20,129
- IRR
- 7.0%
- Equity multiple
- 1.60×
- Total profit
- $22,715
- Equity at exit
- $11,672
Cash invested: $37,800 (down + closing). Projections, not guarantees.
Landlord ↔ Tenant lean methodology
- Overall (STATE)
- 90 Strongly Landlord-Friendly
- State Louisiana
- 90 Strongly Landlord-Friendly · R+12
- County
- — inherits STATE
- City
- — inherits STATE
ZIP-level market 70802
- Rents YoY
- 6.6%
- Active inventory
- 188
- Price-to-rent
- 9.5×
Monthly cashflow live
- Estimated rent
- $1,184 high interval (Pro) →
- Mortgage (P&I)
- −$708
- Tax from tax record
- −$36 /mo · $431/yr
- Insurance
- −$56
- HOA
- −$0
- Vacancy / Maint / Mgmt
- −$249
- Net cashflow
- $136
Break-even live
Sensitivity live
| Price | -10% $212 | -5% $174 | +0% $136 | +5% $97 | +10% $59 |
|---|---|---|---|---|---|
| Rent | -10% $42 | -5% $89 | +0% $136 | +5% $182 | +10% $229 |
| Rate | -1.0pp $204 | -0.5pp $170 | base $136 | +0.5pp $101 | +1.0pp $65 |
UW: 25.0% down · 7.5% · 30yr · 1.5% tax · 5.0% vac · 8.0% maint · 8.0% mgmt
Financing live
Cash to close
- Down payment
- $33,750
- Closing costs
- $4,050
- Reserves months
- —
- Total cash needed
- —
Loan-product check · same deal, 3 products live
Conventional
25% down · 7.5% · 30yr
- Down + closing
- —
- Monthly P&I
- —
- Monthly cashflow
- —
- DSCR
- —
- Eligible?
- —
Personal DTI + credit; lowest rate.
DSCR
20% down · 8.5% · 30yr
- Down + closing
- —
- Monthly P&I
- —
- Monthly cashflow
- —
- DSCR
- —
- Eligible?
- —
No personal income docs; deal must DSCR.
Hard money
10% down · 12.0% · 12mo
- Down + closing
- —
- Monthly P&I
- —
- Monthly cashflow
- —
- DSCR
- —
- Eligible?
- —
Short-term bridge; refi at stabilization.
Rent comps 37 comps
| Address | Beds | Baths | Sqft | Rent | $/sqft | DOM | Units | Dist |
|---|---|---|---|---|---|---|---|---|
| 1409 N 35th St Baton Rouge, LA | 3.0 | 2.0 | 912 | $750 | $0.82 | 24d | 1 | 0.15mi |
| 1348 N 37th St Baton Rouge, LA | 3.0 | 1.0 | 1100 | $1,200 | $1.09 | 44d | 1 | 0.19mi |
| 1305 N 30th St Baton Rouge, LA | 2.0 | 1.0 | 1000 | $900 | $0.90 | 24d | 1 | 0.28mi |
| 1336 N 29th St Baton Rouge, LA | 3.0 | 2.0 | 1400 | $1,450 | $1.04 | 14d | 1 | 0.30mi |
| 1404 N 29th St Baton Rouge, LA | 3.0 | 2.0 | 1120 | $1,100 | $0.98 | 44d | 1 | 0.31mi |
| 3566 North St Baton Rouge, LA | 4.0 | 2.0 | 1117 | $1,050 | $0.94 | 21d | 1 | 0.40mi |
| 636 N 39th St Apt 2 Baton Rouge, LA | 2.0 | 1.0 | 700 | $900 | $1.29 | 14d | 1 | 0.42mi |
| 532 Live Oak Blvd Unit 532 Baton Rouge, LA | 3.0 | 2.0 | 1000 | $1,200 | $1.20 | 24d | 1 | 0.55mi |
| 1217 N 44th St Baton Rouge, LA | 3.0 | 2.0 | 1028 | $950 | $0.92 | 24d | 1 | 0.57mi |
| 2730 Convention St Baton Rouge, LA | 3.0 | 1.0 | 1000 | $900 | $0.90 | 24d | 1 | 0.77mi |
| 787 N 47th St Baton Rouge, LA | 3.0 | 2.0 | 1000 | $800 | $0.80 | 24d | 1 | 0.77mi |
| 2347 Rhodes Ave Baton Rouge, LA | 2.0 | 1.0 | 1250 | $950 | $0.76 | 19d | 1 | 0.81mi |
| 2040 Gayosa St Baton Rouge, LA | 1.0–2.0 | 1.0–2.0 | 764 | $1,250 | $1.64 | 44d | 1 | 0.83mi |
| 239 West Dr Baton Rouge, LA | 2.0 | 1.0 | 1428 | $1,250 | $0.88 | 24d | 1 | 0.86mi |
| 1201 N Foster Dr Baton Rouge, LA | 1.0–3.0 | 1.0–3.0 | 1300 | $1,688 | $1.30 | 14d | 31 | 0.88mi |
| 4743 Florida Blvd Baton Rouge, LA | 2.0 | 1.0 | 947 | $789 | $0.83 | 14d | 3 | 0.93mi |
| 330 Ingleside Dr Baton Rouge, LA | 1.0–3.0 | 1.0–2.0 | 773 | $1,353 | $1.75 | 14d | 6 | 1.05mi |
| 3936 Dalton St Baton Rouge, LA | 2.0 | 1.0 | 900 | $750 | $0.83 | 19d | 1 | 1.06mi |
| 422 Glenmore Ave Baton Rouge, LA | 3.0 | 2.0 | 1307 | $1,700 | $1.30 | 24d | 1 | 1.08mi |
| 3711 Cole Dr #3 Baton Rouge, LA | 2.0 | 1.5 | 1200 | $1,200 | $1.00 | 44d | 1 | 1.08mi |
| 3859 Brady St Baton Rouge, LA | 2.0 | 1.0 | 800 | $775 | $0.97 | 44d | 1 | 1.12mi |
| 623 S Eugene St Unit 1 Baton Rouge, LA | 2.0 | 1.0 | 980 | $1,400 | $1.43 | 44d | 1 | 1.13mi |
| 303 S 21st St Baton Rouge, LA | 3.0 | 1.0 | 1070 | $825 | $0.77 | 44d | 1 | 1.16mi |
| 1847 N 16th St Baton Rouge, LA | 3.0 | 2.0 | 909 | $1,250 | $1.38 | 14d | 1 | 1.18mi |
| 5212 Jackson Ave Baton Rouge, LA | 4.0 | 2.0 | 1500 | $1,650 | $1.10 | 24d | 1 | 1.21mi |
| 605 Ingleside Dr Unit A Baton Rouge, LA | 2.0 | 1.0 | 700 | $1,350 | $1.93 | 44d | 1 | 1.22mi |
| 352 S Foster Dr Baton Rouge, LA | 1.0–2.0 | 1.0–2.0 | 987 | $1,475 | $1.49 | 14d | 2 | 1.23mi |
| 878 Kenmore Ave Unit C Baton Rouge, LA | 2.0 | 1.0 | 1100 | $1,000 | $0.91 | 21d | 1 | 1.28mi |
| 866 Arlington Ave Unit 206 Baton Rouge, LA | 2.0 | 1.0 | 950 | $895 | $0.94 | 44d | 1 | 1.29mi |
| 1346 Main St Unit A Baton Rouge, LA | 3.0 | 2.0 | 1200 | $1,600 | $1.33 | 44d | 1 | 1.32mi |
| 925 Rittiner Dr Unit 927 Baton Rouge, LA | 3.0 | 1.0 | 1147 | $1,250 | $1.09 | 44d | 1 | 1.37mi |
| 1035 Rittiner Dr Baton Rouge, LA | 3.0 | 1.0 | 1145 | $1,200 | $1.05 | 14d | 1 | 1.42mi |
| 710 Park Blvd #6 Baton Rouge, LA | 2.0 | 1.0 | 1111 | $1,800 | $1.62 | 14d | 1 | 1.45mi |
| 373 Community College Dr Unit 302 Baton Rouge, LA | 4.0 | 2.0 | 1300 | $1,100 | $0.85 | 44d | 1 | 1.46mi |
| 373 Community College Dr Unit 206 Baton Rouge, LA | 4.0 | 2.0 | 1300 | $1,200 | $0.92 | 44d | 1 | 1.46mi |
| 718 Park Blvd Unit 1 Baton Rouge, LA | 2.0 | 1.0 | 1189 | $1,500 | $1.26 | 24d | 1 | 1.47mi |
| 1251 N Ardenwood Dr Baton Rouge, LA | 1.0–3.0 | 1.0–2.0 | 923 | $999 | $1.08 | 44d | 1 | 1.47mi |
Listing history 22 events
-
2026-06-18days on market $135,000 Active 45 DOM
-
2026-06-17days on market $135,000 Active 44 DOM
-
2026-06-16days on market $135,000 Active 43 DOM
-
2026-06-15days on market $135,000 Active 42 DOM
-
2026-06-14days on market $135,000 Active 40 DOM
-
2026-06-10days on market $135,000 Active 37 DOM
-
2026-06-09days on market $135,000 Active 36 DOM
-
2026-06-08days on market $135,000 Active 35 DOM
-
2026-06-07days on market $135,000 Active 34 DOM
-
2026-06-05days on market $135,000 Active 31 DOM
-
2026-06-03days on market $135,000 Active 30 DOM
-
2026-06-02days on market $135,000 Active 29 DOM
-
2026-06-01days on market $135,000 Active 28 DOM
-
2026-05-31days on market $135,000 Active 27 DOM
-
2026-05-31days on market $135,000 Active 26 DOM
-
2026-04-29$135,000 Active 55-char remark
Show marketing remark (55 chars)
This 3 bedroom 2 bathroom home is fantasticly remodeled
-
2026-04-29$135,000 Active 55-char remark
Show marketing remark (55 chars)
This 3 bedroom 2 bathroom home is fantasticly remodeled
-
2025-09-16soldstatus Closed
-
2025-09-05status Pending
-
2025-08-27$28,000 Active
-
2025-08-27$28,000 Active
-
2025-08-27$28,000
ⓘ Source: listings_history table (triggers on properties + properties_extension) + one-shot
backfill from property_details.listing_events for pre-trigger history.
Tax reassessment forecast LA · Resets to sale price
- Current annual tax
- $431 · $36/mo
- Projected year-2 tax
- $742 · $62/mo
- Expected delta
- +$311/yr (+$26/mo · 72.3%)
ⓘ Screening estimate from a state-policy table — verify with the county assessor before closing.
Climate risk First Street
- Flood 1/10 Low FEMA zone X (unshaded) · 0% chance over 30 yrs
- Wildfire 1/10 Low
- Heat 8/10 Severe 7 d/yr ≥108°F today · 20 d/yr by 30 yrs out
- Wind 9/10 Extreme 99% chance of damaging wind over 30 yrs
- Air quality 2/10 Low 1 unhealthy d/yr today · 1 by 30 yrs out
Nearby sold comps map
Loading sold comps map…
Walkable amenities ~0.75 mi
Loading nearby amenities…
Taxation est. · year 1
- Rental income
- $14,213
- − Mortgage interest
- −$7,562
- − Property taxes
- −$431
- − Insurance
- −$675
- − Repairs & maintenance
- −$1,137
- − Management
- −$1,137
- − Depreciation
- −$3,927
- Taxable loss
- −$657
- Est. tax savings @ 24.0%
- +$158
- After-tax cash flow
- $1,784/yr
For passive investors: Depreciation is non-cash, so a rental often shows a tax loss while cash-flowing — sheltering income. Rental losses are passive: they offset passive income freely, and up to $25,000/yr can offset ordinary (W-2) income if you actively participate and your MAGI is under $100k (phasing out to $0 by $150k); unused losses carry forward. On sale, claimed depreciation is recaptured at up to 25%, and gains may owe capital-gains tax (a 1031 exchange can defer both). Figures are a year-1 estimate at your 24.0% rate — not tax advice; consult a CPA.
Schools (NCES district)
- District
- East Baton Rouge Parish
- NCES district ID
- 2200540
- Math proficiency
- 22% ▼ -36.00%
- Reading proficiency
- 34% ▼ -31.00%
- Median HH income
- $46,263
- Composite
- 24.14/100
- National rank
- #7745
- State rank
- #47 of 98 in LA
Livability — Baton Rouge
- Score
- 74/100
- State rank
- #24
- US rank
- #4535
Category grades
Schools grade is shown separately in the Schools card above.
Census & demographics
- Census place
- Baton Rouge, LA
- County
- East Baton Rouge Parish · 399,686 people
- City population
- 351,868
- Metro
- Baton Rouge, LA
- Population (ZIP)
- 25,118
- Household income
- $34,458
- Rent vs Own
- Severe rent burden
- 1831.0
Population outlook (East Baton Rouge County) Hauer SSP2
- Today (2025)
- 464,810 people
- By 2030
- 472,137 · +1.6%
- By 2040
- 480,243 · +3.3%
- By 2050
- 484,422 · +4.2%
- By 2075
- 492,069 · +5.9%
- By 2100
- 476,347 · +2.5%
Race, ethnicity, and origin ACS 2023
- Neighborhood character
- Predominantly Black (69%)
- Race & ethnicity
- Black 69% White 20% Two or more races 5% Hispanic / Latino 5% Asian 3%
- Common ancestry
- Lithuanian 2% Italian 1% Iranian 0%
- Foreign-born
- 6% · Canada, Vietnam
- Languages at home
- 91% English-only · Spanish 3% Tagalog/Filipino 1% Other Indo-European 1%
Political lean MEDSL · East Baton Rouge
- 2024 margin
- D (+11.1) · D 54.5% · R 43.4% · Other 2.1%
- 2008→2024 swing
- +8.9pp toward D · 2008: 2.2pp · 2024: 11.1pp
- All cycles
- 2024: D+11.1 2020: D+13.1 2016: D+9.2 2012: D+5.2 2008: D+2.2
Not yet ingested
- Civics
- —
Market trends
- HPI YoY
- ▼ -137.02%
- Current HPI
- 47.7285
- Rent YoY
- ▲ 6.59%
- Metro
- Baton Rouge, LA
- State GDP YoY
- ▲ 3.29%
- F500 in state
- 10
Industry mix (Fortune 500 HQ in LA)
| Industry | F500 HQs | Revenue |
|---|---|---|
| Telecommunications | 2 | $23B |
|
||
| Utilities | 1 | $12B |
|
||
| Wholesale / Distribution | 1 | $5B |
|
||
| Advertising | 1 | $2B |
|
||
Price history
+382.1% since first listed7 events — show timeline
- 2026-04-29 Listed $135,000 GBRMLS
- 2026-04-29 Listed $135,000 AcadianaMLS
- 2025-09-16 Sold (MLS) — GBRMLS
- 2025-09-05 Pending — GBRMLS
- 2025-08-27 Listed $28,000 GBRMLS
- 2025-08-27 Listed $28,000 AcadianaMLS
- 2025-08-27 Listed $28,000 AcadianaMLS
Property tax history
+23.0%/yrLatest (2025): $431 · +4.7% YoY. Source: county tax records.
Cash-flow waterfall
monthlySold comps — $/sqft
last 12 mo · ≤1 miLoading sold comps…