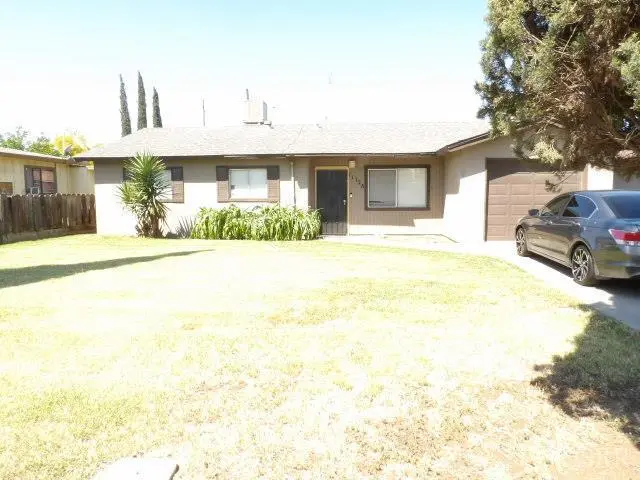
11128 San Madina Dr · Hanford, CA
Flood risk 4/10 · Minor
- FEMA flood zone
- X (unshaded)
- Chance of flooding over 30 yrs
- 0.24%
- Est. flood insurance / yr
- $507 – $1,088
Fire risk 5/10 · Moderate
- Est. fire insurance / yr
- $659 – $1,223
Heat risk 8/10 · Major
- Hot days now (above 105°F)
- 7 days/yr
- Hot days in 30 yrs
- 17 days/yr
Wind risk 1/10 · Minimal
- Chance of severe wind over 30 yrs
- —
Air-quality risk 10/10 · Severe
- Unhealthy air days now
- 31 days/yr
- Unhealthy air days in 30 yrs
- 35 days/yr
Risk factors via First Street. Map © Google.
Why this score? — see what drove the D+ grade
The composite is a weighted blend of 9 inputs, each scored 0–100. Each bar is that input's sub-score; the figure is the points it added to the 100-point composite (weight × sub-score).
- ARV discount +15.0/15.0
- Cash flow +14.2/30.0
- DSCR +4.3/10.0
- Livability +3.8/5.0
- Schools +3.6/10.0
- Rent growth +3.2/5.0
- 1% rule +2.7/10.0
- Condition / age +2.5/5.0
- Appreciation +0.0/10.0
$265,000
🖨 Deal sheet (PDF) 📄 Offer letter ✓ Due diligence
Listing remarks
Welcome home to comfort and simplicity in this charming entry-level property! Offering 1,164 square feet of well-designed living space, this home is perfect for first-time buyers or anyone looking to downsize. Step inside to a cozy living area centered around a warm fireplaceideal for relaxing evenings or hosting friends. The layout flows easily into the dining and kitchen spaces, creating a functional and inviting atmosphere. Enjoy outdoor living with a covered patio, perfect for morning coffee, weekend barbecues, or unwinding after a long day. The home also features a convenient one-car garage, providing secure parking and extra storage. With its manageable size, thoughtful features, and
Key facts
- One-car garage
- Cozy living area
- Covered patio
Tags
Property features AI
Exterior
- Parking: Attached garage (1 car); Driveway; On-street parking
- Security: Smoke detectors
- Utilities: Public water; Public sewer
- Home design: Single-family residence; Single-story
- Construction: Stucco exterior; Composition roof; Concrete perimeter foundation; Built on a 0.1584-acre lot; Zoned R16
- Exterior features: Covered patio; Patio; Wood fencing; Paved road frontage on a city street
Interior
- Kitchen: Gas oven; Gas range
- Flooring: Laminate
- Bathrooms: 1 full bathroom; 1 half bathroom
- Heating & cooling: Evaporative cooling
- Interior features: Gas water heater; Gas oven; Gas range; Laminate flooring; No basement
- Laundry & utility: Laundry area in the garage
Neighborhood map
What this means for you Summary
Snapshot
- This is a 3-bed/2.0-bath single-family listed at $265k.
Deal economics
- At list price, monthly cash flow is $43 ($516/yr) — positive.
- The deal already cash-flows at list — no discount required.
- To meet the 1% rule (rent ≥ 1% of price), the offer needs to be $203k (23.4% below list).
- Recommended offer: $203k (23.4% below list) — sets the bar for 1% rule.
- Cap rate 6.5% vs local median 3.9% in Hanford — top-decile yield for the area; either an underpriced asset or a hidden risk that comps aren't pricing in. Stress-test before assuming the spread holds.
Location & tenants
- Location reads 75/100 on livability (#121 in CA, #4,255 nationally) — a middle-class / working-renter tenant base. Strengths: commute A+, housing A+, amenities B; Watch: crime D+, health & safety D+, cost of living F.
- Hanford Joint Union High (urban): math 20% / reading 58% proficiency, ranked #765 of 1,400 in CA (top 55%) — families likely to look elsewhere, expect single-tenant / working-renter base with shorter leases.
- Market conditions: Rents rising (+2.9%/yr); 430 active listings in the ZIP; 8 comparable units currently listed for rent nearby; rentals at typical pace (median 22d on market — plan ~3-4 weeks tenant-placement turnaround); solid renter incomes; 741 units permitted in Kings County in 2024 (307 in 5+ unit buildings).
- This rent runs 32% of the median local income ($76k/yr) — at the standard rent-burdened threshold; future hikes will face affordability resistance.
Forward outlook
- Local home prices are declining (-3.0%/yr); year-one equity from $2k of loan paydown is wiped out by about $8k of value loss. Plan a longer hold.
Negotiation context
- It's been on market 51 days — a 3% lower offer ($257k) is reasonable based on typical stale-listing flexibility.
Risks & watch-outs
- Climate carrying-cost: moderate wildfire risk; extreme-heat days projected 7→17/yr by 2055 (HVAC capex compounding) — expect insurance premiums to compound above CPI over the hold.
Questions for the listing agent
- It's been on market 51 days. Have you received any prior offers? Is the seller open to a 23% concession, seller financing, or rate buy-down credit?
- Built in 1960 — when were the roof, HVAC, electrical panel, plumbing, and water heater last replaced?
- Is there a deadline driving the sale (1031 exchange, divorce, estate, relocation)? That informs how much negotiation room exists.
- Crime grade is D in this area — have there been break-ins, vandalism, or insurance claims at this property in the last 3 years? What carrier currently insures it and at what premium?
- The area grade is low — what's the realistic commute time and amenity access for the typical tenant pool here? Any planned neighborhood developments (good or bad) we should know about?
- What's the average days-on-market for RENTAL listings here right now (not sales)? A rising rental-DOM trend means longer vacancies and softer asking-rent achievability than the comps imply.
- What's the recent tenant-quality profile in this submarket — average credit score on applications, eviction rate, late-payment / NSF rate, and stable-employment percentage? A property-management company in the area should have these aggregated.
- How much new for-sale + rental construction is in the pipeline within 1–3 miles? Heavy new supply typically softens prices + rents 12–24 months out; constrained supply supports both.
Investment metrics
- 1% rule
- 0.77% ✗
- Cap rate
- 6.49%
- Cash-on-cash
- 0.69%
- DSCR
- 1.03
- GRM
- 10.9
CMA / ARV
- ARV (on-the-fly)
- $331,776
- Comps found
- 12
Show comp detail 12 sales within ~0.75 mi
| Address | Dist | Beds/Ba | Sqft | Sold | Price | $/sf | Match |
|---|---|---|---|---|---|---|---|
| 10902 San Madina Dr | 0.08mi | 3/2.0 | 1,188 (+3%) | 3mo | $290,000 | $244 | 89 |
| 1035 Michelle Ct | 0.16mi | 3/2.0 | 1,182 (+3%) | 0mo | $325,000 | $275 | 88 |
| 821 S 11th | 0.24mi | 3/2.0 | 1,213 (+5%) | 2mo | $185,000 | $153 | 79 |
| 1003 Edison Dr | 0.34mi | 3/2.0 | 1,114 (-3%) | 1mo | $320,000 | $287 | 77 |
| 1035 1035 Olive Court Ct | 0.46mi | 3/2.0 | 1,147 (-0%) | 0mo | $310,000 | $270 | 77 |
| 901 S 11th | 0.23mi | 3/1.0 | 1,104 (-4%) | 2mo | $185,000 | $168 | 77 |
| 1064 S Anacapa Ave | 0.34mi | 3/2.0 | 1,075 (-7%) | 1mo | $310,000 | $288 | 72 |
| 1171 State St | 0.45mi | 3/2.0 | 1,100 (-4%) | 1mo | $317,000 | $288 | 70 |
| 1078 Buena Vista Ln | 0.46mi | 3/2.5 | 1,109 (-4%) | 2mo | $356,000 | $321 | 69 |
| 10955 Abby Ln | 0.48mi | 3/3.0 | 1,189 (+3%) | 1mo | $355,000 | $299 | 68 |
| 639 Kimball Ln | 0.56mi | 3/2.0 | 1,011 (-12%) | 3mo | $350,000 | $346 | 51 |
| 1406 Bengston Ave | 0.75mi | 3/2.0 | 1,008 (-12%) | 1mo | $308,000 | $306 | 44 |
Match score weights: distance 35% · size 25% · config 20% · recency 20%. Top-matched comps best support the ARV.
Projected returns pro-forma
-3.0% appreciation · 2.87% rent growth · sell at horizon
- IRR
- -15.4%
- Equity multiple
- 0.45×
- Total profit
- $-40,606
- Equity at exit
- $39,512
- IRR
- -7.2%
- Equity multiple
- 0.55×
- Total profit
- $-33,474
- Equity at exit
- $22,912
Cash invested: $74,200 (down + closing). Projections, not guarantees.
Landlord ↔ Tenant lean methodology
- Overall (STATE)
- 18 Strongly Tenant-Friendly
- State California
- 18 Strongly Tenant-Friendly · D+13
- County
- — inherits STATE
- City
- — inherits STATE
ZIP-level market 93230
- Rents YoY
- 2.9%
- Active inventory
- 430
- Price-to-rent
- 10.9×
Monthly cashflow live
- Estimated rent
- $2,029 high interval (Pro) →
- Mortgage (P&I)
- −$1,390
- Tax from tax record
- −$60 /mo · $714/yr
- Insurance
- −$110
- HOA
- −$0
- Vacancy / Maint / Mgmt
- −$426
- Net cashflow
- $43
Break-even live
Sensitivity live
| Price | -10% $193 | -5% $118 | +0% $43 | +5% $-32 | +10% $-107 |
|---|---|---|---|---|---|
| Rent | -10% $-117 | -5% $-37 | +0% $43 | +5% $123 | +10% $203 |
| Rate | -1.0pp $176 | -0.5pp $110 | base $43 | +0.5pp $-26 | +1.0pp $-96 |
UW: 25.0% down · 7.5% · 30yr · 1.5% tax · 5.0% vac · 8.0% maint · 8.0% mgmt
Financing live
Cash to close
- Down payment
- $66,250
- Closing costs
- $7,950
- Reserves months
- —
- Total cash needed
- —
Loan-product check · same deal, 3 products live
Conventional
25% down · 7.5% · 30yr
- Down + closing
- —
- Monthly P&I
- —
- Monthly cashflow
- —
- DSCR
- —
- Eligible?
- —
Personal DTI + credit; lowest rate.
DSCR
20% down · 8.5% · 30yr
- Down + closing
- —
- Monthly P&I
- —
- Monthly cashflow
- —
- DSCR
- —
- Eligible?
- —
No personal income docs; deal must DSCR.
Hard money
10% down · 12.0% · 12mo
- Down + closing
- —
- Monthly P&I
- —
- Monthly cashflow
- —
- DSCR
- —
- Eligible?
- —
Short-term bridge; refi at stabilization.
Rent comps 8 comps
| Address | Beds | Baths | Sqft | Rent | $/sqft | DOM | Units | Dist |
|---|---|---|---|---|---|---|---|---|
| 1078 Buena Vista Ln Hanford, CA | 3.0 | 2.5 | 1301 | $2,200 | $1.69 | 22d | 1 | 0.45mi |
| 824 S Irwin St Hanford, CA | 2.0 | 1.0 | 700 | $1,395 | $1.99 | 14d | 1 | 0.49mi |
| 11116 Kay Ln Hanford, CA | 3.0 | 1.0 | 1008 | $1,700 | $1.69 | 22d | 1 | 0.51mi |
| 994 S Harris St Hanford, CA | 3.0 | 2.0 | 1278 | $1,650 | $1.29 | 14d | 1 | 0.63mi |
| 1604 Sidonia St Hanford, CA | 3.0 | 2.0 | 1443 | $2,200 | $1.52 | 22d | 1 | 1.00mi |
| 1296 Sparrow Dr Hanford, CA | 3.0 | 1.5 | 1443 | $2,300 | $1.59 | 14d | 1 | 1.05mi |
| 412 Ford St Unit 2 Hanford, CA | 2.0 | 1.0 | 725 | $1,150 | $1.59 | 22d | 1 | 1.20mi |
| 201 E 11th St Unit C Hanford, CA | 2.0 | 1.0 | 700 | $1,295 | $1.85 | 22d | 1 | 1.42mi |
Listing history 18 events
-
2026-06-19days on market $265,000 Active 51 DOM
-
2026-06-18days on market $265,000 Active 50 DOM
-
2026-06-17days on market $265,000 Active 49 DOM
-
2026-06-16days on market $265,000 Active 48 DOM
-
2026-06-15days on market $265,000 Active 47 DOM
-
2026-06-14days on market $265,000 Active 45 DOM
-
2026-06-13days on market $265,000 Active 44 DOM
-
2026-06-10days on market $265,000 Active 42 DOM
-
2026-06-09days on market $265,000 Active 41 DOM
-
2026-06-08days on market $265,000 Active 40 DOM
-
2026-06-07days on market $265,000 Active 39 DOM
-
2026-06-05days on market $265,000 Active 36 DOM
-
2026-06-03days on market $265,000 Active 35 DOM
-
2026-06-02days on market $265,000 Active 34 DOM
-
2026-06-01days on market $265,000 Active 33 DOM
-
2026-05-31days on market $265,000 Active 32 DOM
-
2026-05-30days on market $265,000 Active 31 DOM
-
2026-04-28$265,000 Active
ⓘ Source: listings_history table (triggers on properties + properties_extension) + one-shot
backfill from property_details.listing_events for pre-trigger history.
Tax reassessment forecast CA · Resets to sale price
- Current annual tax
- $714 · $60/mo
- Projected year-2 tax
- $2,014 · $168/mo
- Expected delta
- +$1,300/yr (+$108/mo · 182.0%)
ⓘ Screening estimate from a state-policy table — verify with the county assessor before closing.
Climate risk First Street
- Flood 4/10 Moderate FEMA zone X (unshaded) · 24% chance over 30 yrs
- Wildfire 5/10 Major
- Heat 8/10 Severe 7 d/yr ≥105°F today · 17 d/yr by 30 yrs out
- Wind 1/10 Low
- Air quality 10/10 Extreme 31 unhealthy d/yr today · 35 by 30 yrs out
Nearby sold comps map
Loading sold comps map…
Walkable amenities ~0.75 mi
Loading nearby amenities…
Taxation est. · year 1
- Rental income
- $24,343
- − Mortgage interest
- −$14,844
- − Property taxes
- −$714
- − Insurance
- −$1,325
- − Repairs & maintenance
- −$1,947
- − Management
- −$1,947
- − Depreciation
- −$7,709
- Taxable loss
- −$4,144
- Est. tax savings @ 24.0%
- +$995
- After-tax cash flow
- $1,510/yr
For passive investors: Depreciation is non-cash, so a rental often shows a tax loss while cash-flowing — sheltering income. Rental losses are passive: they offset passive income freely, and up to $25,000/yr can offset ordinary (W-2) income if you actively participate and your MAGI is under $100k (phasing out to $0 by $150k); unused losses carry forward. On sale, claimed depreciation is recaptured at up to 25%, and gains may owe capital-gains tax (a 1031 exchange can defer both). Figures are a year-1 estimate at your 24.0% rate — not tax advice; consult a CPA.
Schools (NCES district)
- District
- Hanford Joint Union High
- NCES district ID
- 0616500
- Math proficiency
- 20% ▲ 1.00%
- Reading proficiency
- 58% ▬ 0.00%
- Median HH income
- $47,265
- Composite
- 35.8/100
- National rank
- #9626
- State rank
- #765 of 1400 in CA
Livability — Hanford
- Score
- 75/100
- State rank
- #121
- US rank
- #4255
Category grades
Schools grade is shown separately in the Schools card above.
Census & demographics
- Census place
- Hanford, CA
- County
- Kings County · 107,655 people
- City population
- 69,684
- Metro
- Hanford-Corcoran, CA
- Population (ZIP)
- 69,684
- Household income
- $76,023
- Rent vs Own
- Severe rent burden
- 2081.0
Population outlook (Kings County) Hauer SSP2
- Today (2025)
- 147,136 people
- By 2030
- 145,623 · -1.0%
- By 2040
- 146,017 · -0.8%
- By 2050
- 145,239 · -1.3%
- By 2075
- 131,479 · -10.6%
- By 2100
- 103,967 · -29.3%
Race, ethnicity, and origin ACS 2023
- Neighborhood character
- Diverse neighborhood (Simpson 0.60)
- Race & ethnicity
- Hispanic / Latino 52% White 35% Two or more races 19% Black 5% Asian 3% Native American 2%
- Hispanic origin (detail)
- Mexican 49%
- Common ancestry
- Russian 6% Italian 2% Lithuanian 1%
- Foreign-born
- 17% · Canada
- Languages at home
- 65% English-only · Spanish 31% Other Indo-European 2% Tagalog/Filipino 2%
Political lean MEDSL · Kings
- 2024 margin
- Strong R (+23.0) · D 37.4% · R 60.4% · Other 2.2%
- 2008→2024 swing
- -8.9pp toward R · 2008: -14.1pp · 2024: -23.0pp
- All cycles
- 2024: R+23.0 2020: R+12.2 2016: R+14.1 2012: R+16.3 2008: R+14.1
Not yet ingested
- Civics
- —
Market trends
- HPI YoY
- ▼ -267.79%
- Current HPI
- 321.3409
- Rent YoY
- ▲ 2.87%
- Metro
- Hanford-Corcoran, CA
- State GDP YoY
- ▲ 3.21%
- F500 in state
- 116
Industry mix (Fortune 500 HQ in CA)
| Industry | F500 HQs | Revenue |
|---|---|---|
| Technology | 27 | $1,492B |
|
||
| Financial Services | 3 | $174B |
|
||
| Retail | 3 | $44B |
|
||
| Insurance | 3 | $26B |
|
||
| Media / Entertainment | 2 | $115B |
|
||
| Pharmaceuticals / Biotech | 2 | $62B |
|
||
Price history
1 event — show timeline
- 2026-04-28 Listed $265,000 KCBOR
Property tax history
+1.5%/yrLatest (2025): $714 · +3.7% YoY. Source: county tax records.
Cash-flow waterfall
monthlySold comps — $/sqft
last 12 mo · ≤1 miLoading sold comps…