87 W Pine Rd · Staatsburg, NY
Flood risk 6/10 · Moderate
- FEMA flood zone
- X (unshaded)
- Chance of flooding over 30 yrs
- 0.71%
- Est. flood insurance / yr
- $507 – $1,088
Fire risk 3/10 · Minor
- Est. fire insurance / yr
- $691 – $1,283
Heat risk 4/10 · Minor
- Hot days now (above 97°F)
- 7 days/yr
- Hot days in 30 yrs
- 15 days/yr
Wind risk 4/10 · Minor
- Chance of severe wind over 30 yrs
- 10.0%
Air-quality risk 2/10 · Minimal
- Unhealthy air days now
- 1 days/yr
- Unhealthy air days in 30 yrs
- 1 days/yr
Risk factors via First Street. Map © Google.
Why this score? — see what drove the B grade
The composite is a weighted blend of 9 inputs, each scored 0–100. Each bar is that input's sub-score; the figure is the points it added to the 100-point composite (weight × sub-score).
- Cash flow +30.0/30.0
- 1% rule +10.0/10.0
- DSCR +10.0/10.0
- ARV discount +7.5/15.0
- Schools +4.7/10.0
- Livability +3.3/5.0
- Rent growth +2.5/5.0
- Condition / age +2.5/5.0
- Appreciation +0.0/10.0
$140,000
🖨 Deal sheet (PDF) 📄 Offer letter ✓ Due diligence
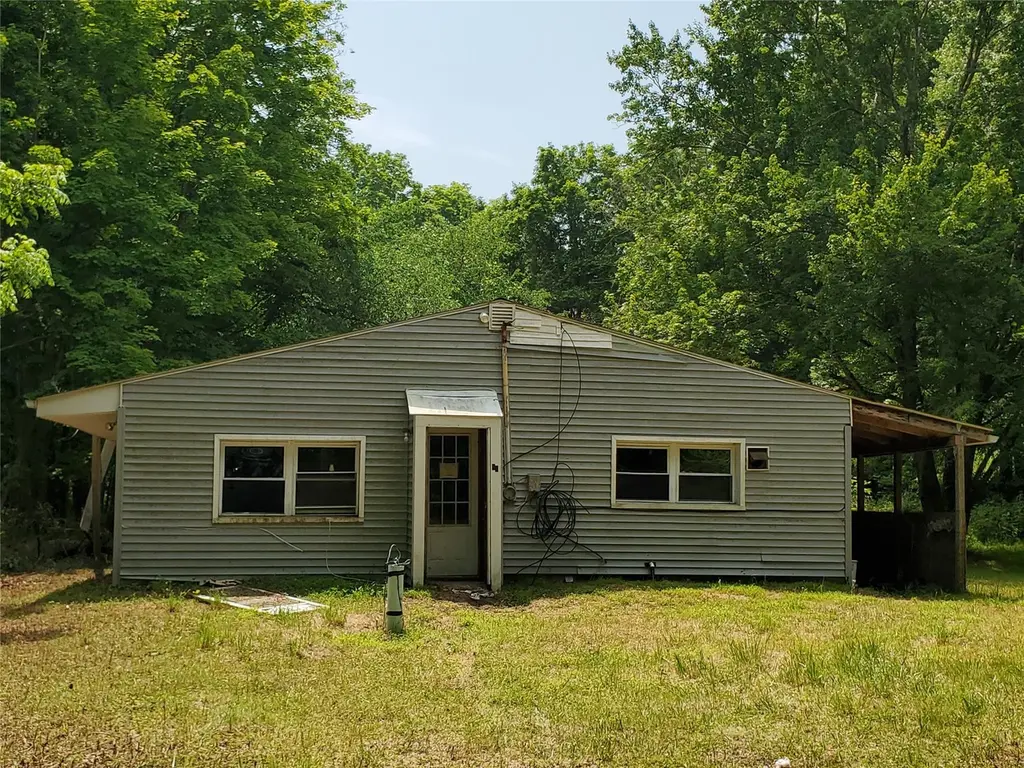
Listing remarks
Bungalow in need of repairs but with lots of privacy. This home has three small bedrooms, good size living room and a kitchen with a large dining area. The property is located on a 1.6 acre lot in a very quiet neighborhood. Great opportunity to bring this home back to life and make it your weekend getaway.
Key facts
- 1.6 acre lot
- Quiet neighborhood
- 1.6 acre lot
Tags
Neighborhood map
What this means for you Summary
Snapshot
- This is a 3-bed/1.0-bath single-family listed at $140k.
Deal economics
- At list price, monthly cash flow is $640 ($8k/yr) — positive.
- The deal already cash-flows at list — no discount required.
- Meets the 1% rule at list price ($2k rent vs $140k).
- Recommended offer: $123k (12.0% below list) — sets the bar for market timing.
- Cap rate 11.8% vs local median 2.5% in Staatsburg — top-decile yield for the area; either an underpriced asset or a hidden risk that comps aren't pricing in. Stress-test before assuming the spread holds.
Location & tenants
- Location reads 66/100 on livability (#639 in NY) — a middle-class / working-renter tenant base. Strengths: housing A+, employment B+; Watch: cost of living C-, amenities F, commute F.
- Hyde Park Central School District (rural): math 43% / reading 62% proficiency, ranked #316 of 590 in NY (top 54%) — acceptable for families but not a draw, mixed tenant base, ~2y average lease.
- Zoned schools: North Park Elementary School (math 37% / reading 62%, grade D, #1,085 of 2,108 statewide, top 56%, 476 students, 50% FRL); Haviland Middle School (math 23% / reading 57%, grade F, #413 of 729 statewide, top 57%, 759 students, 59% FRL); Franklin D Roosevelt Senior High School (math 93% / reading 90%, grade A+, #197 of 1,100 statewide, top 18%, 1,136 students, 52% FRL) — zoned schools average 54% FRL vs 34% district-wide (20 pts higher); higher-poverty schools than district average — tighter screening recommended.
- Market conditions: 44 active listings in the ZIP; 620 units permitted in Dutchess County in 2024 (242 in 5+ unit buildings).
Forward outlook
- Local home prices are declining (-3.0%/yr); year-one equity from $968 of loan paydown is wiped out by about $4k of value loss. Plan a longer hold.
- Dutchess County population projected at -11% by 2050 — secular population decline; favor cash flow + early exit over multi-decade hold.
- At projected returns (-3.0% appreciation + 3.0% rent growth), your $39k cash investment doubles in ~7 years — after that, you're playing with house money.
Negotiation context
- It's been on market 152 days — a 12% lower offer ($123k) is reasonable based on typical stale-listing flexibility.
- 2 sale attempts; this cycle's ask has dropped $20k (12%) from the opening price — seller is motivated, your offer sets the floor, not the list.
Risks & watch-outs
- Watch-outs: property tax is 3.2% of price.
- Climate carrying-cost: major flood risk — expect insurance premiums to compound above CPI over the hold.
Questions for the listing agent
- It's been on market 152 days. Have you received any prior offers? Is the seller open to a 12% concession, seller financing, or rate buy-down credit?
- Built in 1962 — when were the roof, HVAC, electrical panel, plumbing, and water heater last replaced?
- Property tax is high relative to price — has the assessment been appealed recently, and will the sale trigger a re-assessment?
- Why hasn't it sold? Are there any deal-killer items the seller is aware of (foundation, flood, title, zoning, code violations)?
- Is there a deadline driving the sale (1031 exchange, divorce, estate, relocation)? That informs how much negotiation room exists.
- What's the average days-on-market for RENTAL listings here right now (not sales)? A rising rental-DOM trend means longer vacancies and softer asking-rent achievability than the comps imply.
- What's the recent tenant-quality profile in this submarket — average credit score on applications, eviction rate, late-payment / NSF rate, and stable-employment percentage? A property-management company in the area should have these aggregated.
- How much new for-sale + rental construction is in the pipeline within 1–3 miles? Heavy new supply typically softens prices + rents 12–24 months out; constrained supply supports both.
Investment metrics
- 1% rule
- 1.63% ✓
- Cap rate
- 11.78%
- Cash-on-cash
- 19.58%
- DSCR
- 1.87
- GRM
- 5.1
CMA / ARV
No comps found within radius.
Projected returns pro-forma
-3.0% appreciation · 3.0% rent growth · sell at horizon
- IRR
- 11.7%
- Equity multiple
- 1.46×
- Total profit
- $18,203
- Equity at exit
- $20,874
- IRR
- 20.7%
- Equity multiple
- 2.76×
- Total profit
- $68,927
- Equity at exit
- $12,105
Cash invested: $39,200 (down + closing). Projections, not guarantees.
Landlord ↔ Tenant lean methodology
- Overall (STATE)
- 15 Strongly Tenant-Friendly
- State New York
- 15 Strongly Tenant-Friendly · D+10
- County
- — inherits STATE
- City
- — inherits STATE
ZIP-level market 12580
- Home prices YoY
- -6.7%
- Active inventory
- 44
- Price-to-rent
- 5.1×
Monthly cashflow live
- Estimated rent
- $2,280 medium interval (Pro) →
- Mortgage (P&I)
- −$734
- Tax from tax record
- −$369 /mo · $4,429/yr
- Insurance
- −$58
- HOA
- −$0
- Vacancy / Maint / Mgmt
- −$479
- Net cashflow
- $640
Break-even live
Sensitivity live
| Price | -10% $719 | -5% $679 | +0% $640 | +5% $600 | +10% $560 |
|---|---|---|---|---|---|
| Rent | -10% $459 | -5% $550 | +0% $640 | +5% $730 | +10% $820 |
| Rate | -1.0pp $710 | -0.5pp $675 | base $640 | +0.5pp $603 | +1.0pp $566 |
UW: 25.0% down · 7.5% · 30yr · 1.5% tax · 5.0% vac · 8.0% maint · 8.0% mgmt
Financing live
Cash to close
- Down payment
- $35,000
- Closing costs
- $4,200
- Reserves months
- —
- Total cash needed
- —
Loan-product check · same deal, 3 products live
Conventional
25% down · 7.5% · 30yr
- Down + closing
- —
- Monthly P&I
- —
- Monthly cashflow
- —
- DSCR
- —
- Eligible?
- —
Personal DTI + credit; lowest rate.
DSCR
20% down · 8.5% · 30yr
- Down + closing
- —
- Monthly P&I
- —
- Monthly cashflow
- —
- DSCR
- —
- Eligible?
- —
No personal income docs; deal must DSCR.
Hard money
10% down · 12.0% · 12mo
- Down + closing
- —
- Monthly P&I
- —
- Monthly cashflow
- —
- DSCR
- —
- Eligible?
- —
Short-term bridge; refi at stabilization.
Listing history 6 events
-
2025-12-15status Pending
-
2025-11-29historical
-
2025-09-13price $140,000
-
2025-09-13status Active
-
2025-08-31historical
-
2025-06-16$160,000 Active
ⓘ Source: listings_history table (triggers on properties + properties_extension) + one-shot
backfill from property_details.listing_events for pre-trigger history.
Tax reassessment forecast NY · Partial reset (capped growth)
- Current annual tax
- $4,429 · $369/mo
- Projected year-2 tax
- $4,429 · $369/mo
- Expected delta
- $0/yr ($0/mo · 0.0%)
ⓘ Screening estimate from a state-policy table — verify with the county assessor before closing.
Climate risk First Street
- Flood 6/10 Major FEMA zone X (unshaded) · 71% chance over 30 yrs
- Wildfire 3/10 Moderate
- Heat 4/10 Moderate 7 d/yr ≥97°F today · 15 d/yr by 30 yrs out
- Wind 4/10 Moderate 10% chance of damaging wind over 30 yrs
- Air quality 2/10 Low 1 unhealthy d/yr today · 1 by 30 yrs out
Nearby sold comps map
Loading sold comps map…
Walkable amenities ~0.75 mi
Loading nearby amenities…
Taxation est. · year 1
- Rental income
- $27,360
- − Mortgage interest
- −$7,842
- − Property taxes
- −$4,429
- − Insurance
- −$700
- − Repairs & maintenance
- −$2,189
- − Management
- −$2,189
- − Depreciation
- −$4,073
- Taxable income
- $5,938
- Est. tax owed @ 24.0%
- −$1,425
- After-tax cash flow
- $6,250/yr
For passive investors: Depreciation is non-cash, so a rental often shows a tax loss while cash-flowing — sheltering income. Rental losses are passive: they offset passive income freely, and up to $25,000/yr can offset ordinary (W-2) income if you actively participate and your MAGI is under $100k (phasing out to $0 by $150k); unused losses carry forward. On sale, claimed depreciation is recaptured at up to 25%, and gains may owe capital-gains tax (a 1031 exchange can defer both). Figures are a year-1 estimate at your 24.0% rate — not tax advice; consult a CPA.
Schools (NCES district)
- District
- Hyde Park Central School District
- NCES district ID
- 3615180
- Math proficiency
- 43% ▼ -3.00%
- Reading proficiency
- 62% ▲ 15.00%
- Median HH income
- $68,932
- Composite
- 46.59/100
- National rank
- #2421
- State rank
- #316 of 590 in NY
Livability — Staatsburg
- Score
- 66/100
- State rank
- #639
- US rank
- #11896
Category grades
Schools grade is shown separately in the Schools card above.
Census & demographics
- Population (ZIP)
- 4,169
Population outlook (Dutchess County) Hauer SSP2
- Today (2025)
- 291,768 people
- By 2030
- 287,131 · -1.6%
- By 2040
- 274,881 · -5.8%
- By 2050
- 259,971 · -10.9%
- By 2075
- 235,366 · -19.3%
- By 2100
- 208,786 · -28.4%
Race, ethnicity, and origin ACS 2023
- Neighborhood character
- Predominantly White (84%)
- Race & ethnicity
- White 84% Two or more races 7% Black 5% Hispanic / Latino 4% Asian 2%
- Common ancestry
- Romanian 5% Lithuanian 4% Iranian 2%
- Foreign-born
- 8% · Canada
- Languages at home
- 92% English-only · Spanish 3% Other Indo-European 3% French/Haitian/Cajun 1%
Political lean MEDSL · Dutchess
- 2024 margin
- Lean D (+5.4) · D 52.7% · R 47.3%
- 2008→2024 swing
- -3.2pp toward R · 2008: 8.6pp · 2024: 5.4pp
- All cycles
- 2024: D+5.4 2020: D+9.6 2016: R+1.1 2012: D+6.6 2008: D+8.6
Not yet ingested
- Civics
- —
Market trends
- HPI YoY
- ▼ -19.18%
- Current HPI
- 269.4278
- Rent YoY
- —
- Metro
- —
- State GDP YoY
- ▲ 2.60%
- F500 in state
- 92
Industry mix (Fortune 500 HQ in NY)
| Industry | F500 HQs | Revenue |
|---|---|---|
| Financial Services | 10 | $950B |
|
||
| Consumer Goods | 9 | $162B |
|
||
| Insurance | 4 | $225B |
|
||
| Telecommunications | 2 | $144B |
|
||
| Pharmaceuticals | 2 | $112B |
|
||
| Media / Entertainment | 2 | $69B |
|
||
Price history
-12.5% since first listed6 events — show timeline
- 2025-12-15 Pending — OneKey® MLS as Distributed by MLS Grid
- 2025-11-29 Listing Removed — OneKey® MLS as Distributed by MLS Grid
- 2025-09-13 Price Changed $140,000 OneKey® MLS as Distributed by MLS Grid
- 2025-09-13 Relisted — OneKey® MLS as Distributed by MLS Grid
- 2025-08-31 Listing Removed — OneKey® MLS as Distributed by MLS Grid
- 2025-06-16 Listed $160,000 OneKey® MLS as Distributed by MLS Grid
Property tax history
+7.7%/yrLatest (2025): $4,429 · -0.1% YoY. Source: county tax records.
Cash-flow waterfall
monthlySold comps — $/sqft
last 12 mo · ≤1 miLoading sold comps…