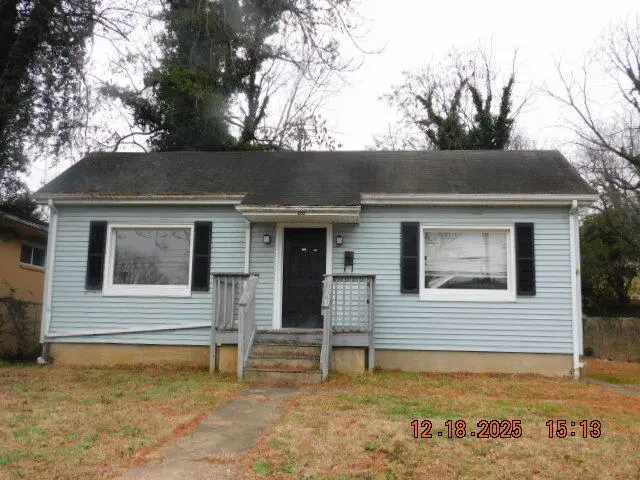
1222 Hamilton Ter SE · Roanoke, VA
Flood risk 8/10 · Major
- FEMA flood zone
- AE
- Chance of flooding over 30 yrs
- 0.99%
- Est. flood insurance / yr
- $1,737 – $8,500
Fire risk 2/10 · Minimal
- Est. fire insurance / yr
- $666 – $1,236
Heat risk 5/10 · Moderate
- Hot days now (above 101°F)
- 7 days/yr
- Hot days in 30 yrs
- 19 days/yr
Wind risk 2/10 · Minimal
- Chance of severe wind over 30 yrs
- 1.0%
Air-quality risk 2/10 · Minimal
- Unhealthy air days now
- 1 days/yr
- Unhealthy air days in 30 yrs
- 1 days/yr
Risk factors via First Street. Map © Google.
Why this score? — see what drove the C+ grade
The composite is a weighted blend of 9 inputs, each scored 0–100. Each bar is that input's sub-score; the figure is the points it added to the 100-point composite (weight × sub-score).
- Cash flow +20.0/30.0
- ARV discount +15.0/15.0
- DSCR +6.3/10.0
- 1% rule +5.7/10.0
- Rent growth +4.7/5.0
- Schools +4.1/10.0
- Livability +3.7/5.0
- Condition / age +2.5/5.0
- Appreciation +0.0/10.0
$130,000
🖨 Deal sheet 📄 Offer letter ✓ Due diligence
Listing remarks MLS
GREAT OPPORTUNITY LOCATED ONLY A FEW BLOCKS FROM THE CARILLION MEDICAL CENTER. WITHIN WALKING DISTANCE OF THE ROANOKE RIVER WALKS. PRIVATE DECK FOR THE COOK OUTS. FENCED BACK YARD.
Key facts
- Private deck
- Fenced back yard
- 5,662 sq ft lot
Tags
Neighborhood map
What this means for you Summary
Snapshot
- This is a 2-bed/2.0-bath single-family listed at $130k.
Deal economics
- At list price, monthly cash flow is $-268 ($-3k/yr) — negative.
- To cash-flow at today's rent, offer at most $83k (36.4% below list).
- Meets the 1% rule at list price ($1k rent vs $130k).
- Recommended offer: $83k (36.4% below list) — sets the bar for cash-flow.
- Cap rate 7.8% vs local median 4.2% in Roanoke — top-decile yield for the area; either an underpriced asset or a hidden risk that comps aren't pricing in. Stress-test before assuming the spread holds.
Location & tenants
- Location reads 73/100 on livability (#163 in VA) — a middle-class / working-renter tenant base. Strengths: cost of living A+, health & safety A+, housing A; Watch: amenities C-, employment D, crime F.
- Roanoke City Public School District (urban): math 40% / reading 58% proficiency, ranked #102 of 131 in VA (top 78%) — families likely to look elsewhere, expect single-tenant / working-renter base with shorter leases; 67% free/reduced lunch — lower-income household profile, screen leases tightly.
- Market conditions: Rents rising fast (+8.8%/yr); 155 active listings in the ZIP; 24 comparable units currently listed for rent nearby; rentals lingering (median 44d on market — plan ~5-8 weeks vacancy on turnover, expect pricing pressure); 54% of comp listings sitting > 30 days — soft ceiling on asking rent; 113 units permitted in Roanoke city in 2024 (0 in 5+ unit buildings).
Forward outlook
- Local home prices are declining (-3.0%/yr); year-one equity from $899 of loan paydown is wiped out by about $4k of value loss. Plan a longer hold.
- Roanoke County population projected at +11% by 2050 — modest demand growth; plan on rents tracking national, not racing it.
Negotiation context
- It's been on market 181 days — a 12% lower offer ($114k) is reasonable based on typical stale-listing flexibility.
- 4 sale attempts since 19y ago; this cycle's ask has dropped $70k (35%) from the opening price — seller is motivated, your offer sets the floor, not the list.
Risks & watch-outs
- Watch-outs: flood insurance adds $427/mo; built in 1952 — expect roof / HVAC / electrical / plumbing capex.
- Climate carrying-cost: in FEMA flood zone AE (mandatory federal flood insurance); extreme-heat days projected 7→19/yr by 2055 (HVAC capex compounding) — expect insurance premiums to compound above CPI over the hold.
Questions for the listing agent
- What do current leases actually rent for vs. the listed asking? Can we see a recent rent roll and the last 12 months of T-12 income?
- It's been on market 181 days. Have you received any prior offers? Is the seller open to a 36% concession, seller financing, or rate buy-down credit?
- Built in 1952 — when were the roof, HVAC, electrical panel, plumbing, and water heater last replaced?
- What's the actual annual flood-insurance premium (NFIP or private), and is the property in a SFHA with mandatory coverage?
- Why hasn't it sold? Are there any deal-killer items the seller is aware of (foundation, flood, title, zoning, code violations)?
- Is there a deadline driving the sale (1031 exchange, divorce, estate, relocation)? That informs how much negotiation room exists.
- Schools are A-rated — typically a magnet for longer-tenancy family renters. What's the average tenant stay here, and is there a school-zone premium baked into asking?
- Crime grade is F in this area — have there been break-ins, vandalism, or insurance claims at this property in the last 3 years? What carrier currently insures it and at what premium?
- What's the average days-on-market for RENTAL listings here right now (not sales)? A rising rental-DOM trend means longer vacancies and softer asking-rent achievability than the comps imply.
- What's the recent tenant-quality profile in this submarket — average credit score on applications, eviction rate, late-payment / NSF rate, and stable-employment percentage? A property-management company in the area should have these aggregated.
- How much new for-sale + rental construction is in the pipeline within 1–3 miles? Heavy new supply typically softens prices + rents 12–24 months out; constrained supply supports both.
Investment metrics
- 1% rule
- 1.07% ✓
- Cap rate
- 7.76%
- Cash-on-cash
- 5.24%
- DSCR
- 1.23
- GRM
- 7.8
CMA / ARV
- ARV (median comp)
- $213,009
- List price
- $130,000
- Delta
- -38.97%
- Verdict
- UNDERPRICED
- Comps
- 20 within 1.0 mi
Show comp detail 12 sales within ~0.75 mi
| Address | Dist | Beds/Ba | Sqft | Sold | Price | $/sf | Match |
|---|---|---|---|---|---|---|---|
| 910 Ivy St SE | 0.32mi | 3/2.0 (+1) | 1,418 (-1%) | 2mo | $248,000 | $175 | 76 |
| 628 Montrose Ave SE | 0.47mi | 2/1.0 | 1,467 (+2%) | 6mo | $130,000 | $89 | 64 |
| 618 Morrill Ave SE | 0.44mi | 2/1.0 | 1,433 (+0%) | 15mo | $164,950 | $115 | 63 |
| 645 Albemarle Ave SE | 0.51mi | 3/1.5 (+1) | 1,410 (-2%) | 10mo | $125,000 | $89 | 59 |
| 816 Morrill Ave SE | 0.70mi | 3/1.5 (+1) | 1,414 (-1%) | 2mo | $45,000 | $32 | 56 |
| 660 Montrose Ave SE | 0.54mi | 3/1.0 (+1) | 1,426 (-0%) | 16mo | $115,000 | $81 | 52 |
| 1306 Buena Vista Blvd SE | 0.61mi | 2/1.0 | 1,500 (+5%) | 16mo | $149,950 | $100 | 46 |
| 634 Mountain Ave SE | 0.66mi | 2/1.0 | 1,354 (-5%) | 19mo | $87,500 | $65 | 40 |
| 645 Highland Ave SE | 0.59mi | 3/2.0 (+1) | 1,526 (+7%) | 22mo | $155,000 | $102 | 38 |
| 514 Albemarle Ave | 0.41mi | 3/1.5 (+1) | 1,640 (+15%) | 16mo | $113,500 | $69 | 36 |
| 626 Montrose Ave SE | 0.47mi | 3/1.5 (+1) | 1,610 (+12%) | 24mo | $155,422 | $97 | 31 |
| 802 Dent St SE | 0.67mi | 3/1.0 (+1) | 1,253 (-12%) | 15mo | $175,000 | $140 | 27 |
Match score weights: distance 35% · size 25% · config 20% · recency 20%. Top-matched comps best support the ARV.
Projected returns pro-forma
-3.0% appreciation · 8.0% rent growth · sell at horizon
- IRR
- -22.8%
- Equity multiple
- 0.16×
- Total profit
- $-30,472
- Equity at exit
- $19,383
- IRR
- -4.4%
- Equity multiple
- 0.62×
- Total profit
- $-13,874
- Equity at exit
- $11,240
Cash invested: $36,400 (down + closing). Projections, not guarantees.
Landlord ↔ Tenant lean methodology
- Overall (STATE)
- 55 Moderately Landlord-Leaning
- State Virginia
- 55 Moderately Landlord-Leaning · D+2
- County
- — inherits STATE
- City
- — inherits STATE
ZIP-level market 24014
- Rents YoY
- 8.8%
- Active inventory
- 155
- Price-to-rent
- 7.8×
Monthly cashflow live
- Estimated rent
- $1,387 high interval (Pro) →
- Mortgage (P&I)
- −$682
- Tax from tax record
- −$201 /mo · $2,410/yr
- Insurance
- −$54
- Flood insurance flood zone
- −$427 /mo · $5,118/yr
- HOA
- −$0
- Vacancy / Maint / Mgmt
- −$291
- Net cashflow
- $-268
Break-even live
UW: 25.0% down · 7.5% · 30yr · 1.5% tax · 5.0% vac · 8.0% maint · 8.0% mgmt
Financing live
Cash to close
- Down payment
- $32,500
- Closing costs
- $3,900
- Reserves months
- —
- Total cash needed
- —
Loan-product check · same deal, 3 products live
Conventional
25% down · 7.5% · 30yr
- Down + closing
- —
- Monthly P&I
- —
- Monthly cashflow
- —
- DSCR
- —
- Eligible?
- —
Personal DTI + credit; lowest rate.
DSCR
20% down · 8.5% · 30yr
- Down + closing
- —
- Monthly P&I
- —
- Monthly cashflow
- —
- DSCR
- —
- Eligible?
- —
No personal income docs; deal must DSCR.
Hard money
10% down · 12.0% · 12mo
- Down + closing
- —
- Monthly P&I
- —
- Monthly cashflow
- —
- DSCR
- —
- Eligible?
- —
Short-term bridge; refi at stabilization.
Rent comps 24 comps
| Address | Beds | Baths | Sqft | Rent | $/sqft | DOM | Units | Dist |
|---|---|---|---|---|---|---|---|---|
| 520 Riverland Rd SE Roanoke, VA | 2.0 | 1.0 | 948 | $1,500 | $1.58 | 44d | 1 | 0.23mi |
| 635 Riverland Rd SE Roanoke, VA | 2.0 | 1.0 | 905 | $1,250 | $1.38 | 13d | 1 | 0.31mi |
| 703 Riverland Rd SE Roanoke, VA | 2.0 | 1.0 | 1000 | $1,250 | $1.25 | 44d | 1 | 0.32mi |
| 770 Riverland Rd SE Roanoke, VA | 3.0 | 2.0 | 1200 | $2,100 | $1.75 | 44d | 1 | 0.49mi |
| 1119 Franklin Rd SW Unit BensonFranklin 05 Roanoke, VA | 2.0 | 1.0 | 900 | $1,297 | $1.44 | 44d | 1 | 0.62mi |
| 730 Murray Ave SE Roanoke, VA | 3.0 | 1.0 | 1163 | $1,525 | $1.31 | 44d | 1 | 0.69mi |
| 730 Murray Ave SE Roanoke, VA | 3.0 | 1.0 | 1163 | $1,525 | $1.31 | 21d | 1 | 0.69mi |
| 355 Highland Ave SW Apt 1 Roanoke, VA | 2.0 | 1.0 | 900 | $1,150 | $1.28 | 21d | 1 | 0.71mi |
| 2202 Broadway Ave SW Unit C Roanoke, VA | 1.0 | 1.0 | 1000 | $1,200 | $1.20 | 44d | 1 | 0.87mi |
| 430 Day Ave SW Unit A Roanoke, VA | 2.0 | 1.0 | 1444 | $1,650 | $1.14 | 44d | 1 | 0.94mi |
| 1513 Morningside St SE Roanoke, VA | 2.0 | 1.0 | 900 | $1,200 | $1.33 | 13d | 1 | 1.02mi |
| 602 Elm Ave Unit B Roanoke, VA | 2.0 | 1.0 | 1804 | $1,250 | $0.69 | 44d | 1 | 1.04mi |
| 2429 Avenham Ave SW Unit 7 Roanoke, VA | 3.0 | 2.5 | 1536 | $2,000 | $1.30 | 21d | 1 | 1.11mi |
| 1015 12th St SE Roanoke, VA | 3.0 | 1.0 | 1072 | $923 | $0.86 | 44d | 1 | 1.13mi |
| 711 Suburban Ave SW Roanoke, VA | 2.0 | 1.5 | 910 | $1,050 | $1.15 | 21d | 1 | 1.16mi |
| 909 13th St SE Roanoke, VA | 3.0 | 1.0 | 1870 | $1,199 | $0.64 | 44d | 1 | 1.23mi |
| 743 Suburban Ave SW Unit Suburban 745 Roanoke, VA | 2.0 | 1.0 | 1134 | $1,100 | $0.97 | 13d | 1 | 1.24mi |
| 1331 Main St SW Roanoke, VA | 2.0 | 1.0 | 877 | $1,023 | $1.17 | 21d | 1 | 1.24mi |
| 2610 Colonial Ave SW Roanoke, VA | 3.0 | 1.0 | 1104 | $1,500 | $1.36 | 44d | 1 | 1.36mi |
| 701 Salem Ave SW Roanoke, VA | 2.0 | 1.0 | 1250 | $1,950 | $1.56 | 44d | 1 | 1.37mi |
| 216 Patton Ave NW Unit 2 Roanoke, VA | 2.0 | 1.0 | 1240 | $1,025 | $0.83 | 21d | 1 | 1.37mi |
| 1816 Bennington St SE Roanoke, VA | 2.0 | 1.5 | 938 | $1,023 | $1.09 | 21d | 1 | 1.38mi |
| 1016 15th St SE #2 Roanoke, VA | 3.0 | 1.5 | 1084 | $995 | $0.92 | 13d | 1 | 1.38mi |
| 1817 Dale Ave SE Roanoke, VA | 3.0 | 1.0 | 1820 | $2,100 | $1.15 | 44d | 1 | 1.50mi |
Listing history 32 events
-
2026-06-18days on market $130,000 Active 181 DOM
-
2026-06-17price $130,000 Active 180 DOM
-
2026-06-17days on market $139,900 Active 180 DOM
-
2026-06-16days on market $139,900 Active 179 DOM
-
2026-06-15days on market $139,900 Active 178 DOM
-
2026-06-14days on market $139,900 Active 176 DOM
-
2026-06-13days on market $139,900 Active 175 DOM
-
2026-06-10days on market $139,900 Active 173 DOM
-
2026-06-09days on market $139,900 Active 172 DOM
-
2026-06-08days on market $139,900 Active 171 DOM
-
2026-06-05days on market $139,900 Active 167 DOM
-
2026-06-03days on market $139,900 Active 166 DOM
-
2026-06-02days on market $139,900 Active 165 DOM
-
2026-06-01days on market $139,900 Active 164 DOM
-
2026-05-31days on market $139,900 Active 163 DOM
-
2026-05-30days on market $139,900 Active 162 DOM
-
2026-05-02price $139,900 180-char remark
Show marketing remark (180 chars)
GREAT OPPORTUNITY LOCATED ONLY A FEW BLOCKS FROM THE CARILLION MEDICAL CENTER. WITHIN WALKING DISTANCE OF THE ROANOKE RIVER WALKS. PRIVATE DECK FOR THE COOK OUTS. FENCED BACK YARD.
-
2026-04-04price $149,900 180-char remark
Show marketing remark (180 chars)
GREAT OPPORTUNITY LOCATED ONLY A FEW BLOCKS FROM THE CARILLION MEDICAL CENTER. WITHIN WALKING DISTANCE OF THE ROANOKE RIVER WALKS. PRIVATE DECK FOR THE COOK OUTS. FENCED BACK YARD.
-
2026-02-27price $159,900 180-char remark
Show marketing remark (180 chars)
GREAT OPPORTUNITY LOCATED ONLY A FEW BLOCKS FROM THE CARILLION MEDICAL CENTER. WITHIN WALKING DISTANCE OF THE ROANOKE RIVER WALKS. PRIVATE DECK FOR THE COOK OUTS. FENCED BACK YARD.
-
2026-01-10price $179,900 180-char remark
Show marketing remark (180 chars)
GREAT OPPORTUNITY LOCATED ONLY A FEW BLOCKS FROM THE CARILLION MEDICAL CENTER. WITHIN WALKING DISTANCE OF THE ROANOKE RIVER WALKS. PRIVATE DECK FOR THE COOK OUTS. FENCED BACK YARD.
-
2025-12-18$199,900 Active 180-char remark
Show marketing remark (180 chars)
GREAT OPPORTUNITY LOCATED ONLY A FEW BLOCKS FROM THE CARILLION MEDICAL CENTER. WITHIN WALKING DISTANCE OF THE ROANOKE RIVER WALKS. PRIVATE DECK FOR THE COOK OUTS. FENCED BACK YARD.
-
2021-11-22soldstatus $160,000
-
2021-11-19soldstatus $160,000 335-char remark
Show marketing remark (335 chars)
Welcome home to this 3 bedroom/2 bath 1 story home sitting under the Mill Mountain Star. You'll enjoy being able to walk out of your new home right on the Roanoke Greenway, over to Dr Pepper Park. Located 1 block from Roanoke Memorial. Hardwood floors, Large master suite, nice size bathrooms, off street parking and private side deck.
-
2021-08-10$169,999 335-char remark
Show marketing remark (335 chars)
Welcome home to this 3 bedroom/2 bath 1 story home sitting under the Mill Mountain Star. You'll enjoy being able to walk out of your new home right on the Roanoke Greenway, over to Dr Pepper Park. Located 1 block from Roanoke Memorial. Hardwood floors, Large master suite, nice size bathrooms, off street parking and private side deck.
-
2015-06-30historical
-
2014-10-07$99,999
-
2007-10-16historical
-
2007-07-24$149,950
-
2006-12-15soldstatus $53,000
-
2006-12-15soldstatus $53,000
-
1997-07-29soldstatus $54,000
-
1977-04-25soldstatus $14,100
ⓘ Source: listings_history table (triggers on properties + properties_extension) + one-shot
backfill from property_details.listing_events for pre-trigger history.
Tax reassessment forecast VA · Resets to sale price
- Current annual tax
- $2,410 · $201/mo
- Projected year-2 tax
- $2,410 · $201/mo
- Expected delta
- $0/yr ($0/mo · 0.0%)
ⓘ Screening estimate from a state-policy table — verify with the county assessor before closing.
Climate risk First Street
- Flood 8/10 Severe FEMA zone AE · 99% chance over 30 yrs
- Wildfire 2/10 Low
- Heat 5/10 Major 7 d/yr ≥101°F today · 19 d/yr by 30 yrs out
- Wind 2/10 Low 100% chance of damaging wind over 30 yrs
- Air quality 2/10 Low 1 unhealthy d/yr today · 1 by 30 yrs out
Nearby sold comps map
Loading sold comps map…
Walkable amenities ~0.75 mi
Loading nearby amenities…
Taxation est. · year 1
- Rental income
- $16,643
- − Mortgage interest
- −$7,282
- − Property taxes
- −$2,410
- − Insurance
- −$5,768
- − Repairs & maintenance
- −$1,331
- − Management
- −$1,331
- − Depreciation
- −$3,782
- Taxable loss
- −$5,262
- Est. tax savings @ 24.0%
- +$1,263
- After-tax cash flow
- $-1,948/yr
For passive investors: Depreciation is non-cash, so a rental often shows a tax loss while cash-flowing — sheltering income. Rental losses are passive: they offset passive income freely, and up to $25,000/yr can offset ordinary (W-2) income if you actively participate and your MAGI is under $100k (phasing out to $0 by $150k); unused losses carry forward. On sale, claimed depreciation is recaptured at up to 25%, and gains may owe capital-gains tax (a 1031 exchange can defer both). Figures are a year-1 estimate at your 24.0% rate — not tax advice; consult a CPA.
Schools (NCES district)
- District
- Roanoke City Public School District
- NCES district ID
- 5103300
- Math proficiency
- 40% ▼ -38.00%
- Reading proficiency
- 58% ▼ -12.00%
- Median HH income
- $38,592
- Composite
- 40.8/100
- National rank
- #3639
- State rank
- #102 of 131 in VA
Livability — Roanoke
- Score
- 73/100
- State rank
- #163
- US rank
- #5055
Category grades
Schools grade is shown separately in the Schools card above.
Census & demographics
- Census place
- Roanoke, VA
- County
- Roanoke City · 101,625 people
- City population
- 168,930
- Metro
- Roanoke, VA
- Population (ZIP)
- 15,300
- Household income
- $70,381
- Rent vs Own
- Severe rent burden
- 209.0
Population outlook (Roanoke County) Hauer SSP2
- Today (2025)
- 106,094 people
- By 2030
- 108,927 · +2.7%
- By 2040
- 114,104 · +7.5%
- By 2050
- 118,032 · +11.3%
- By 2075
- 123,363 · +16.3%
- By 2100
- 116,827 · +10.1%
Race, ethnicity, and origin ACS 2023
- Neighborhood character
- Predominantly White (85%)
- Race & ethnicity
- White 85% Two or more races 7% Black 5% Hispanic / Latino 5% Asian 1%
- Common ancestry
- Serbian 3% Slovak 2% Italian 2%
- Foreign-born
- 2% · Canada
- Languages at home
- 94% English-only · Spanish 3% Other Indo-European 1% French/Haitian/Cajun 1%
Political lean MEDSL · Roanoke
- 2024 margin
- Strong D (+23.6) · D 61.1% · R 37.5% · Other 1.4%
- 2008→2024 swing
- +0.2pp no change · 2008: 23.4pp · 2024: 23.6pp
- All cycles
- 2024: D+23.6 2020: D+25.8 2016: D+17.6 2012: D+21.5 2008: D+23.4
Not yet ingested
- Civics
- —
Market trends
- HPI YoY
- ▼ -344.06%
- Current HPI
- 173.6728
- Rent YoY
- ▲ 8.80%
- Metro
- Roanoke, VA
- State GDP YoY
- ▲ 2.40%
- F500 in state
- 50
Industry mix (Fortune 500 HQ in VA)
| Industry | F500 HQs | Revenue |
|---|---|---|
| Aerospace / Defense | 4 | $236B |
|
||
| Technology / Defense | 3 | $32B |
|
||
| Financial Services | 2 | $176B |
|
||
| Utilities | 2 | $27B |
|
||
| Insurance | 2 | $25B |
|
||
| Technology | 2 | $15B |
|
||
Price history
+892.2% since first listed16 events — show timeline
- 2026-05-02 Price Changed $139,900 MLSRV
- 2026-04-04 Price Changed $149,900 MLSRV
- 2026-02-27 Price Changed $159,900 MLSRV
- 2026-01-10 Price Changed $179,900 MLSRV
- 2025-12-18 Listed $199,900 MLSRV
- 2021-11-22 Sold (Public Records) $160,000 Public Records
- 2021-11-19 Sold (MLS) $160,000 MLSRV
- 2021-08-10 Listed $169,999 MLSRV
- 2015-06-30 Listing Removed — MLSRV
- 2014-10-07 Listed $99,999 MLSRV
- 2007-10-16 Listing Removed — MLSRV
- 2007-07-24 Listed $149,950 MLSRV
- 2006-12-15 Sold (Public Records) $53,000 Public Records
- 2006-12-15 Sold (Public Records) $53,000 Public Records
- 1997-07-29 Sold (Public Records) $54,000 Public Records
- 1977-04-25 Sold (Public Records) $14,100 Public Records
Property tax history
+6.0%/yrLatest (2025): $2,410 · +4.7% YoY. Source: county tax records.
Cash-flow waterfall
monthlySold comps — $/sqft
last 12 mo · ≤1 miLoading sold comps…