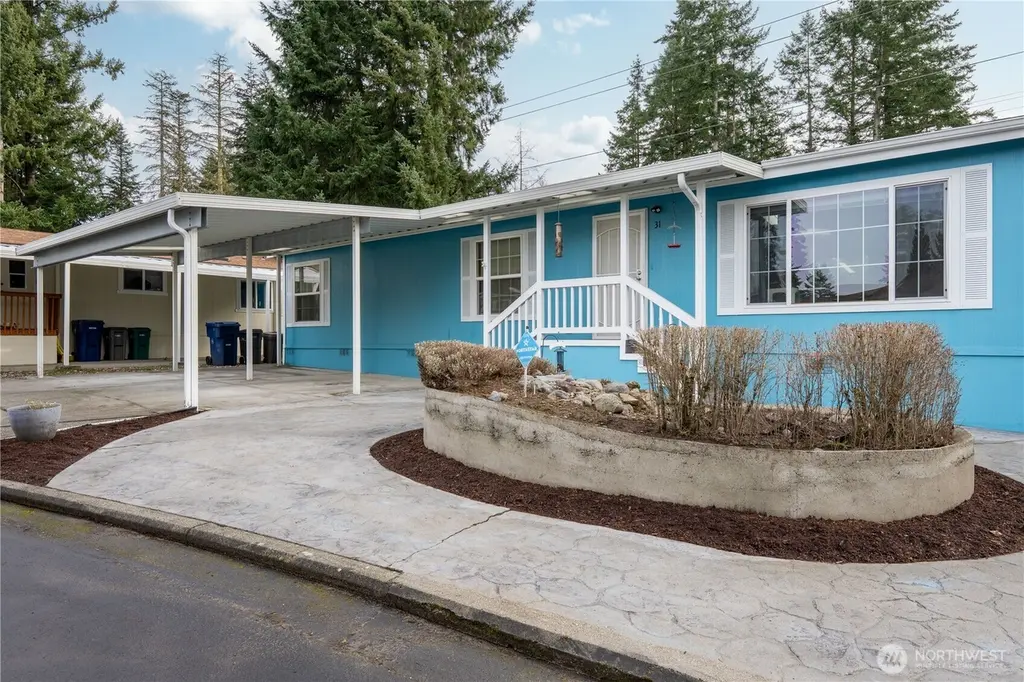
620 112th St SE #31 · Everett, WA
Flood risk No data
- FEMA flood zone
- —
- Chance of flooding over 30 yrs
- —
- Est. flood insurance / yr
- —
Fire risk No data
- Est. fire insurance / yr
- —
Heat risk No data
- Hot days now (above threshold)
- —
- Hot days in 30 yrs
- —
Wind risk No data
- Chance of severe wind over 30 yrs
- —
Air-quality risk No data
- Unhealthy air days now
- —
- Unhealthy air days in 30 yrs
- —
Risk factors via First Street. Map © Google.
Why this score? — see what drove the B grade
The composite is a weighted blend of 9 inputs, each scored 0–100. Each bar is that input's sub-score; the figure is the points it added to the 100-point composite (weight × sub-score).
- Cash flow +30.0/30.0
- 1% rule +10.0/10.0
- DSCR +10.0/10.0
- ARV discount +7.7/15.0
- Schools +5.9/10.0
- Livability +3.7/5.0
- Condition / age +2.5/5.0
- Rent growth +1.7/5.0
- Appreciation +0.0/10.0
$149,995
🖨 Deal sheet 📄 Offer letter ✓ Due diligence
Listing remarks
RARE OPPORTUNITY — the seller will prepay the first 3 months of LOT RENT for the new owner! Top-notch Lago de Plata 55+ community! Home built in 2004, this well-maintained doublewide offers the benefits of newer construction standards and modern finishes — clean lines, drywall interior, and no outdated paneling in sight. A thoughtfully designed 2-bedroom, 2-bath layout plus office/den provides both comfort and flexibility. The open-concept floor plan flows from the spacious west-facing living room into the dining area and kitchen, featuring a walk-in pantry. Two skylights fill the home with natural light, enhancing the bright, airy feel. The primary suite includes walk-in close
Key facts
- Covered deck
- Side-by-side carport
- Skylights
Tags
Property features AI
Finance
- Other: Bus line nearby
- Financial info: Land lease: $1,450; Accepted listing terms: Cash, Conventional
- HOA & community: Manufactured home park amenities: clubhouse, common area, pool, RV parking; Park approved for sale; Senior community; Approximately 243 homes in the park; Pets allowed (see remarks)
Exterior
- Parking: Carport
- Utilities: Electric energy source; Public water; City sewer; Power by SNO County PUD
- Home design: Manufactured double-wide home; One level; West-facing; Very good condition; Mobile home remains on site
- Construction: Cement plank and wood construction; Composition roof; Concrete ribbon foundation; Built by Karsten (manufactured after 6/15/1976)
- Exterior features: Cement-planked and wood exterior; Awnings; Patio/porch/deck; Landscaped; Curbs; Paved lot
Interior
- Kitchen: Dishwasher; Garbage disposal; Microwave; Refrigerator; Stove/Range
- Bedrooms: 2 bedrooms
- Flooring: Vinyl; Carpet
- Bathrooms: 2 full bathrooms (2 tubs, 2 showers)
- Heating & cooling: Forced air heating; Central air; Heat pump; Window unit(s)
- Interior features: Water heater; Skylights; Vaulted ceilings; Walk-in closet; Den/office; Dining room; Kitchen with eating space; Living room; Utility room
- Laundry & utility: Washer; Dryer; Laundry room with electric water heater
Neighborhood map
What this means for you Summary
Snapshot
- This is a 2-bed/2.0-bath manufactured listed at $150k.
Deal economics
- At list price, monthly cash flow is $855 ($10k/yr) — positive.
- The deal already cash-flows at list — no discount required.
- Meets the 1% rule at list price ($2k rent vs $150k).
- Recommended offer: $145k (3.0% below list) — sets the bar for market timing.
- Cap rate 13.1% vs local median 2.5% in Everett — top-decile yield for the area; either an underpriced asset or a hidden risk that comps aren't pricing in. Stress-test before assuming the spread holds.
Location & tenants
- Location reads 73/100 on livability (#199 in WA) — a middle-class / working-renter tenant base. Strengths: commute A+, housing A, health & safety A; Watch: schools C-, crime D+, amenities F.
- Everett School District (urban): math 60% / reading 72% proficiency, ranked #26 of 291 in WA (top 9%) — acceptable for families but not a draw, mixed tenant base, ~2y average lease.
- Market conditions: Rents falling (-3.2%/yr); 275 active listings in the ZIP; 40 comparable units currently listed for rent nearby; rentals leasing fast (median 5d on market — plan ~1-2 weeks tenant-placement turnaround); solid renter incomes; 3,982 units permitted in Snohomish County in 2024 (1,492 in 5+ unit buildings).
Forward outlook
- Local home prices are declining (-3.0%/yr); year-one equity from $1k of loan paydown is wiped out by about $4k of value loss. Plan a longer hold.
- Snohomish County population projected at +30% by 2050 — long-run rental-demand tailwind backs the buy-and-hold thesis.
- At projected returns (-3.0% appreciation + 0.0% rent growth), your $42k cash investment doubles in ~6 years — after that, you're playing with house money.
Negotiation context
- It's been on market 41 days — a 3% lower offer ($145k) is reasonable based on typical stale-listing flexibility.
- 3 sale attempts since 15y ago with the ask held roughly flat each time — persistent listings suggest the price (not the market) is what's stuck; bring a comps-based counter.
Questions for the listing agent
- It's been on market 41 days. Have you received any prior offers? Is the seller open to a 3% concession, seller financing, or rate buy-down credit?
- Is there a deadline driving the sale (1031 exchange, divorce, estate, relocation)? That informs how much negotiation room exists.
- Crime grade is D in this area — have there been break-ins, vandalism, or insurance claims at this property in the last 3 years? What carrier currently insures it and at what premium?
- What's the average days-on-market for RENTAL listings here right now (not sales)? A rising rental-DOM trend means longer vacancies and softer asking-rent achievability than the comps imply.
- What's the recent tenant-quality profile in this submarket — average credit score on applications, eviction rate, late-payment / NSF rate, and stable-employment percentage? A property-management company in the area should have these aggregated.
- How much new for-sale + rental construction is in the pipeline within 1–3 miles? Heavy new supply typically softens prices + rents 12–24 months out; constrained supply supports both.
Investment metrics
- 1% rule
- 1.51% ✓
- Cap rate
- 13.13%
- Cash-on-cash
- 24.42%
- DSCR
- 2.09
- GRM
- 5.5
CMA / ARV
- ARV (median comp)
- $150,611
- List price
- $149,995
- Delta
- -0.41%
- Verdict
- FAIR
- Comps
- 15 within 1.0 mi
Show comp detail 12 sales within ~0.75 mi
| Address | Dist | Beds/Ba | Sqft | Sold | Price | $/sf | Match |
|---|---|---|---|---|---|---|---|
| 620 112th St SE #189 | 0.00mi | 2/2.0 | 1,390 (-1%) | 8mo | $145,500 | $105 | 92 |
| 620 112th St SE #227 | 0.00mi | 3/2.0 (+1) | 1,404 (0%) | 4mo | $108,000 | $77 | 92 |
| 620 112th St SE #153 | 0.00mi | 2/2.0 | 1,340 (-5%) | 12mo | $110,000 | $82 | 82 |
| 11622 Silver Lake Rd #58 | 0.28mi | 2/2.0 | 1,344 (-4%) | 4mo | $78,000 | $58 | 76 |
| 11622 Silver Lake Rd #30 | 0.28mi | 2/2.0 | 1,344 (-4%) | 7mo | $150,000 | $112 | 74 |
| 620 112th St SE #163 | 0.00mi | 3/2.0 (+1) | 1,553 (+11%) | 13mo | $225,000 | $145 | 67 |
| 12030 2nd Dr SE | 0.54mi | 2/2.0 | 1,436 (+2%) | 10mo | $485,000 | $338 | 63 |
| 12219 Freeway Pl | 0.53mi | 2/2.0 | 1,452 (+3%) | 12mo | $525,000 | $362 | 60 |
| 11622 Silver Lake Rd #38 | 0.28mi | 2/2.0 | 1,560 (+11%) | 12mo | $118,500 | $76 | 58 |
| 12030 Andrew Sater Rd | 0.43mi | 2/2.0 | 1,264 (-10%) | 6mo | $85,000 | $67 | 58 |
| 11500 Meridian Ave S #91 | 0.64mi | 3/2.0 (+1) | 1,456 (+4%) | 2mo | $226,000 | $155 | 58 |
| 11500 Meridian Ave S #22 | 0.64mi | 3/2.0 (+1) | 1,290 (-8%) | 10mo | $199,000 | $154 | 44 |
Match score weights: distance 35% · size 25% · config 20% · recency 20%. Top-matched comps best support the ARV.
Projected returns pro-forma
-3.0% appreciation · 0.0% rent growth · sell at horizon
- IRR
- 14.5%
- Equity multiple
- 1.56×
- Total profit
- $23,478
- Equity at exit
- $22,365
- IRR
- 21.0%
- Equity multiple
- 2.54×
- Total profit
- $64,812
- Equity at exit
- $12,969
Cash invested: $41,999 (down + closing). Projections, not guarantees.
Landlord ↔ Tenant lean methodology
- Overall (STATE)
- 28 Tenant-Leaning
- State Washington
- 28 Tenant-Leaning · D+8
- County
- — inherits STATE
- City
- — inherits STATE
ZIP-level market 98208
- Rents YoY
- -3.2%
- Active inventory
- 275
- Price-to-rent
- 5.5×
Monthly cashflow live
- Estimated rent
- $2,261 high interval (Pro) →
- Mortgage (P&I)
- −$787
- Tax from tax record
- −$83 /mo · $991/yr
- Insurance
- −$62
- HOA
- −$0
- Vacancy / Maint / Mgmt
- −$475
- Net cashflow
- $855
Break-even live
UW: 25.0% down · 7.5% · 30yr · 1.5% tax · 5.0% vac · 8.0% maint · 8.0% mgmt
Financing live
Cash to close
- Down payment
- $37,499
- Closing costs
- $4,500
- Reserves months
- —
- Total cash needed
- —
Loan-product check · same deal, 3 products live
Conventional
25% down · 7.5% · 30yr
- Down + closing
- —
- Monthly P&I
- —
- Monthly cashflow
- —
- DSCR
- —
- Eligible?
- —
Personal DTI + credit; lowest rate.
DSCR
20% down · 8.5% · 30yr
- Down + closing
- —
- Monthly P&I
- —
- Monthly cashflow
- —
- DSCR
- —
- Eligible?
- —
No personal income docs; deal must DSCR.
Hard money
10% down · 12.0% · 12mo
- Down + closing
- —
- Monthly P&I
- —
- Monthly cashflow
- —
- DSCR
- —
- Eligible?
- —
Short-term bridge; refi at stabilization.
Rent comps 40 comps
| Address | Beds | Baths | Sqft | Rent | $/sqft | DOM | Units | Dist |
|---|---|---|---|---|---|---|---|---|
| 525 112th St SE Everett, WA | 1.0–2.0 | 1.0–2.0 | 1019 | $2,416 | $2.37 | 1d | 6 | 0.17mi |
| 11401 3rd Ave SE Everett, WA | 2.0 | 1.0–2.0 | 862 | $1,962 | $2.28 | 2d | 13 | 0.21mi |
| 515 112th St SE Everett, WA | 2.0–3.0 | 2.0–2.5 | 1050 | $1,726 | $1.64 | 3d | 3 | 0.24mi |
| 11026 Meridian Dr SE Everett, WA | 3.0 | 2.5 | 1700 | $3,000 | $1.76 | 43d | 1 | 0.53mi |
| 4 112th St SW Unit A Everett, WA | 3.0 | 2.5 | 1661 | $3,300 | $1.99 | 43d | 1 | 0.56mi |
| 133 124th St SE Everett, WA | 1.0–2.0 | 1.0–2.0 | 820 | $2,055 | $2.50 | 2d | 9 | 0.69mi |
| 1304 Bruskrud Rd Everett, WA | 2.0 | 1.5–2.0 | 900 | $2,076 | $2.31 | 5d | 5 | 0.71mi |
| 1701 121st St SE Everett, WA | 1.0–3.0 | 1.0–2.0 | 867 | $2,354 | $2.71 | 2d | 12 | 0.78mi |
| 10101 7th Ave SE Everett, WA | 1.0–3.0 | 1.0–2.0 | 1073 | $2,277 | $2.12 | 2d | 16 | 0.84mi |
| 305 127th St SE Unit A Everett, WA | 2.0 | 2.5 | 1456 | $2,649 | $1.82 | 43d | 1 | 0.86mi |
| 120 SE Everett Mall Way Everett, WA | 1.0–2.0 | 1.0–2.0 | 813 | $2,172 | $2.67 | 2d | 43 | 0.87mi |
| 2020 Lake Heights Dr Everett, WA | 1.0–3.0 | 1.0–2.0 | 918 | $2,106 | $2.29 | 2d | 16 | 0.88mi |
| 128 127th St SE Everett, WA | 3.0 | 1.0–2.0 | 884 | $2,747 | $3.11 | 2d | 10 | 0.88mi |
| 11225 19th Ave SE Everett, WA | 1.0–3.0 | 1.0–2.0 | 925 | $2,219 | $2.40 | 3d | 9 | 0.90mi |
| 222 124th St SW Unit A2 Everett, WA | 3.0 | 2.5 | 1560 | $2,975 | $1.91 | 5d | 1 | 0.97mi |
| 12115 19th Ave SE Everett, WA | 1.0–3.0 | 1.0–2.0 | 884 | $2,202 | $2.49 | 2d | 11 | 0.97mi |
| 11311 19th Ave SE Everett, WA | 1.0–3.0 | 1.0–2.0 | 932 | $2,303 | $2.47 | 1d | 14 | 1.00mi |
| 923 112th St SW Everett, WA | 1.0–3.0 | 1.0–2.0 | 858 | $1,950 | $2.27 | 2d | 24 | 1.11mi |
| 11207 9th Pl W Everett, WA | 2.0 | 1.0 | 995 | $1,899 | $1.91 | 20d | 7 | 1.14mi |
| 12600 4th Ave W Everett, WA | 2.0 | 2.5 | 1336 | $2,295 | $1.72 | 16d | 1 | 1.16mi |
| 9925 4th Ave W Apt 6 Everett, WA | 2.0 | 2.0 | 1000 | $1,445 | $1.45 | 2d | 1 | 1.16mi |
| 13117 3rd Ave SE Unit J1 Everett, WA | 3.0 | 3.0 | 1659 | $3,249 | $1.96 | 43d | 1 | 1.16mi |
| 13401 Dumas Rd Mill Creek, WA | 1.0–2.0 | 1.0–2.0 | 872 | $2,237 | $2.56 | 2d | 5 | 1.16mi |
| 9618 19th Ave SE Unit C Everett, WA | 3.0 | 3.0 | 1637 | $3,200 | $1.95 | 10d | 1 | 1.20mi |
| 2601 106th Pl SE Everett, WA | 3.0 | 2.0 | 1221 | $3,245 | $2.66 | 12d | 1 | 1.22mi |
| 1020 112th St SW Everett, WA | 1.0–2.0 | 1.0–2.0 | 853 | $1,752 | $2.05 | 2d | 7 | 1.23mi |
| 13004 Meridian Ave S Everett, WA | 1.0–3.0 | 1.0–2.0 | 1025 | $1,961 | $1.91 | 2d | 1 | 1.24mi |
| 222 W Marilyn Ave Everett, WA | 3.0 | 1.0 | 1000 | $2,400 | $2.40 | 16d | 1 | 1.25mi |
| 1108 Center Rd Everett, WA | 2.0 | 2.0 | 1200 | $2,150 | $1.79 | 15d | 1 | 1.27mi |
| 820 124th St SW Apt D Everett, WA | 2.0 | 1.5 | 960 | $1,595 | $1.66 | 5d | 1 | 1.28mi |
| 13510 N Creek Dr Mill Creek, WA | 1.0–4.0 | 1.0–2.0 | 1020 | $1,642 | $1.61 | 3d | 1 | 1.29mi |
| 11812 E Gibson Rd Everett, WA | 2.0 | 2.0 | 956 | $1,810 | $1.89 | 2d | 7 | 1.29mi |
| 11719 12th Ave W Everett, WA | 3.0 | 2.5 | 1533 | $2,800 | $1.83 | 44d | 1 | 1.32mi |
| 11727 12th Ave W #77 Everett, WA | 3.0 | 2.5 | 1533 | $3,100 | $2.02 | 22d | 1 | 1.33mi |
| 10111 9th Ave W Everett, WA | 1.0–2.0 | 1.0–2.5 | 1098 | $2,550 | $2.32 | 5d | 4 | 1.33mi |
| 12522 8th Ave W Everett, WA | 1.0–3.0 | 1.0–2.0 | 1005 | $2,146 | $2.13 | 5d | 8 | 1.35mi |
| 233 Dorn Ave Unit 1 Everett, WA | 2.0 | 1.0 | 944 | $1,950 | $2.07 | 11d | 1 | 1.40mi |
| 12121 Admiralty Way Everett, WA | 1.0–3.0 | 1.0–2.0 | 1116 | $2,245 | $2.01 | 3d | 18 | 1.40mi |
| 9515 Holly Dr Unit 1 Everett, WA | 3.0 | 2.5 | 1600 | $3,000 | $1.88 | 43d | 1 | 1.41mi |
| 13105 21st Dr SE Everett, WA | 2.0 | 2.0 | 1070 | $1,899 | $1.77 | 4d | 4 | 1.41mi |
Listing history 23 events
-
2026-06-18days on market $149,995 Active 41 DOM
-
2026-06-17days on market $149,995 Active 40 DOM
-
2026-06-16days on market $149,995 Active 39 DOM
-
2026-06-15days on market $149,995 Active 38 DOM
-
2026-06-13days on market $149,995 Active 36 DOM
-
2026-06-13days on market $149,995 Active 35 DOM
-
2026-06-09days on market $149,995 Active 32 DOM
-
2026-06-08days on market $149,995 Active 31 DOM
-
2026-06-07days on market $149,995 Active 30 DOM
-
2026-06-04days on market $149,995 Active 27 DOM
-
2026-06-03days on market $149,995 Active 26 DOM
-
2026-06-02days on market $149,995 Active 25 DOM
-
2026-06-01days on market $149,995 Active 24 DOM
-
2026-05-31days on market $149,995 Active 23 DOM
-
2026-05-08$149,995 Active
-
2021-11-08soldstatus $138,000 Closed
-
2021-10-19status Pending
-
2021-10-14$125,000 Active
-
2011-10-31historical
-
2011-10-25soldstatus $70,000 Sold
-
2011-10-14status Pending
-
2011-10-07status Pending Inspection
-
2011-08-05$78,500 Active
ⓘ Source: listings_history table (triggers on properties + properties_extension) + one-shot
backfill from property_details.listing_events for pre-trigger history.
Tax reassessment forecast WA · Resets to sale price
- Current annual tax
- $991 · $83/mo
- Projected year-2 tax
- $1,470 · $122/mo
- Expected delta
- +$479/yr (+$40/mo · 48.3%)
ⓘ Screening estimate from a state-policy table — verify with the county assessor before closing.
Nearby sold comps map
Loading sold comps map…
Walkable amenities ~0.75 mi
Loading nearby amenities…
Taxation est. · year 1
- Rental income
- $27,136
- − Mortgage interest
- −$8,402
- − Property taxes
- −$991
- − Insurance
- −$750
- − Repairs & maintenance
- −$2,171
- − Management
- −$2,171
- − Depreciation
- −$4,363
- Taxable income
- $8,288
- Est. tax owed @ 24.0%
- −$1,989
- After-tax cash flow
- $8,268/yr
For passive investors: Depreciation is non-cash, so a rental often shows a tax loss while cash-flowing — sheltering income. Rental losses are passive: they offset passive income freely, and up to $25,000/yr can offset ordinary (W-2) income if you actively participate and your MAGI is under $100k (phasing out to $0 by $150k); unused losses carry forward. On sale, claimed depreciation is recaptured at up to 25%, and gains may owe capital-gains tax (a 1031 exchange can defer both). Figures are a year-1 estimate at your 24.0% rate — not tax advice; consult a CPA.
Schools (NCES district)
- District
- Everett School District
- NCES district ID
- 5302670
- Math proficiency
- 60% ▲ 1.00%
- Reading proficiency
- 72% ▲ 1.00%
- Median HH income
- $66,815
- Composite
- 59.0/100
- National rank
- #1964
- State rank
- #26 of 291 in WA
Livability — Everett
- Score
- 73/100
- State rank
- #199
- US rank
- #5489
Category grades
Schools grade is shown separately in the Schools card above.
Census & demographics
- Census place
- Everett, WA
- County
- Snohomish County · 786,756 people
- City population
- 173,457
- Metro
- Seattle-Tacoma-Bellevue, WA
- Population (ZIP)
- 60,915
- Household income
- $103,705
- Rent vs Own
- Severe rent burden
- 1617.0
Population outlook (Snohomish County) Hauer SSP2
- Today (2025)
- 899,800 people
- By 2030
- 960,975 · +6.8%
- By 2040
- 1,074,447 · +19.4%
- By 2050
- 1,171,954 · +30.2%
- By 2075
- 1,384,849 · +53.9%
- By 2100
- 1,497,296 · +66.4%
Race, ethnicity, and origin ACS 2023
- Neighborhood character
- Diverse neighborhood (Simpson 0.65)
- Race & ethnicity
- White 55% Asian 17% Hispanic / Latino 14% Two or more races 13% Black 5%
- Hispanic origin (detail)
- Mexican 10%
- Common ancestry
- Portuguese 5% Italian 3% Slovak 2%
- Foreign-born
- 27% · Canada, Vietnam, South Korea
- Languages at home
- 66% English-only · Spanish 9% Vietnamese 4% Other Asian/Pacific 4%
Political lean MEDSL · Snohomish
- 2024 margin
- D (+19.0) · D 57.8% · R 38.9% · Other 3.3%
- 2008→2024 swing
- +0.1pp no change · 2008: 18.9pp · 2024: 19.0pp
- All cycles
- 2024: D+19.0 2020: D+20.6 2016: D+16.6 2012: D+16.2 2008: D+18.9
Not yet ingested
- Civics
- —
Market trends
- HPI YoY
- ▼ -884.74%
- Current HPI
- 337.856
- Rent YoY
- ▼ -3.16%
- Metro
- Seattle-Tacoma-Bellevue, WA
- State GDP YoY
- ▲ 4.65%
- F500 in state
- 22
Industry mix (Fortune 500 HQ in WA)
| Industry | F500 HQs | Revenue |
|---|---|---|
| Retail | 2 | $269B |
|
||
| Technology / Retail | 1 | $638B |
|
||
| Technology | 1 | $245B |
|
||
| Telecommunications | 1 | $38B |
|
||
| Food / Beverage | 1 | $36B |
|
||
| Automotive / Trucks | 1 | $34B |
|
||
Price history
+91.1% since first listed9 events — show timeline
- 2026-05-08 Listed $149,995 NWMLS as Distributed by MLS Grid
- 2021-11-08 Sold (MLS) $138,000 NWMLS as Distributed by MLS Grid
- 2021-10-19 Pending — NWMLS as Distributed by MLS Grid
- 2021-10-14 Listed $125,000 NWMLS as Distributed by MLS Grid
- 2011-10-31 Delisted — NWMLS as Distributed by MLS Grid
- 2011-10-25 Sold (MLS) $70,000 NWMLS as Distributed by MLS Grid
- 2011-10-14 Pending — NWMLS as Distributed by MLS Grid
- 2011-10-07 Pending — NWMLS as Distributed by MLS Grid
- 2011-08-05 Listed $78,500 NWMLS as Distributed by MLS Grid
Property tax history
+1.4%/yrLatest (2026): $991 · -9.1% YoY. Source: county tax records.
Cash-flow waterfall
monthlySold comps — $/sqft
last 12 mo · ≤1 miLoading sold comps…