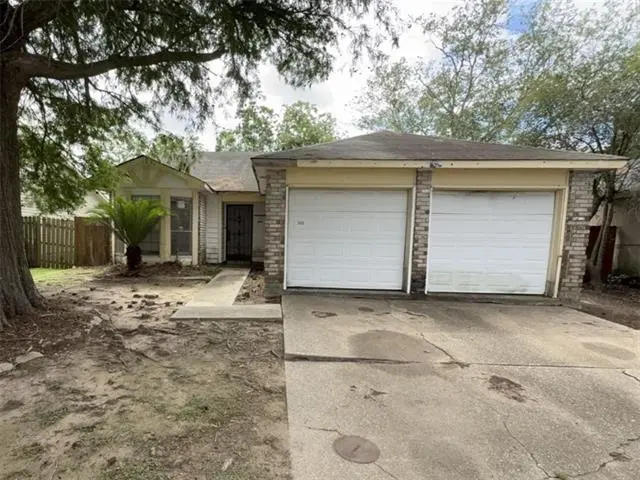
949 E Kingsway Dr · Terrytown, LA
Flood risk 8/10 · Major
- FEMA flood zone
- X (shaded)
- Chance of flooding over 30 yrs
- 0.6%
- Est. flood insurance / yr
- $507 – $1,088
Fire risk 1/10 · Minimal
- Est. fire insurance / yr
- $1,269 – $2,357
Heat risk 10/10 · Severe
- Hot days now (above 108°F)
- 7 days/yr
- Hot days in 30 yrs
- 21 days/yr
Wind risk 10/10 · Severe
- Chance of severe wind over 30 yrs
- 99.0%
Air-quality risk 2/10 · Minimal
- Unhealthy air days now
- 2 days/yr
- Unhealthy air days in 30 yrs
- 2 days/yr
Risk factors via First Street. Map © Google.
Why this score? — see what drove the B- grade
The composite is a weighted blend of 9 inputs, each scored 0–100. Each bar is that input's sub-score; the figure is the points it added to the 100-point composite (weight × sub-score).
- Cash flow +30.0/30.0
- 1% rule +10.0/10.0
- DSCR +10.0/10.0
- ARV discount +7.5/15.0
- Livability +3.5/5.0
- Rent growth +2.5/5.0
- Schools +2.5/10.0
- Condition / age +2.5/5.0
- Appreciation +0.0/10.0
$94,900
🖨 Deal sheet 📄 Offer letter ✓ Due diligence
Listing remarks MLS
Located in the Park Place subdivision in Gretna, LA, this diamond in the rough is ready for your personal touch, so grab your tools. The home boasts an open floor plan with a spacious great room, a dining area to the left featuring bay windows, straight ahead, a wood-burning fireplace, and high ceilings that flow into the back den/game room. The galley-style kitchen towards the front, offers another bay window breakfast nook and plenty cabinet space. The master bedroom includes a tray ceiling, open vanity, garden tub for relaxation, and a private commode area. Two nicely sized bedrooms complete the space. Don't miss out--call today to schedule your appointment!
Key facts
- Breakfast nook
- Open floor plan
- Bay windows
Tags
Property features AI
Exterior
- Parking: Attached garage with two spaces
- Utilities: Public water; Public sewer
- Home design: Single-story; Property condition: Poor
- Construction: Brick veneer construction; Asphalt shingle roof; Slab foundation; Built with poor condition noted
- Exterior features: City lot; Rectangular lot; Lot dimensions approximately 50 x 120
Interior
- Kitchen: Oven; Range
- Bedrooms: Total of 6 rooms (bedroom count not specified)
- Bathrooms: 2 full bathrooms
- Heating & cooling: Central heating; Central air conditioning
- Interior features: Wood-burning fireplace
Neighborhood map
What this means for you Summary
Snapshot
- This is a 3-bed/2.0-bath single-family listed at $95k.
Deal economics
- At list price, monthly cash flow is $651 ($8k/yr) — positive.
- The deal already cash-flows at list — no discount required.
- Meets the 1% rule at list price ($2k rent vs $95k).
- Cap rate 15.4% vs local median 4.5% in Terrytown — top-decile yield for the area; either an underpriced asset or a hidden risk that comps aren't pricing in. Stress-test before assuming the spread holds.
Location & tenants
- Location reads 69/100 on livability (#73 in LA) — a middle-class / working-renter tenant base. Strengths: cost of living A+, housing A+, health & safety A; Watch: employment C-, crime F, amenities F.
- Jefferson Parish (suburban): math 24% / reading 34% proficiency, ranked #44 of 98 in LA (top 45%) — low school quality limits family demand, transient renter base, plan for 1-2y turnover; 70% free/reduced lunch — lower-income household profile, screen leases tightly.
- Market conditions: Rents soft (-0.2%/yr); 163 active listings in the ZIP; 34 comparable units currently listed for rent nearby; rentals at typical pace (median 24d on market — plan ~3-4 weeks tenant-placement turnaround); 518 units permitted in Jefferson Parish in 2024 (43 in 5+ unit buildings).
- This rent runs 37% of the median local income ($59k/yr) — at the standard rent-burdened threshold; future hikes will face affordability resistance.
Forward outlook
- Local home prices are declining (-3.0%/yr); year-one equity from $656 of loan paydown is wiped out by about $3k of value loss. Plan a longer hold.
- At projected returns (-3.0% appreciation + 0.0% rent growth), your $27k cash investment doubles in ~5 years — after that, you're playing with house money.
Negotiation context
- Only 9 days on market — expect competitive offers; lowballing is unlikely to land.
- 6 sale attempts since 26y ago with the ask held roughly flat each time — persistent listings suggest the price (not the market) is what's stuck; bring a comps-based counter.
Risks & watch-outs
- Watch-outs: flood insurance adds $66/mo.
- Climate carrying-cost: severe flood risk; severe wind risk, 99% chance of damaging wind over 30y; extreme-heat days projected 7→21/yr by 2055 (HVAC capex compounding) — expect insurance premiums to compound above CPI over the hold.
Questions for the listing agent
- What's the actual annual flood-insurance premium (NFIP or private), and is the property in a SFHA with mandatory coverage?
- Is there a deadline driving the sale (1031 exchange, divorce, estate, relocation)? That informs how much negotiation room exists.
- Crime grade is F in this area — have there been break-ins, vandalism, or insurance claims at this property in the last 3 years? What carrier currently insures it and at what premium?
- What's the average days-on-market for RENTAL listings here right now (not sales)? A rising rental-DOM trend means longer vacancies and softer asking-rent achievability than the comps imply.
- What's the recent tenant-quality profile in this submarket — average credit score on applications, eviction rate, late-payment / NSF rate, and stable-employment percentage? A property-management company in the area should have these aggregated.
- How much new for-sale + rental construction is in the pipeline within 1–3 miles? Heavy new supply typically softens prices + rents 12–24 months out; constrained supply supports both.
Investment metrics
- 1% rule
- 1.89% ✓
- Cap rate
- 15.36%
- Cash-on-cash
- 32.38%
- DSCR
- 2.44
- GRM
- 4.4
CMA / ARV
- ARV (on-the-fly)
- $257,040
- Comps found
- 12
Show comp detail 12 sales within ~0.75 mi
| Address | Dist | Beds/Ba | Sqft | Sold | Price | $/sf | Match |
|---|---|---|---|---|---|---|---|
| 2424 Park Place Dr | 0.30mi | 3/2.0 | 1,550 (+1%) | 2mo | $163,000 | $105 | 82 |
| 2473 Carol Sue Ave | 0.60mi | 3/2.0 | 1,520 (-1%) | 5mo | $288,000 | $189 | 67 |
| 737 Rue St Michael | 0.68mi | 3/2.0 | 1,512 (-1%) | 1mo | $321,900 | $213 | 65 |
| 2446 Ave Mont Martre Ave | 0.45mi | 3/2.0 | 1,415 (-8%) | 2mo | $290,000 | $205 | 65 |
| 719 Rue St Michael | 0.59mi | 3/2.0 | 1,500 (-2%) | 7mo | $321,900 | $215 | 63 |
| 861 Mystic Ave | 0.61mi | 3/2.5 | 1,569 (+2%) | 7mo | $160,000 | $102 | 59 |
| 2336 Carol Sue Ave | 0.71mi | 4/2.0 (+1) | 1,551 (+1%) | 1mo | $135,000 | $87 | 59 |
| 800 Mystic Ave | 0.68mi | 3/2.5 | 1,476 (-4%) | 5mo | $240,000 | $163 | 57 |
| 840 Morningside Dr | 0.71mi | 3/2.0 | 1,410 (-8%) | 0mo | $125,000 | $89 | 54 |
| 2341 N Village Ct | 0.42mi | 2/2.5 (-1) | 1,313 (-14%) | 3mo | $254,000 | $193 | 47 |
| 828 Mystic Ave | 0.66mi | 3/2.0 | 1,308 (-14%) | 1mo | $220,000 | $168 | 44 |
| 760 Mystic Ave | 0.72mi | 3/2.5 | 1,685 (+10%) | 6mo | $140,000 | $83 | 42 |
Match score weights: distance 35% · size 25% · config 20% · recency 20%. Top-matched comps best support the ARV.
Projected returns pro-forma
-3.0% appreciation · 0.0% rent growth · sell at horizon
- IRR
- 20.1%
- Equity multiple
- 1.79×
- Total profit
- $20,885
- Equity at exit
- $14,150
- IRR
- 26.1%
- Equity multiple
- 2.94×
- Total profit
- $51,572
- Equity at exit
- $8,205
Cash invested: $26,572 (down + closing). Projections, not guarantees.
Landlord ↔ Tenant lean methodology
- Overall (STATE)
- 90 Strongly Landlord-Friendly
- State Louisiana
- 90 Strongly Landlord-Friendly · R+12
- County
- — inherits STATE
- City
- — inherits STATE
ZIP-level market 70056
- Rents YoY
- -0.2%
- Active inventory
- 163
- Price-to-rent
- 4.4×
Monthly cashflow live
- Estimated rent
- $1,798 high interval (Pro) →
- Mortgage (P&I)
- −$498
- Tax from tax record
- −$166 /mo · $1,993/yr
- Insurance
- −$40
- Flood insurance flood zone
- −$66 /mo · $798/yr
- HOA
- −$0
- Vacancy / Maint / Mgmt
- −$378
- Net cashflow
- $651
Break-even live
UW: 25.0% down · 7.5% · 30yr · 1.5% tax · 5.0% vac · 8.0% maint · 8.0% mgmt
Financing live
Cash to close
- Down payment
- $23,725
- Closing costs
- $2,847
- Reserves months
- —
- Total cash needed
- —
Loan-product check · same deal, 3 products live
Conventional
25% down · 7.5% · 30yr
- Down + closing
- —
- Monthly P&I
- —
- Monthly cashflow
- —
- DSCR
- —
- Eligible?
- —
Personal DTI + credit; lowest rate.
DSCR
20% down · 8.5% · 30yr
- Down + closing
- —
- Monthly P&I
- —
- Monthly cashflow
- —
- DSCR
- —
- Eligible?
- —
No personal income docs; deal must DSCR.
Hard money
10% down · 12.0% · 12mo
- Down + closing
- —
- Monthly P&I
- —
- Monthly cashflow
- —
- DSCR
- —
- Eligible?
- —
Short-term bridge; refi at stabilization.
Rent comps 34 comps
| Address | Beds | Baths | Sqft | Rent | $/sqft | DOM | Units | Dist |
|---|---|---|---|---|---|---|---|---|
| 1028 Kingsway Dr W Gretna, LA | 4.0 | 2.0 | 1900 | $2,400 | $1.26 | 23d | 1 | 0.25mi |
| 2424 Park Place Dr Gretna, LA | 3.0 | 2.0 | 1550 | $2,200 | $1.42 | 21d | 1 | 0.27mi |
| 937 E Monterey Ct Apt D Terrytown, LA | 4.0 | 2.0 | 1500 | $1,500 | $1.00 | 23d | 1 | 0.28mi |
| 937 E Monterey Ct Apt B Terrytown, LA | 3.0 | 2.0 | 1500 | $1,300 | $0.87 | 23d | 1 | 0.28mi |
| 2448 Oxford Pl Gretna, LA | 3.0 | 2.5 | 1514 | $1,600 | $1.06 | 23d | 1 | 0.32mi |
| 916 E Monterey Ct Unit A Terrytown, LA | 3.0 | 2.0 | 1400 | $1,600 | $1.14 | 43d | 1 | 0.32mi |
| 2337 Park Place Dr Gretna, LA | 3.0 | 2.5 | 1800 | $1,650 | $0.92 | 43d | 1 | 0.33mi |
| 917 Monterey Ct S Unit b Gretna, LA | 3.0 | 2.0 | 1500 | $1,500 | $1.00 | 43d | 1 | 0.34mi |
| 2425 Oxford Pl #113 Gretna, LA | 2.0 | 2.0 | 1081 | $2,300 | $2.13 | 43d | 1 | 0.37mi |
| 701 Fairfax Dr #199 Gretna, LA | 2.0 | 2.0 | 1060 | $1,500 | $1.42 | 43d | 1 | 0.38mi |
| 2350 Park Place Dr Gretna, LA | 1.0–3.0 | 1.0–2.0 | 1000 | $1,525 | $1.52 | 43d | 5 | 0.49mi |
| 132 Layburn Ct Terrytown, LA | 4.0 | 2.5 | 2100 | $2,200 | $1.05 | 4d | 1 | 0.74mi |
| 725 Oakwood Dr Gretna, LA | 3.0 | 2.0 | 2079 | $1,850 | $0.89 | 23d | 1 | 0.87mi |
| 740 Oakwood Dr Gretna, LA | 4.0 | 2.0 | 1290 | $2,200 | $1.71 | 43d | 1 | 0.88mi |
| 119 Planters Canal Rd Belle Chasse, LA | 4.0 | 3.0 | 1840 | $2,195 | $1.19 | 43d | 1 | 0.91mi |
| 119 Planters Canal Rd Belle Chasse, LA | 4.0 | 3.0 | 1840 | $2,195 | $1.19 | 23d | 1 | 0.91mi |
| 5200 Timber Crest Dr New Orleans, LA | 4.0 | 2.0 | 1530 | $1,800 | $1.18 | 23d | 1 | 0.92mi |
| 119 Jay St Belle Chasse, LA | 2.0 | 2.0 | 1200 | $900 | $0.75 | 14d | 1 | 0.96mi |
| 3653 Timber Bluff Ln New Orleans, LA | 4.0 | 2.0 | 1800 | $2,500 | $1.39 | 43d | 1 | 0.97mi |
| 500 Behrman Hwy Gretna, LA | 3.0 | 1.5 | 1600 | $1,750 | $1.09 | 4d | 1 | 1.10mi |
| 502 Behrman Hwy Gretna, LA | 4.0 | 2.0 | 1600 | $1,750 | $1.09 | 4d | 1 | 1.17mi |
| 805 Terry Pkwy Terrytown, LA | 3.0 | 2.0 | 1782 | $2,050 | $1.15 | 4d | 1 | 1.21mi |
| 805 Terry Pkwy Terrytown, LA | 3.0 | 2.0 | 1782 | $2,050 | $1.15 | 2d | 1 | 1.21mi |
| 2111 Emerson St Terrytown, LA | 3.0 | 2.5 | 1500 | $1,650 | $1.10 | 43d | 1 | 1.23mi |
| 130 Cypress Grove Ct #92 New Orleans, LA | 2.0 | 1.5 | 1381 | $1,550 | $1.12 | 16d | 1 | 1.23mi |
| 201 Wall Blvd Gretna, LA | 3.0 | 2.0 | 2220 | $2,500 | $1.13 | 43d | 1 | 1.26mi |
| 532 Oakwood Dr Gretna, LA | 3.0 | 2.5 | 2100 | $2,000 | $0.95 | 4d | 1 | 1.32mi |
| 5000 Woodland Dr New Orleans, LA | 2.0 | 1.0–2.5 | 943 | $1,457 | $1.55 | 23d | 1 | 1.42mi |
| 5797 Tullis Dr New Orleans, LA | 3.0 | 1.5 | 1240 | $1,600 | $1.29 | 23d | 1 | 1.43mi |
| 583 Delmar St Terrytown, LA | 3.0 | 1.5 | 1426 | $1,350 | $0.95 | 43d | 1 | 1.45mi |
| 5823 Tullis Dr New Orleans, LA | 3.0 | 1.5 | 1637 | $1,600 | $0.98 | 23d | 1 | 1.45mi |
| 517 Diplomat St Terrytown, LA | 3.0 | 2.0 | 1850 | $2,000 | $1.08 | 4d | 1 | 1.48mi |
| 469 Lynnmeade Rd Gretna, LA | 3.0 | 2.0 | 1964 | $2,300 | $1.17 | 23d | 1 | 1.49mi |
| 528 Grovewood Dr Gretna, LA | 4.0 | 2.0 | 1525 | $2,200 | $1.44 | 23d | 1 | 1.49mi |
Listing history 7 events
-
2026-06-18days on market $94,900 Active 9 DOM
-
2026-06-17days on market $94,900 Active 8 DOM
-
2026-06-16days on market $94,900 Active 7 DOM
-
2026-06-15days on market $94,900 Active 6 DOM
-
2026-06-13days on market $94,900 Active 4 DOM
-
2026-06-10remarks 668-char remark
-
2026-06-10$94,900 Active 1 DOM
ⓘ Source: listings_history table (triggers on properties + properties_extension) + one-shot
backfill from property_details.listing_events for pre-trigger history.
Tax reassessment forecast LA · Resets to sale price
- Current annual tax
- $1,993 · $166/mo
- Projected year-2 tax
- $1,993 · $166/mo
- Expected delta
- $0/yr ($0/mo · -0.0%)
ⓘ Screening estimate from a state-policy table — verify with the county assessor before closing.
Climate risk First Street
- Flood 8/10 Severe FEMA zone X (shaded) · 60% chance over 30 yrs
- Wildfire 1/10 Low
- Heat 10/10 Extreme 7 d/yr ≥108°F today · 21 d/yr by 30 yrs out
- Wind 10/10 Extreme 99% chance of damaging wind over 30 yrs
- Air quality 2/10 Low 2 unhealthy d/yr today · 2 by 30 yrs out
Nearby sold comps map
Loading sold comps map…
Walkable amenities ~0.75 mi
Loading nearby amenities…
Taxation est. · year 1
- Rental income
- $21,574
- − Mortgage interest
- −$5,316
- − Property taxes
- −$1,993
- − Insurance
- −$1,272
- − Repairs & maintenance
- −$1,726
- − Management
- −$1,726
- − Depreciation
- −$2,761
- Taxable income
- $6,781
- Est. tax owed @ 24.0%
- −$1,627
- After-tax cash flow
- $6,179/yr
For passive investors: Depreciation is non-cash, so a rental often shows a tax loss while cash-flowing — sheltering income. Rental losses are passive: they offset passive income freely, and up to $25,000/yr can offset ordinary (W-2) income if you actively participate and your MAGI is under $100k (phasing out to $0 by $150k); unused losses carry forward. On sale, claimed depreciation is recaptured at up to 25%, and gains may owe capital-gains tax (a 1031 exchange can defer both). Figures are a year-1 estimate at your 24.0% rate — not tax advice; consult a CPA.
Schools (NCES district)
- District
- Jefferson Parish
- NCES district ID
- 2200840
- Math proficiency
- 24% ▼ -36.00%
- Reading proficiency
- 34% ▼ -30.00%
- Median HH income
- $48,421
- Composite
- 25.19/100
- National rank
- #7511
- State rank
- #44 of 98 in LA
Livability — Terrytown
- Score
- 69/100
- State rank
- #73
- US rank
- #8731
Category grades
Schools grade is shown separately in the Schools card above.
Census & demographics
- Census place
- Terrytown, LA
- County
- Jefferson Parish · 426,999 people
- City population
- 42,471
- Metro
- New Orleans-Metairie, LA
- Population (ZIP)
- 40,348
- Household income
- $59,027
- Rent vs Own
- Severe rent burden
- 1623.0
Population outlook (Jefferson County) Hauer SSP2
- Today (2025)
- 451,696 people
- By 2030
- 455,451 · +0.8%
- By 2040
- 458,308 · +1.5%
- By 2050
- 461,031 · +2.1%
- By 2075
- 476,351 · +5.5%
- By 2100
- 499,377 · +10.6%
Race, ethnicity, and origin ACS 2023
- Neighborhood character
- Highly diverse neighborhood (Simpson 0.71)
- Race & ethnicity
- Black 34% White 32% Hispanic / Latino 26% Two or more races 9% Asian 4%
- Hispanic origin (detail)
- Mexican 3% Dominican 3%
- Common ancestry
- Lithuanian 5% Italian 2% Hispanic 2%
- Foreign-born
- 20% · Canada, Vietnam
- Languages at home
- 67% English-only · Spanish 22% Arabic 5% French/Haitian/Cajun 2%
Political lean MEDSL · Jefferson
- 2024 margin
- R (+12.9) · D 42.5% · R 55.5% · Other 2.1%
- 2008→2024 swing
- +13.6pp toward D · 2008: -26.6pp · 2024: -12.9pp
- All cycles
- 2024: R+12.9 2020: R+11.1 2016: R+14.8 2012: R+18.4 2008: R+26.6
Not yet ingested
- Civics
- —
Market trends
- HPI YoY
- ▼ -100.20%
- Current HPI
- 165.1579
- Rent YoY
- ▼ -0.16%
- Metro
- New Orleans-Metairie, LA
- State GDP YoY
- ▲ 3.29%
- F500 in state
- 10
Industry mix (Fortune 500 HQ in LA)
| Industry | F500 HQs | Revenue |
|---|---|---|
| Telecommunications | 2 | $23B |
|
||
| Utilities | 1 | $12B |
|
||
| Wholesale / Distribution | 1 | $5B |
|
||
| Advertising | 1 | $2B |
|
||
Price history
-12.9% since first listed9 events — show timeline
- 2026-06-08 Listed $94,900 GSREIN
- 2026-06-08 Listed $94,900 AcadianaMLS
- 2006-09-06 Sold (Public Records) $150,000 Public Records
- 2006-08-31 Sold (MLS) $150,000 GSREIN
- 2006-06-22 Listed $157,800 GSREIN
- 2006-06-22 Listed $157,800 AcadianaMLS
- 2000-06-26 Sold (MLS) $106,000 GSREIN
- 2000-03-19 Listed $109,000 AcadianaMLS
- 2000-03-19 Listed $109,000 GSREIN
Property tax history
+1.9%/yrLatest (2025): $1,993 · +0.3% YoY. Source: county tax records.
Cash-flow waterfall
monthlySold comps — $/sqft
last 12 mo · ≤1 miLoading sold comps…