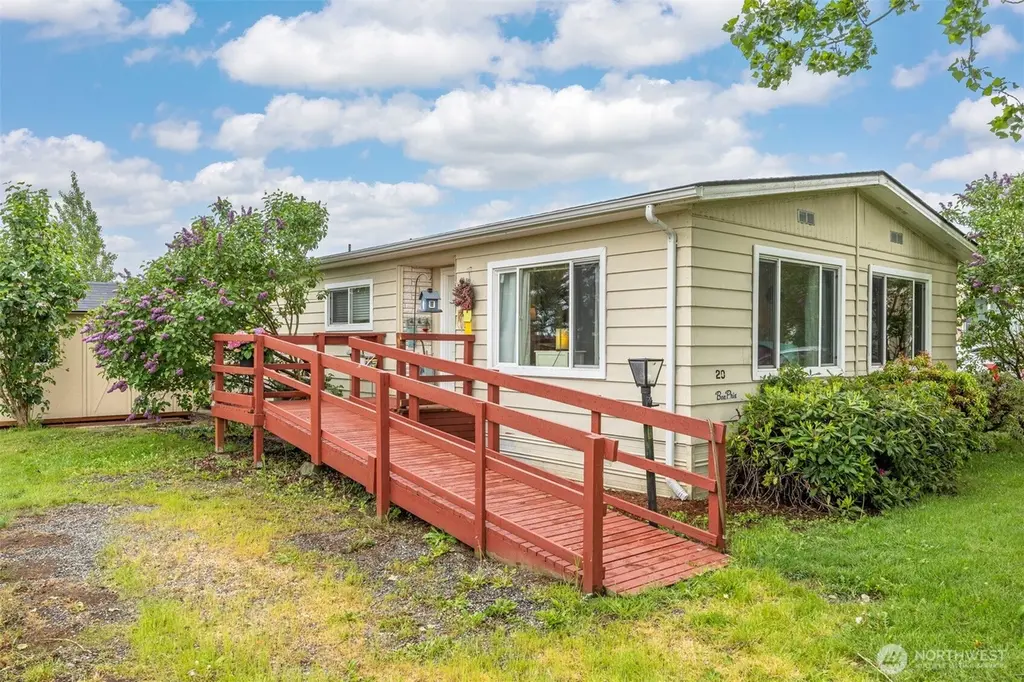
380 E Pole Rd #20 · Lynden, WA
Flood risk 1/10 · Minimal
- FEMA flood zone
- X (unshaded)
- Chance of flooding over 30 yrs
- 0.0%
- Est. flood insurance / yr
- $507 – $1,088
Fire risk 2/10 · Minimal
- Est. fire insurance / yr
- $604 – $1,122
Heat risk 3/10 · Minor
- Hot days now (above 85°F)
- 7 days/yr
- Hot days in 30 yrs
- 17 days/yr
Wind risk 1/10 · Minimal
- Chance of severe wind over 30 yrs
- —
Air-quality risk 6/10 · Moderate
- Unhealthy air days now
- 9 days/yr
- Unhealthy air days in 30 yrs
- 9 days/yr
Risk factors via First Street. Map © Google.
Why this score? — see what drove the B+ grade
The composite is a weighted blend of 9 inputs, each scored 0–100. Each bar is that input's sub-score; the figure is the points it added to the 100-point composite (weight × sub-score).
- Cash flow +30.0/30.0
- ARV discount +15.0/15.0
- DSCR +10.0/10.0
- 1% rule +8.0/10.0
- Schools +4.6/10.0
- Livability +4.0/5.0
- Rent growth +3.7/5.0
- Condition / age +2.5/5.0
- Appreciation +0.0/10.0
$159,000
🖨 Deal sheet 📄 Offer letter ✓ Due diligence
Listing remarks
Move-in ready well-maintained affordable home in lovely Royal Coachman 55+ Community! Mt Baker views, quiet neighborhood and located in the most ideal mid-county spot. This home offers a perfect blend of comfort and convenience. Spacious open floor plan in living & dining areas. Primary includes ensuite bath. Great size kitchen w/ stainless steel appliances. Large covered deck with peaceful pastoral views from the back. New roof in 2025! Surrounded by picturesque open country farm land with a brand new shed installed this week.
Key facts
- Covered deck
- Open floor plan
- Mt baker views
Tags
Property features AI
Finance
- Other: Calculated living area 1,152; Trailing directions provided to park and spot; Buyer to verify elementary school
- Financial info: Listing terms: Cash or Conventional
- HOA & community: Senior community; Senior exemption applicable; Royal Coachman Mobile Estates (park has 28 homes); Park approved for sale; Land lease: $750
Exterior
- Parking: Carport
- Utilities: Electric energy source; Public water; Septic sewer; Puget Sound Energy power
- Home design: Manufactured double wide; One level; Entry on main level; Good condition
- Construction: Metal/Vinyl construction materials; Composition roof; Slab foundation; Manufactured house; Built after 06/15/1976: No
- Exterior features: Metal/Vinyl exterior; Patio/porch/deck; Dead end street; Has view
Interior
- Kitchen: Dishwasher; Microwave; Refrigerator; Stove/Range
- Bedrooms: 2 bedrooms
- Flooring: Laminate; Carpet
- Bathrooms: 1 full bath; 1 half bath; 1 bathtub; 1 shower
- Heating & cooling: Forced air heating; Window unit cooling
- Interior features: Vaulted ceilings; Drapes; Landscaped setting; Entry; Living room; Kitchen without eating space; Bath off primary; Double pane windows
- Laundry & utility: Washer; Dryer
Neighborhood map
What this means for you Summary
Snapshot
- This is a 2-bed/1.5-bath manufactured listed at $159k.
Deal economics
- At list price, monthly cash flow is $681 ($8k/yr) — positive.
- The deal already cash-flows at list — no discount required.
- Meets the 1% rule at list price ($2k rent vs $159k).
- Recommended offer: $154k (3.0% below list) — sets the bar for market timing.
- Cap rate 11.4% vs local median 2.2% in Lynden — top-decile yield for the area; either an underpriced asset or a hidden risk that comps aren't pricing in. Stress-test before assuming the spread holds.
Location & tenants
- Location reads 81/100 on livability (#80 in WA, #1,495 nationally) — a professional / high-income tenant draw. Strengths: commute A+, health & safety A+, housing A; Watch: cost of living F.
- Meridian School District (rural): math 45% / reading 56% proficiency, ranked #139 of 291 in WA (top 48%) — acceptable for families but not a draw, mixed tenant base, ~2y average lease.
- Market conditions: Rents rising fast (+4.7%/yr); 190 active listings in the ZIP; solid renter incomes; 1,190 units permitted in Whatcom County in 2024 (327 in 5+ unit buildings).
Forward outlook
- Local home prices are declining (-3.0%/yr); year-one equity from $1k of loan paydown is wiped out by about $5k of value loss. Plan a longer hold.
- Whatcom County population projected at +28% by 2050 — long-run rental-demand tailwind backs the buy-and-hold thesis.
- At projected returns (-3.0% appreciation + 4.7% rent growth), your $45k cash investment doubles in ~6 years — after that, you're playing with house money.
Negotiation context
- It's been on market 34 days — a 3% lower offer ($154k) is reasonable based on typical stale-listing flexibility.
Questions for the listing agent
- It's been on market 34 days. Have you received any prior offers? Is the seller open to a 3% concession, seller financing, or rate buy-down credit?
- Built in 1976 — when were the roof, HVAC, electrical panel, plumbing, and water heater last replaced?
- Is there a deadline driving the sale (1031 exchange, divorce, estate, relocation)? That informs how much negotiation room exists.
- Schools are A-rated — typically a magnet for longer-tenancy family renters. What's the average tenant stay here, and is there a school-zone premium baked into asking?
- What's the average days-on-market for RENTAL listings here right now (not sales)? A rising rental-DOM trend means longer vacancies and softer asking-rent achievability than the comps imply.
- What's the recent tenant-quality profile in this submarket — average credit score on applications, eviction rate, late-payment / NSF rate, and stable-employment percentage? A property-management company in the area should have these aggregated.
- How much new for-sale + rental construction is in the pipeline within 1–3 miles? Heavy new supply typically softens prices + rents 12–24 months out; constrained supply supports both.
Investment metrics
- 1% rule
- 1.30% ✓
- Cap rate
- 11.43%
- Cash-on-cash
- 18.35%
- DSCR
- 1.82
- GRM
- 6.4
CMA / ARV
- ARV (median comp)
- $225,916
- List price
- $159,000
- Delta
- -29.62%
- Verdict
- UNDERPRICED
- Comps
- 1 within 2.0 mi
Show comp detail 5 sales within ~0.75 mi
| Address | Dist | Beds/Ba | Sqft | Sold | Price | $/sf | Match |
|---|---|---|---|---|---|---|---|
| 380 E Pole Rd #25 | 0.00mi | 2/2.0 | 1,232 (+7%) | 8mo | $225,000 | $183 | 80 |
| 380 E Pole Rd #2 | 0.00mi | 2/2.0 | 1,000 (-13%) | 21mo | $220,000 | $220 | 59 |
| 380 E Pole Rd #24 | 0.00mi | 2/2.0 | 1,296 (+12%) | 23mo | $110,000 | $85 | 58 |
| 380 E Pole Rd #22 | 0.00mi | 3/2.0 (+1) | 1,320 (+15%) | 23mo | $195,000 | $148 | 49 |
| 7062 Guide Meridian Rd #29 | 0.66mi | 3/2.0 (+1) | 1,296 (+12%) | 23mo | $119,000 | $92 | 22 |
Match score weights: distance 35% · size 25% · config 20% · recency 20%. Top-matched comps best support the ARV.
Projected returns pro-forma
-3.0% appreciation · 4.69% rent growth · sell at horizon
- IRR
- 11.7%
- Equity multiple
- 1.47×
- Total profit
- $21,104
- Equity at exit
- $23,707
- IRR
- 21.9%
- Equity multiple
- 3.00×
- Total profit
- $89,096
- Equity at exit
- $13,747
Cash invested: $44,520 (down + closing). Projections, not guarantees.
Landlord ↔ Tenant lean methodology
- Overall (STATE)
- 28 Tenant-Leaning
- State Washington
- 28 Tenant-Leaning · D+8
- County
- — inherits STATE
- City
- — inherits STATE
ZIP-level market 98264
- Rents YoY
- 4.7%
- Active inventory
- 190
- Price-to-rent
- 6.4×
Monthly cashflow live
- Estimated rent
- $2,060 medium interval (Pro) →
- Mortgage (P&I)
- −$834
- Tax from tax record
- −$46 /mo · $556/yr
- Insurance
- −$66
- HOA
- −$0
- Vacancy / Maint / Mgmt
- −$433
- Net cashflow
- $681
Break-even live
UW: 25.0% down · 7.5% · 30yr · 1.5% tax · 5.0% vac · 8.0% maint · 8.0% mgmt
Financing live
Cash to close
- Down payment
- $39,750
- Closing costs
- $4,770
- Reserves months
- —
- Total cash needed
- —
Loan-product check · same deal, 3 products live
Conventional
25% down · 7.5% · 30yr
- Down + closing
- —
- Monthly P&I
- —
- Monthly cashflow
- —
- DSCR
- —
- Eligible?
- —
Personal DTI + credit; lowest rate.
DSCR
20% down · 8.5% · 30yr
- Down + closing
- —
- Monthly P&I
- —
- Monthly cashflow
- —
- DSCR
- —
- Eligible?
- —
No personal income docs; deal must DSCR.
Hard money
10% down · 12.0% · 12mo
- Down + closing
- —
- Monthly P&I
- —
- Monthly cashflow
- —
- DSCR
- —
- Eligible?
- —
Short-term bridge; refi at stabilization.
Listing history 15 events
-
2026-06-18days on market $159,000 Active 34 DOM
-
2026-06-17days on market $159,000 Active 33 DOM
-
2026-06-16days on market $159,000 Active 32 DOM
-
2026-06-15days on market $159,000 Active 31 DOM
-
2026-06-14days on market $159,000 Active 29 DOM
-
2026-06-13days on market $159,000 Active 28 DOM
-
2026-06-10days on market $159,000 Active 26 DOM
-
2026-06-09days on market $159,000 Active 25 DOM
-
2026-06-08days on market $159,000 Active 24 DOM
-
2026-06-07days on market $159,000 Active 23 DOM
-
2026-06-02days on market $159,000 Active 18 DOM
-
2026-06-01days on market $159,000 Active 17 DOM
-
2026-05-31days on market $159,000 Active 16 DOM
-
2026-05-30days on market $159,000 Active 15 DOM
-
2026-05-15$159,000 Active
ⓘ Source: listings_history table (triggers on properties + properties_extension) + one-shot
backfill from property_details.listing_events for pre-trigger history.
Tax reassessment forecast WA · Resets to sale price
- Current annual tax
- $556 · $46/mo
- Projected year-2 tax
- $1,558 · $130/mo
- Expected delta
- +$1,002/yr (+$84/mo · 180.4%)
ⓘ Screening estimate from a state-policy table — verify with the county assessor before closing.
Climate risk First Street
- Flood 1/10 Low FEMA zone X (unshaded) · 0% chance over 30 yrs
- Wildfire 2/10 Low
- Heat 3/10 Moderate 7 d/yr ≥85°F today · 17 d/yr by 30 yrs out
- Wind 1/10 Low
- Air quality 6/10 Major 9 unhealthy d/yr today · 9 by 30 yrs out
Nearby sold comps map
Loading sold comps map…
Walkable amenities ~0.75 mi
Loading nearby amenities…
Taxation est. · year 1
- Rental income
- $24,719
- − Mortgage interest
- −$8,906
- − Property taxes
- −$556
- − Insurance
- −$795
- − Repairs & maintenance
- −$1,978
- − Management
- −$1,978
- − Depreciation
- −$4,625
- Taxable income
- $5,881
- Est. tax owed @ 24.0%
- −$1,411
- After-tax cash flow
- $6,760/yr
For passive investors: Depreciation is non-cash, so a rental often shows a tax loss while cash-flowing — sheltering income. Rental losses are passive: they offset passive income freely, and up to $25,000/yr can offset ordinary (W-2) income if you actively participate and your MAGI is under $100k (phasing out to $0 by $150k); unused losses carry forward. On sale, claimed depreciation is recaptured at up to 25%, and gains may owe capital-gains tax (a 1031 exchange can defer both). Figures are a year-1 estimate at your 24.0% rate — not tax advice; consult a CPA.
Schools (NCES district)
- District
- Meridian School District
- NCES district ID
- 5305010
- Math proficiency
- 45% ▼ -2.00%
- Reading proficiency
- 56% ▲ 3.00%
- Median HH income
- $56,778
- Composite
- 45.82/100
- National rank
- #5573
- State rank
- #139 of 291 in WA
Livability — Lynden
- Score
- 81/100
- State rank
- #80
- US rank
- #1495
Category grades
Schools grade is shown separately in the Schools card above.
Census & demographics
- County
- Whatcom County · 209,776 people
- City population
- 23,123
- Metro
- Bellingham, WA
- Population (ZIP)
- 23,123
- Household income
- $103,638
- Rent vs Own
- Severe rent burden
- 688.0
Population outlook (Whatcom County) Hauer SSP2
- Today (2025)
- 240,408 people
- By 2030
- 254,667 · +5.9%
- By 2040
- 281,365 · +17.0%
- By 2050
- 307,592 · +27.9%
- By 2075
- 375,576 · +56.2%
- By 2100
- 421,637 · +75.4%
Race, ethnicity, and origin ACS 2023
- Neighborhood character
- Predominantly White (75%)
- Race & ethnicity
- White 75% Hispanic / Latino 15% Two or more races 10% Asian 2%
- Hispanic origin (detail)
- Mexican 12%
- Common ancestry
- Iranian 17% Portuguese 3% Italian 3%
- Foreign-born
- 11% · Canada, China
- Languages at home
- 85% English-only · Spanish 10% Other Indo-European 2% Arabic 2%
Political lean MEDSL · Whatcom
- 2024 margin
- Strong D (+24.9) · D 60.8% · R 35.9% · Other 3.3%
- 2008→2024 swing
- +6.9pp toward D · 2008: 18.0pp · 2024: 24.9pp
- All cycles
- 2024: D+24.9 2020: D+23.9 2016: D+17.7 2012: D+12.1 2008: D+18.0
Not yet ingested
- Civics
- —
Market trends
- HPI YoY
- ▼ -314.17%
- Current HPI
- 370.7803
- Rent YoY
- ▲ 4.69%
- Metro
- Bellingham, WA
- State GDP YoY
- ▲ 4.65%
- F500 in state
- 22
Industry mix (Fortune 500 HQ in WA)
| Industry | F500 HQs | Revenue |
|---|---|---|
| Retail | 2 | $269B |
|
||
| Technology / Retail | 1 | $638B |
|
||
| Technology | 1 | $245B |
|
||
| Telecommunications | 1 | $38B |
|
||
| Food / Beverage | 1 | $36B |
|
||
| Automotive / Trucks | 1 | $34B |
|
||
Price history
1 event — show timeline
- 2026-05-15 Listed $159,000 NWMLS as Distributed by MLS Grid
Property tax history
+12.3%/yrLatest (2026): $556 · +102.3% YoY. Source: county tax records.
Cash-flow waterfall
monthlySold comps — $/sqft
last 12 mo · ≤1 miLoading sold comps…