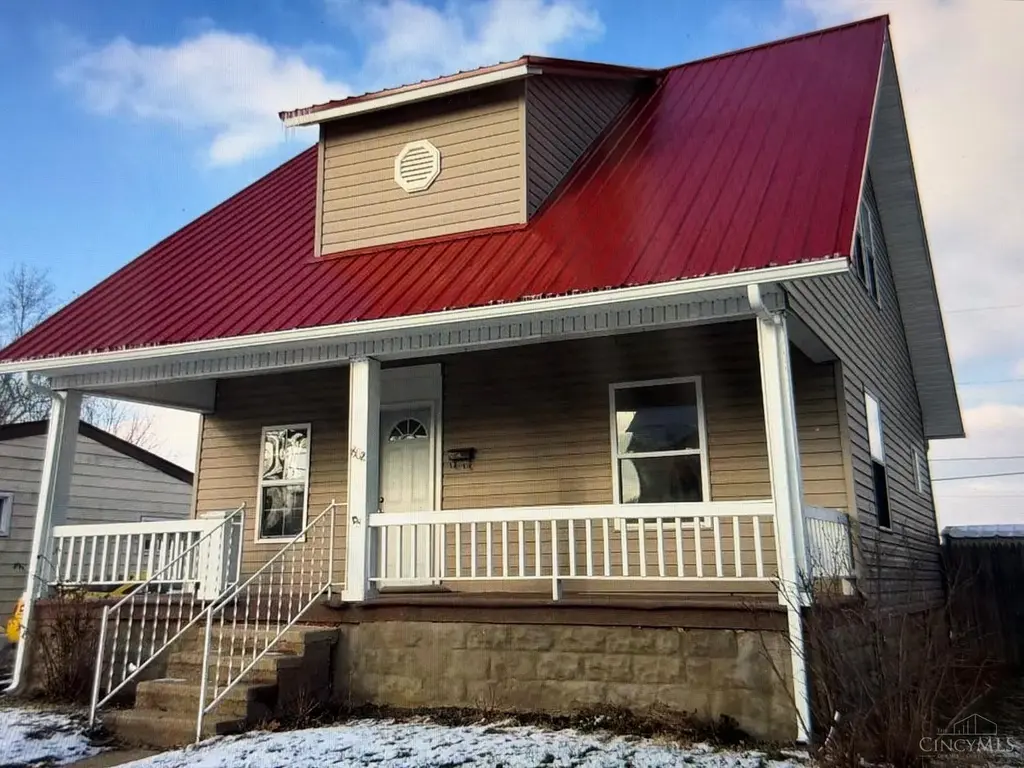
882 E Main St · Logan, OH
Flood risk 4/10 · Minor
- FEMA flood zone
- X (shaded)
- Chance of flooding over 30 yrs
- 0.22%
- Est. flood insurance / yr
- $473 – $860
Fire risk 3/10 · Minor
- Est. fire insurance / yr
- $713 – $1,323
Heat risk 4/10 · Minor
- Hot days now (above 99°F)
- 7 days/yr
- Hot days in 30 yrs
- 19 days/yr
Wind risk 2/10 · Minimal
- Chance of severe wind over 30 yrs
- 1.0%
Air-quality risk 2/10 · Minimal
- Unhealthy air days now
- 1 days/yr
- Unhealthy air days in 30 yrs
- 2 days/yr
Risk factors via First Street. Map © Google.
Why this score? — see what drove the B grade
The composite is a weighted blend of 9 inputs, each scored 0–100. Each bar is that input's sub-score; the figure is the points it added to the 100-point composite (weight × sub-score).
- Cash flow +28.1/30.0
- ARV discount +15.0/15.0
- DSCR +10.0/10.0
- 1% rule +7.1/10.0
- Schools +4.7/10.0
- Livability +3.9/5.0
- Rent growth +2.5/5.0
- Condition / age +2.5/5.0
- Appreciation +0.0/10.0
$139,900
🖨 Deal sheet (PDF) 📄 Offer letter ✓ Due diligence
Listing remarks MLS
This home is perfect for someone looking to build some sweat equity or the experienced investor. Roof was installed 2016 and the bathroom was remodeled that year as well!
Key facts
- Roof installed 2016
- Bathroom remodeled
- 4,792 sq ft lot
Tags
Neighborhood map
What this means for you Summary
Snapshot
- This is a 2-bed/1.0-bath single-family listed at $140k.
Deal economics
- At list price, monthly cash flow is $440 ($5k/yr) — positive.
- The deal already cash-flows at list — no discount required.
- Meets the 1% rule at list price ($2k rent vs $140k).
- Recommended offer: $127k (9.0% below list) — sets the bar for market timing.
- Cap rate 10.1% vs local median 2.7% in Logan — top-decile yield for the area; either an underpriced asset or a hidden risk that comps aren't pricing in. Stress-test before assuming the spread holds.
Location & tenants
- Location reads 78/100 on livability (#162 in OH, #2,412 nationally) — a middle-class / working-renter tenant base. Strengths: amenities A+, cost of living A+, housing A+; Watch: commute F, employment F.
- Logan-Hocking Local (rural): math 55% / reading 58% proficiency, ranked #354 of 656 in OH (top 54%) — acceptable for families but not a draw, mixed tenant base, ~2y average lease.
- Zoned schools: Central Elementary School (math 77% / reading 87%, grade A+, #116 of 1,584 statewide, top 9%, 415 students, 0% FRL); Logan-Hocking Middle School (math 49% / reading 53%, grade C, #405 of 654 statewide, top 63%, 1,084 students, 0% FRL); Logan High School (math 40% / reading 64%, grade D+, #343 of 781 statewide, top 47%, 1,004 students, 0% FRL) — zoned schools average 0% FRL vs 52% district-wide (52 pts lower); this property's tenant base skews higher-income than the district average.
- Market conditions: 164 active listings in the ZIP; 11 units permitted in Hocking County in 2024 (0 in 5+ unit buildings).
- This rent runs 31% of the median local income ($65k/yr) — at the standard rent-burdened threshold; future hikes will face affordability resistance.
Forward outlook
- Local home prices are declining (-3.0%/yr); year-one equity from $967 of loan paydown is wiped out by about $4k of value loss. Plan a longer hold.
- Hocking County population projected at -22% by 2050 — secular population decline; favor cash flow + early exit over multi-decade hold.
- At projected returns (-3.0% appreciation + 3.0% rent growth), your $39k cash investment doubles in ~9 years — after that, you're playing with house money.
Negotiation context
- It's been on market 115 days — a 9% lower offer ($127k) is reasonable based on typical stale-listing flexibility.
- 3 sale attempts since 24y ago with the ask held roughly flat each time — persistent listings suggest the price (not the market) is what's stuck; bring a comps-based counter.
Risks & watch-outs
- Watch-outs: built in 1900 — expect roof / HVAC / electrical / plumbing capex.
Questions for the listing agent
- It's been on market 115 days. Have you received any prior offers? Is the seller open to a 9% concession, seller financing, or rate buy-down credit?
- Built in 1900 — when were the roof, HVAC, electrical panel, plumbing, and water heater last replaced?
- Why hasn't it sold? Are there any deal-killer items the seller is aware of (foundation, flood, title, zoning, code violations)?
- Is there a deadline driving the sale (1031 exchange, divorce, estate, relocation)? That informs how much negotiation room exists.
- Schools are A-rated — typically a magnet for longer-tenancy family renters. What's the average tenant stay here, and is there a school-zone premium baked into asking?
- What's the average days-on-market for RENTAL listings here right now (not sales)? A rising rental-DOM trend means longer vacancies and softer asking-rent achievability than the comps imply.
- What's the recent tenant-quality profile in this submarket — average credit score on applications, eviction rate, late-payment / NSF rate, and stable-employment percentage? A property-management company in the area should have these aggregated.
- How much new for-sale + rental construction is in the pipeline within 1–3 miles? Heavy new supply typically softens prices + rents 12–24 months out; constrained supply supports both.
Investment metrics
- 1% rule
- 1.21% ✓
- Cap rate
- 10.06%
- Cash-on-cash
- 13.47%
- DSCR
- 1.60
- GRM
- 6.9
CMA / ARV
- ARV (median comp)
- $174,921
- List price
- $139,900
- Delta
- -20.02%
- Verdict
- UNDERPRICED
- Comps
- 20 within 1.0 mi
Show comp detail 12 sales within ~0.75 mi
| Address | Dist | Beds/Ba | Sqft | Sold | Price | $/sf | Match |
|---|---|---|---|---|---|---|---|
| 686 E Hunter St | 0.18mi | 3/1.0 (+1) | 1,232 (-1%) | 10mo | $184,000 | $149 | 76 |
| 683 E Hunter St | 0.18mi | 2/2.0 | 1,162 (-7%) | 0mo | $205,000 | $176 | 76 |
| 347 Belva Ct | 0.54mi | 3/1.0 (+1) | 1,273 (+2%) | 6mo | $206,999 | $163 | 61 |
| 707 Edgehill Dr | 0.60mi | 3/1.5 (+1) | 1,241 (-1%) | 5mo | $225,900 | $182 | 60 |
| 335 Vine St | 0.50mi | 3/1.0 (+1) | 1,200 (-4%) | 6mo | $219,500 | $183 | 60 |
| 680 E Hunter St | 0.20mi | 3/1.5 (+1) | 1,080 (-14%) | 3mo | $120,000 | $111 | 58 |
| 629 Zanesville Ave | 0.45mi | 2/1.5 | 1,292 (+4%) | 16mo | $175,000 | $135 | 58 |
| 424 N Walnut St | 0.65mi | 2/1.5 | 1,209 (-3%) | 7mo | $224,900 | $186 | 57 |
| 1334 Kansas Ave | 0.54mi | 2/4.0 | 1,264 (+1%) | 13mo | $195,000 | $154 | 50 |
| 1138 Ohio Ave | 0.54mi | 3/1.0 (+1) | 1,134 (-9%) | 6mo | $203,000 | $179 | 50 |
| 431 N Orchard St | 0.61mi | 3/2.0 (+1) | 1,364 (+9%) | 16mo | $185,000 | $136 | 34 |
| 582 N Walnut St | 0.69mi | 3/1.0 (+1) | 1,424 (+14%) | 6mo | $190,000 | $133 | 34 |
Match score weights: distance 35% · size 25% · config 20% · recency 20%. Top-matched comps best support the ARV.
Projected returns pro-forma
-3.0% appreciation · 3.0% rent growth · sell at horizon
- IRR
- 3.5%
- Equity multiple
- 1.14×
- Total profit
- $5,317
- Equity at exit
- $20,860
- IRR
- 13.0%
- Equity multiple
- 2.04×
- Total profit
- $40,630
- Equity at exit
- $12,096
Cash invested: $39,172 (down + closing). Projections, not guarantees.
Landlord ↔ Tenant lean methodology
- Overall (STATE)
- 73 Landlord-Friendly
- State Ohio
- 73 Landlord-Friendly · R+6
- County
- — inherits STATE
- City
- — inherits STATE
ZIP-level market 43138
- Home prices YoY
- -29.9%
- Active inventory
- 164
- Price-to-rent
- 6.9×
Monthly cashflow live
- Estimated rent
- $1,699 medium interval (Pro) →
- Mortgage (P&I)
- −$734
- Tax from tax record
- −$111 /mo · $1,331/yr
- Insurance
- −$58
- HOA
- −$0
- Vacancy / Maint / Mgmt
- −$357
- Net cashflow
- $440
Break-even live
Sensitivity live
| Price | -10% $519 | -5% $479 | +0% $440 | +5% $400 | +10% $360 |
|---|---|---|---|---|---|
| Rent | -10% $305 | -5% $373 | +0% $440 | +5% $507 | +10% $574 |
| Rate | -1.0pp $510 | -0.5pp $475 | base $440 | +0.5pp $403 | +1.0pp $367 |
UW: 25.0% down · 7.5% · 30yr · 1.5% tax · 5.0% vac · 8.0% maint · 8.0% mgmt
Financing live
Cash to close
- Down payment
- $34,975
- Closing costs
- $4,197
- Reserves months
- —
- Total cash needed
- —
Loan-product check · same deal, 3 products live
Conventional
25% down · 7.5% · 30yr
- Down + closing
- —
- Monthly P&I
- —
- Monthly cashflow
- —
- DSCR
- —
- Eligible?
- —
Personal DTI + credit; lowest rate.
DSCR
20% down · 8.5% · 30yr
- Down + closing
- —
- Monthly P&I
- —
- Monthly cashflow
- —
- DSCR
- —
- Eligible?
- —
No personal income docs; deal must DSCR.
Hard money
10% down · 12.0% · 12mo
- Down + closing
- —
- Monthly P&I
- —
- Monthly cashflow
- —
- DSCR
- —
- Eligible?
- —
Short-term bridge; refi at stabilization.
Listing history 24 events
-
2026-06-21days on market $139,900 Active 115 DOM
-
2026-06-18days on market $139,900 Active 112 DOM
-
2026-06-17days on market $139,900 Active 111 DOM
-
2026-06-16days on market $139,900 Active 110 DOM
-
2026-06-15days on market $139,900 Active 109 DOM
-
2026-06-13days on market $139,900 Active 107 DOM
-
2026-06-13days on market $139,900 Active 106 DOM
-
2026-06-09days on market $139,900 Active 103 DOM
-
2026-06-08days on market $139,900 Active 102 DOM
-
2026-06-07days on market $139,900 Active 101 DOM
-
2026-06-05days on market $139,900 Active 98 DOM
-
2026-06-03days on market $139,900 Active 97 DOM
-
2026-06-02days on market $139,900 Active 96 DOM
-
2026-06-01days on market $139,900 Active 95 DOM
-
2026-05-31days on market $139,900 Active 94 DOM
-
2026-02-25$139,900 Active 170-char remark
Show marketing remark (170 chars)
This home is perfect for someone looking to build some sweat equity or the experienced investor. Roof was installed 2016 and the bathroom was remodeled that year as well!
-
2022-08-08soldstatus $140,000
-
2022-07-27soldstatus $140,000 Closed 401-char remark
Show marketing remark (401 chars)
Charming 2 Bedroom/1 Bath home, located close to downtown Logan. Perfect starter home or if you are looking to downsize. Newer metal roof, hot water heater and refinished hardwood floors on the main level. Completely fenced in backyard and includes a storage shed. Full basement can be used for storage or finished for added space. 24 hour notice for showings due to tenant occupancy. See A2A remarks.
-
2022-06-09historical Contingent Finance and Inspection 401-char remark
Show marketing remark (401 chars)
Charming 2 Bedroom/1 Bath home, located close to downtown Logan. Perfect starter home or if you are looking to downsize. Newer metal roof, hot water heater and refinished hardwood floors on the main level. Completely fenced in backyard and includes a storage shed. Full basement can be used for storage or finished for added space. 24 hour notice for showings due to tenant occupancy. See A2A remarks.
-
2022-06-06$135,000 Active 401-char remark
Show marketing remark (401 chars)
Charming 2 Bedroom/1 Bath home, located close to downtown Logan. Perfect starter home or if you are looking to downsize. Newer metal roof, hot water heater and refinished hardwood floors on the main level. Completely fenced in backyard and includes a storage shed. Full basement can be used for storage or finished for added space. 24 hour notice for showings due to tenant occupancy. See A2A remarks.
-
2017-06-21soldstatus $83,000
-
2002-11-04soldstatus $67,500
-
2002-10-29soldstatus $67,500
-
2002-02-13$67,700
ⓘ Source: listings_history table (triggers on properties + properties_extension) + one-shot
backfill from property_details.listing_events for pre-trigger history.
Tax reassessment forecast OH · Partial reset (capped growth)
- Current annual tax
- $1,331 · $111/mo
- Projected year-2 tax
- $1,756 · $146/mo
- Expected delta
- +$426/yr (+$35/mo · 32.0%)
ⓘ Screening estimate from a state-policy table — verify with the county assessor before closing.
Climate risk First Street
- Flood 4/10 Moderate FEMA zone X (shaded) · 22% chance over 30 yrs
- Wildfire 3/10 Moderate
- Heat 4/10 Moderate 7 d/yr ≥99°F today · 19 d/yr by 30 yrs out
- Wind 2/10 Low 100% chance of damaging wind over 30 yrs
- Air quality 2/10 Low 1 unhealthy d/yr today · 2 by 30 yrs out
Nearby sold comps map
Loading sold comps map…
Walkable amenities ~0.75 mi
Loading nearby amenities…
Taxation est. · year 1
- Rental income
- $20,392
- − Mortgage interest
- −$7,837
- − Property taxes
- −$1,331
- − Insurance
- −$700
- − Repairs & maintenance
- −$1,631
- − Management
- −$1,631
- − Depreciation
- −$4,070
- Taxable income
- $3,193
- Est. tax owed @ 24.0%
- −$766
- After-tax cash flow
- $4,509/yr
For passive investors: Depreciation is non-cash, so a rental often shows a tax loss while cash-flowing — sheltering income. Rental losses are passive: they offset passive income freely, and up to $25,000/yr can offset ordinary (W-2) income if you actively participate and your MAGI is under $100k (phasing out to $0 by $150k); unused losses carry forward. On sale, claimed depreciation is recaptured at up to 25%, and gains may owe capital-gains tax (a 1031 exchange can defer both). Figures are a year-1 estimate at your 24.0% rate — not tax advice; consult a CPA.
Schools (NCES district)
- District
- Logan-Hocking Local
- NCES district ID
- 3904424
- Math proficiency
- 55% ▼ -16.00%
- Reading proficiency
- 58% ▼ -11.00%
- Median HH income
- $42,737
- Composite
- 47.48/100
- National rank
- #2276
- State rank
- #354 of 656 in OH
Livability — Logan
- Score
- 78/100
- State rank
- #162
- US rank
- #2412
Category grades
Schools grade is shown separately in the Schools card above.
Census & demographics
- Census place
- Logan, OH
- County
- Hocking · 26,658 people
- Metro
- Columbus, OH
- Population (ZIP)
- 19,147
- Household income
- $65,028
- Rent vs Own
- Severe rent burden
- 13.8
Population outlook (Hocking County) Hauer SSP2
- Today (2025)
- 26,807 people
- By 2030
- 25,723 · -4.0%
- By 2040
- 23,370 · -12.8%
- By 2050
- 20,947 · -21.9%
- By 2075
- 15,624 · -41.7%
- By 2100
- 11,134 · -58.5%
Race, ethnicity, and origin ACS 2023
- Neighborhood character
- Predominantly White (93%)
- Race & ethnicity
- White 93% Two or more races 3% Hispanic / Latino 1%
- Common ancestry
- Slovak 2% Iranian 2% Italian 1%
- Foreign-born
- 1%
- Languages at home
- 99% English-only · Spanish 1%
Political lean MEDSL · Hocking
- 2024 margin
- Solid R (+44.3) · D 27.5% · R 71.8%
- 2008→2024 swing
- -43.5pp toward R · 2008: -0.8pp · 2024: -44.3pp
- All cycles
- 2024: R+44.3 2020: R+42.4 2016: R+36.5 2012: R+1.1 2008: R+0.8
Not yet ingested
- Civics
- —
Market trends
- HPI YoY
- ▼ -108.44%
- Current HPI
- 253.6737
- Rent YoY
- —
- Metro
- —
- State GDP YoY
- ▲ 1.98%
- F500 in state
- 48
Industry mix (Fortune 500 HQ in OH)
| Industry | F500 HQs | Revenue |
|---|---|---|
| Insurance | 3 | $145B |
|
||
| Industrial Machinery | 3 | $49B |
|
||
| Financial Services | 3 | $24B |
|
||
| Consumer Goods | 2 | $93B |
|
||
| Aerospace / Defense | 2 | $47B |
|
||
| Utilities | 2 | $33B |
|
||
Price history
+106.6% since first listed9 events — show timeline
- 2026-02-25 Listed $139,900 Cincy MLS
- 2022-08-08 Sold (Public Records) $140,000 Public Records
- 2022-07-27 Sold (MLS) $140,000 CBRMLS
- 2022-06-09 Contingent — CBRMLS
- 2022-06-06 Listed $135,000 CBRMLS
- 2017-06-21 Sold (Public Records) $83,000 Public Records
- 2002-11-04 Sold (Public Records) $67,500 Public Records
- 2002-10-29 Sold (MLS) $67,500 CBRMLS
- 2002-02-13 Listed $67,700 CBRMLS
Property tax history
+5.1%/yrLatest (2025): $1,331 · +18.6% YoY. Source: county tax records.
Cash-flow waterfall
monthlySold comps — $/sqft
last 12 mo · ≤1 miLoading sold comps…