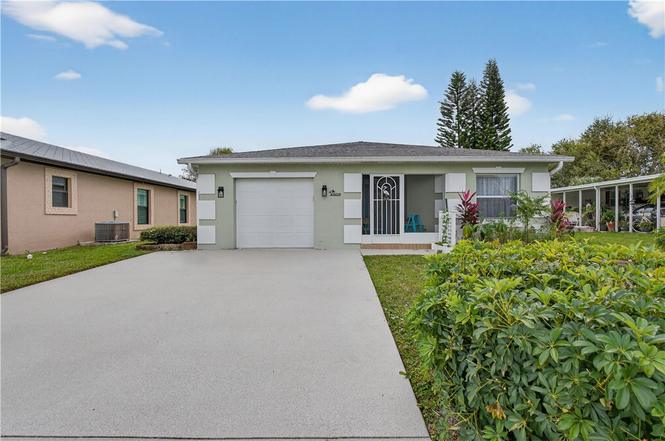
14339 Amapola Cir · Vero Beach South, FL
Flood risk 1/10 · Minimal
- FEMA flood zone
- X (unshaded)
- Chance of flooding over 30 yrs
- 0.0%
- Est. flood insurance / yr
- $507 – $1,088
Fire risk 4/10 · Minor
- Est. fire insurance / yr
- $947 – $1,759
Heat risk 10/10 · Severe
- Hot days now (above 107°F)
- 7 days/yr
- Hot days in 30 yrs
- 23 days/yr
Wind risk 10/10 · Severe
- Chance of severe wind over 30 yrs
- 99.0%
Air-quality risk 1/10 · Minimal
- Unhealthy air days now
- 0 days/yr
- Unhealthy air days in 30 yrs
- 0 days/yr
Risk factors via First Street. Map © Google.
Why this score? — see what drove the D grade
The composite is a weighted blend of 9 inputs, each scored 0–100. Each bar is that input's sub-score; the figure is the points it added to the 100-point composite (weight × sub-score).
- Cash flow +15.7/30.0
- 1% rule +8.8/10.0
- DSCR +4.9/10.0
- Livability +3.9/5.0
- Schools +3.7/10.0
- Rent growth +2.5/5.0
- Condition / age +2.5/5.0
- ARV discount +2.3/15.0
- Appreciation +0.0/10.0
$155,900
🖨 Deal sheet 📄 Offer letter ✓ Due diligence
Key facts
- 8,712 sq ft lot
- Garage
- Community pool
Property features AI
Finance
- Financial info: Pets allowed
- HOA & community: Association: Wynn Corporation; Monthly association fee (about $667.40) covering common areas, insurance and grounds maintenance; Community amenities: clubhouse, fitness center, golf, tennis courts, pickleball, shuffleboard, pool, property manager on-site
Exterior
- Parking: Garage with garage door opener (1-car)
- Security: Smoke detector(s)
- Utilities: Private water; Private sewer
- Home design: Single-story; Residential property
- Construction: Block, concrete and stucco construction; Shingle roof
- Exterior features: Enclosed porch; Porch; Covered patio; Screened porch; Rain gutters; Pool (community); Lake/pond view; Has view; Faces southwest; Less than quarter acre lot (approximately 0.2 acres; 52 x 110)
Interior
- Kitchen: Range; Microwave; Refrigerator; Dishwasher; Electric water heater
- Bedrooms: Bedroom, 12 x 12; Bedroom, 17 x 14
- Flooring: Laminate; Tile
- Bathrooms: 2 full bathrooms
- Heating & cooling: Central heating; Central air conditioning
- Interior features: Blinds; Sliding doors; Furnishing negotiable; Split bedrooms; Walk-in closet(s)
- Laundry & utility: Laundry room; Washer; Dryer
Neighborhood map
What this means for you Summary
Snapshot
- This is a 2-bed/2.0-bath single-family listed at $156k.
Deal economics
- At list price, monthly cash flow is $70 ($837/yr) — positive.
- The deal already cash-flows at list — no discount required.
- Meets the 1% rule at list price ($2k rent vs $156k).
- Recommended offer: $137k (12.0% below list) — sets the bar for market timing.
- Cap rate 6.8% vs local median 4.3% in Vero Beach South — top-decile yield for the area; either an underpriced asset or a hidden risk that comps aren't pricing in. Stress-test before assuming the spread holds.
Location & tenants
- Location reads 78/100 on livability (#163 in FL, #2,445 nationally) — a middle-class / working-renter tenant base. Strengths: commute A+, housing A+, health & safety A; Watch: amenities F.
- St. Lucie (urban): math 40% / reading 48% proficiency, ranked #51 of 73 in FL (top 70%) — families likely to look elsewhere, expect single-tenant / working-renter base with shorter leases.
- Market conditions: 292 active listings in the ZIP; 1 comparable units currently listed for rent nearby; 4,868 units permitted in St. Lucie County in 2024 (268 in 5+ unit buildings).
- This rent runs 41% of the median local income ($63k/yr) — at the standard rent-burdened threshold; future hikes will face affordability resistance.
Forward outlook
- Local home prices are declining (-3.0%/yr); year-one equity from $1k of loan paydown is wiped out by about $5k of value loss. Plan a longer hold.
- St. Lucie County population projected at +20% by 2050 — long-run rental-demand tailwind backs the buy-and-hold thesis.
Negotiation context
- It's been on market 219 days — a 12% lower offer ($137k) is reasonable based on typical stale-listing flexibility.
- 3 sale attempts since 3y ago; this cycle's ask has dropped $13k (8%) from the opening price — seller is motivated, your offer sets the floor, not the list.
Risks & watch-outs
- Watch-outs: HOA is 31% of rent.
- Climate carrying-cost: severe wind risk, 99% chance of damaging wind over 30y; extreme-heat days projected 7→23/yr by 2055 (HVAC capex compounding) — expect insurance premiums to compound above CPI over the hold.
Questions for the listing agent
- It's been on market 219 days. Have you received any prior offers? Is the seller open to a 12% concession, seller financing, or rate buy-down credit?
- What does the HOA fee cover, when was the last increase, and are there any pending special assessments or reserve-fund shortfalls?
- Why hasn't it sold? Are there any deal-killer items the seller is aware of (foundation, flood, title, zoning, code violations)?
- Is there a deadline driving the sale (1031 exchange, divorce, estate, relocation)? That informs how much negotiation room exists.
- The area grade is low — what's the realistic commute time and amenity access for the typical tenant pool here? Any planned neighborhood developments (good or bad) we should know about?
- What's the average days-on-market for RENTAL listings here right now (not sales)? A rising rental-DOM trend means longer vacancies and softer asking-rent achievability than the comps imply.
- What's the recent tenant-quality profile in this submarket — average credit score on applications, eviction rate, late-payment / NSF rate, and stable-employment percentage? A property-management company in the area should have these aggregated.
- How much new for-sale + rental construction is in the pipeline within 1–3 miles? Heavy new supply typically softens prices + rents 12–24 months out; constrained supply supports both.
Investment metrics
- 1% rule
- 1.38% ✓
- Cap rate
- 6.83%
- Cash-on-cash
- 1.92%
- DSCR
- 1.09
- GRM
- 6.0
CMA / ARV
- ARV (on-the-fly)
- $139,814
- Comps found
- 9
Show comp detail 9 sales within ~0.75 mi
| Address | Dist | Beds/Ba | Sqft | Sold | Price | $/sf | Match |
|---|---|---|---|---|---|---|---|
| 14381 Amapola Cir | 0.05mi | 2/2.0 | 1,351 (+2%) | 7mo | $123,000 | $91 | 88 |
| 6531 Teresita Ct | 0.44mi | 2/2.0 | 1,403 (+6%) | 1mo | $142,500 | $102 | 68 |
| 13951 Brazil Ct | 0.49mi | 1/1.5 (-1) | 1,310 (-1%) | 17mo | $229,000 | $175 | 55 |
| 14126 Cisne Cir | 0.43mi | 2/2.0 | 1,487 (+13%) | 7mo | $150,000 | $101 | 53 |
| 6763 Mar Pacifico | 0.65mi | 2/2.0 | 1,451 (+10%) | 4mo | $154,000 | $106 | 50 |
| 14434 Azucena Ct | 0.31mi | 2/2.0 | 1,487 (+13%) | 24mo | $170,000 | $114 | 45 |
| 6713 Gaviota | 0.65mi | 2/2.0 | 1,420 (+8%) | 16mo | $152,000 | $107 | 44 |
| 6737 Tulipan | 0.68mi | 2/2.0 | 1,135 (-14%) | 5mo | $124,000 | $109 | 41 |
| 6725 Tulipan | 0.66mi | 2/2.0 | 1,135 (-14%) | 10mo | $120,000 | $106 | 38 |
Match score weights: distance 35% · size 25% · config 20% · recency 20%. Top-matched comps best support the ARV.
Projected returns pro-forma
-3.0% appreciation · 3.0% rent growth · sell at horizon
- IRR
- -13.0%
- Equity multiple
- 0.53×
- Total profit
- $-20,445
- Equity at exit
- $23,245
- IRR
- -3.6%
- Equity multiple
- 0.76×
- Total profit
- $-10,561
- Equity at exit
- $13,479
Cash invested: $43,652 (down + closing). Projections, not guarantees.
Landlord ↔ Tenant lean methodology
- Overall (STATE)
- 87 Strongly Landlord-Friendly
- State Florida
- 87 Strongly Landlord-Friendly · R+3
- County
- — inherits STATE
- City
- — inherits STATE
ZIP-level market 34951
- Home prices YoY
- -23.6%
- Active inventory
- 292
- Price-to-rent
- 6.0×
Monthly cashflow live
- Estimated rent
- $2,156 medium interval (Pro) →
- Mortgage (P&I)
- −$818
- Tax from tax record
- −$84 /mo · $1,011/yr
- Insurance
- −$65
- HOA
- −$667
- Vacancy / Maint / Mgmt
- −$453
- Net cashflow
- $70
Break-even live
UW: 25.0% down · 7.5% · 30yr · 1.5% tax · 5.0% vac · 8.0% maint · 8.0% mgmt
Financing live
Cash to close
- Down payment
- $38,975
- Closing costs
- $4,677
- Reserves months
- —
- Total cash needed
- —
Loan-product check · same deal, 3 products live
Conventional
25% down · 7.5% · 30yr
- Down + closing
- —
- Monthly P&I
- —
- Monthly cashflow
- —
- DSCR
- —
- Eligible?
- —
Personal DTI + credit; lowest rate.
DSCR
20% down · 8.5% · 30yr
- Down + closing
- —
- Monthly P&I
- —
- Monthly cashflow
- —
- DSCR
- —
- Eligible?
- —
No personal income docs; deal must DSCR.
Hard money
10% down · 12.0% · 12mo
- Down + closing
- —
- Monthly P&I
- —
- Monthly cashflow
- —
- DSCR
- —
- Eligible?
- —
Short-term bridge; refi at stabilization.
Rent comps 1 comps
| Address | Beds | Baths | Sqft | Rent | $/sqft | DOM | Units | Dist |
|---|---|---|---|---|---|---|---|---|
| 6765 Spanish Lakes Blvd Fort Pierce, FL | 2.0 | 2.0 | 1368 | $2,500 | $1.83 | 23d | 1 | 0.65mi |
HOA detail
- Monthly dues
- $667 · $8,004/yr
Listing history 34 events
-
2026-06-18days on market $155,900 Active 219 DOM
-
2026-06-17days on market $155,900 Active 218 DOM
-
2026-06-16days on market $155,900 Active 217 DOM
-
2026-06-15days on market $155,900 Active 216 DOM
-
2026-06-14days on market $155,900 Active 214 DOM
-
2026-06-13days on market $155,900 Active 213 DOM
-
2026-06-10days on market $155,900 Active 211 DOM
-
2026-06-09days on market $155,900 Active 210 DOM
-
2026-06-08days on market $155,900 Active 209 DOM
-
2026-06-07days on market $155,900 Active 208 DOM
-
2026-06-05days on market $155,900 Active 205 DOM
-
2026-06-03days on market $155,900 Active 204 DOM
-
2026-06-02days on market $155,900 Active 203 DOM
-
2026-06-01days on market $155,900 Active 202 DOM
-
2026-05-31days on market $155,900 Active 201 DOM
-
2026-05-30days on market $155,900 Active 200 DOM
-
2026-04-24price $155,900
-
2026-04-24price $155,900
-
2026-01-30price $159,900
-
2026-01-30price $159,900
-
2026-01-30price $159,900
-
2026-01-21price $168,000
-
2026-01-21price $168,000
-
2026-01-21price $168,000
-
2025-11-13$169,000 Active
-
2025-11-11$169,000 Active
-
2025-10-30historical $169,000
-
2023-05-22soldstatus $177,000
-
2023-05-19historical
-
2023-05-17soldstatus $177,000 Closed
-
2023-04-19historical Active Under Contract
-
2023-02-03$180,000 Active
-
2023-02-02historical $180,000
-
2015-04-07soldstatus $44,000
ⓘ Source: listings_history table (triggers on properties + properties_extension) + one-shot
backfill from property_details.listing_events for pre-trigger history.
Tax reassessment forecast FL · Resets to sale price
- Current annual tax
- $1,011 · $84/mo
- Projected year-2 tax
- $1,294 · $108/mo
- Expected delta
- +$283/yr (+$24/mo · 28.0%)
ⓘ Screening estimate from a state-policy table — verify with the county assessor before closing.
Climate risk First Street
- Flood 1/10 Low FEMA zone X (unshaded) · 0% chance over 30 yrs
- Wildfire 4/10 Moderate
- Heat 10/10 Extreme 7 d/yr ≥107°F today · 23 d/yr by 30 yrs out
- Wind 10/10 Extreme 99% chance of damaging wind over 30 yrs
- Air quality 1/10 Low 0 unhealthy d/yr today · 0 by 30 yrs out
Nearby sold comps map
Loading sold comps map…
Walkable amenities ~0.75 mi
Loading nearby amenities…
Taxation est. · year 1
- Rental income
- $25,876
- − Mortgage interest
- −$8,733
- − Property taxes
- −$1,011
- − Insurance
- −$780
- − Repairs & maintenance
- −$2,070
- − Management
- −$2,070
- − HOA
- −$8,004
- − Depreciation
- −$4,535
- Taxable loss
- −$1,326
- Est. tax savings @ 24.0%
- +$318
- After-tax cash flow
- $1,155/yr
For passive investors: Depreciation is non-cash, so a rental often shows a tax loss while cash-flowing — sheltering income. Rental losses are passive: they offset passive income freely, and up to $25,000/yr can offset ordinary (W-2) income if you actively participate and your MAGI is under $100k (phasing out to $0 by $150k); unused losses carry forward. On sale, claimed depreciation is recaptured at up to 25%, and gains may owe capital-gains tax (a 1031 exchange can defer both). Figures are a year-1 estimate at your 24.0% rate — not tax advice; consult a CPA.
Schools (NCES district)
- District
- St. Lucie
- NCES district ID
- 1201770
- Math proficiency
- 40% ▼ -11.00%
- Reading proficiency
- 48% ▼ -4.00%
- Median HH income
- $44,737
- Composite
- 37.28/100
- National rank
- #4449
- State rank
- #51 of 73 in FL
Livability — Vero Beach South
- Score
- 78/100
- State rank
- #163
- US rank
- #2445
Category grades
Schools grade is shown separately in the Schools card above.
Census & demographics
- County
- Saint Lucie County · 337,150 people
- Metro
- Port St. Lucie, FL
- Population (ZIP)
- 17,148
- Household income
- $63,122
- Rent vs Own
- Severe rent burden
- 140.0
Population outlook (St. Lucie County) Hauer SSP2
- Today (2025)
- 338,016 people
- By 2030
- 355,687 · +5.2%
- By 2040
- 385,521 · +14.1%
- By 2050
- 406,106 · +20.1%
- By 2075
- 441,054 · +30.5%
- By 2100
- 436,885 · +29.2%
Race, ethnicity, and origin ACS 2023
- Neighborhood character
- Predominantly White (74%)
- Race & ethnicity
- White 74% Black 13% Hispanic / Latino 8% Two or more races 7% Asian 2%
- Hispanic origin (detail)
- Mexican 2% Puerto Rican 2% Cuban 2%
- Common ancestry
- Romanian 3% Italian 2% Lithuanian 2%
- Foreign-born
- 10% · Canada, Jamaica, Vietnam
- Languages at home
- 88% English-only · Spanish 7% French/Haitian/Cajun 3% Vietnamese 1%
Political lean MEDSL · St. Lucie
- 2024 margin
- Lean R (+9.1) · D 45.1% · R 54.2%
- 2008→2024 swing
- -21.2pp toward R · 2008: 12.1pp · 2024: -9.1pp
- All cycles
- 2024: R+9.1 2020: R+1.6 2016: R+2.5 2012: D+7.9 2008: D+12.1
Not yet ingested
- Civics
- —
Market trends
- HPI YoY
- ▼ -106.06%
- Current HPI
- 343.1376
- Rent YoY
- —
- Metro
- Port St. Lucie, FL
- State GDP YoY
- ▲ 3.28%
- F500 in state
- 36
Industry mix (Fortune 500 HQ in FL)
| Industry | F500 HQs | Revenue |
|---|---|---|
| Industrial Technology | 2 | $29B |
|
||
| Insurance | 2 | $17B |
|
||
| Retail | 1 | $60B |
|
||
| Technology Distribution | 1 | $58B |
|
||
| Homebuilding | 1 | $35B |
|
||
| Technology Manufacturing | 1 | $35B |
|
||
Price history
+254.3% since first listed18 events — show timeline
- 2026-04-24 Price Changed $155,900 SCMLS
- 2026-04-24 Price Changed $155,900 RAIRCMLS
- 2026-01-30 Price Changed $159,900 Beaches MLS
- 2026-01-30 Price Changed $159,900 SCMLS
- 2026-01-30 Price Changed $159,900 RAIRCMLS
- 2026-01-21 Price Changed $168,000 Beaches MLS
- 2026-01-21 Price Changed $168,000 SCMLS
- 2026-01-21 Price Changed $168,000 RAIRCMLS
- 2025-11-13 Listed $169,000 SCMLS
- 2025-11-11 Listed $169,000 RAIRCMLS
- 2025-10-30 Coming Soon $169,000 RAIRCMLS
- 2023-05-22 Sold (Public Records) $177,000 Public Records
- 2023-05-19 Listing Removed — Beaches MLS
- 2023-05-17 Sold (MLS) $177,000 Beaches MLS
- 2023-04-19 Contingent — Beaches MLS
- 2023-02-03 Listed $180,000 Beaches MLS
- 2023-02-02 Coming Soon $180,000 Beaches MLS
- 2015-04-07 Sold (Public Records) $44,000 Public Records
Property tax history
-2.5%/yrLatest (2025): $1,011 · +4.6% YoY. Source: county tax records.
Cash-flow waterfall
monthlySold comps — $/sqft
last 12 mo · ≤1 miLoading sold comps…