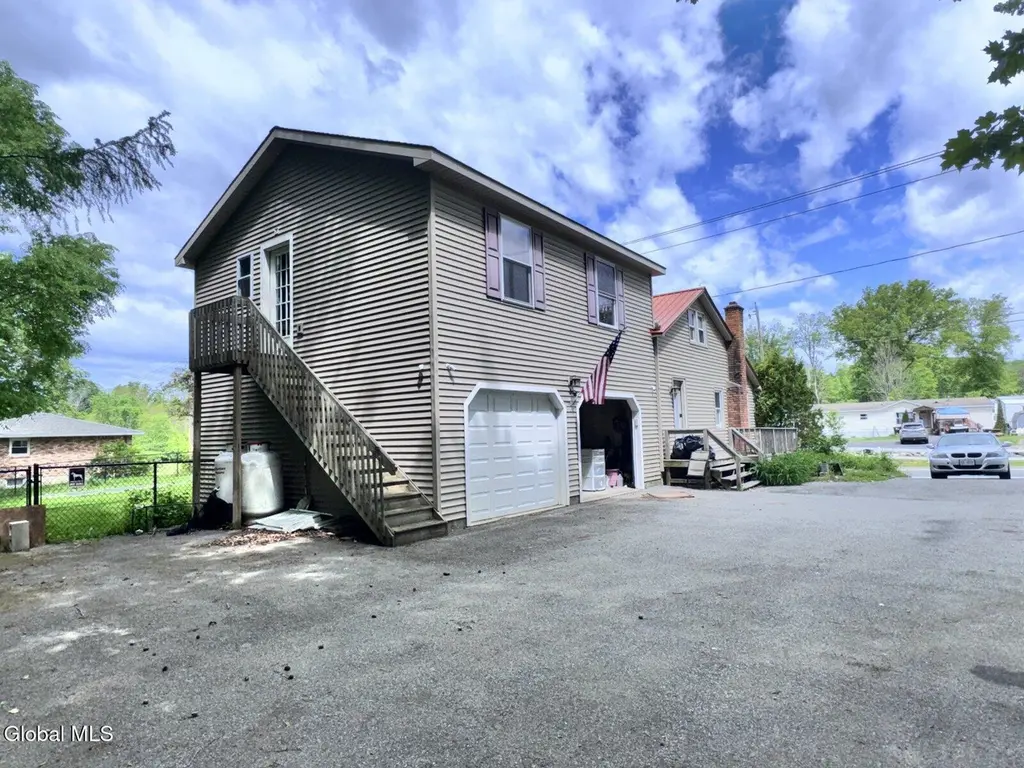
716 Route 29 · Milton, NY
Flood risk 1/10 · Minimal
- FEMA flood zone
- X
- Chance of flooding over 30 yrs
- 0.0%
- Est. flood insurance / yr
- $507 – $1,088
Fire risk 4/10 · Minor
- Est. fire insurance / yr
- $691 – $1,283
Heat risk 2/10 · Minimal
- Hot days now (above 96°F)
- 7 days/yr
- Hot days in 30 yrs
- 16 days/yr
Wind risk 2/10 · Minimal
- Chance of severe wind over 30 yrs
- 4.0%
Air-quality risk 1/10 · Minimal
- Unhealthy air days now
- 0 days/yr
- Unhealthy air days in 30 yrs
- 0 days/yr
Risk factors via First Street. Map © Google.
Why this score? — see what drove the F grade
The composite is a weighted blend of 9 inputs, each scored 0–100. Each bar is that input's sub-score; the figure is the points it added to the 100-point composite (weight × sub-score).
- Appreciation +8.9/10.0
- Cash flow +7.0/30.0
- Schools +4.8/10.0
- Livability +3.3/5.0
- 1% rule +2.7/10.0
- Rent growth +2.5/5.0
- Condition / age +2.5/5.0
- DSCR +1.2/10.0
- ARV discount +0.0/15.0
$175,000
🖨 Deal sheet (PDF) 📄 Offer letter ✓ Due diligence
Listing remarks MLS
You won't find a nicer starter home than this! New vinyl siding, windows, kitchen cabinets, appliances, countertops, faucets, lighting fixtures, hardwood floors, carpeting and more. Showings begin Tuesday, November 1st. Seller is husband of listing Broker. Open House Sunday 11/20 1-3 -- Excellent Condition
Key facts
- Generac generator
- Rehab ready home
- 0.38 acre lot
Tags
Property features AI
Exterior
- Parking: Attached 2-car garage; 2 total parking spaces
- Utilities: Septic tank
- Home design: Single family residence
- Construction: Vinyl siding
- Exterior features: Metal and shingle roof; Other exterior features
Interior
- Kitchen: Oven; Range; Refrigerator
- Bedrooms: Two bedrooms on the second level
- Bathrooms: One full bathroom on the first level
- Heating & cooling: Forced-air heating (propane); Has cooling (other)
- Interior features: 7 total rooms; Full, unfinished basement; Other interior features
- Laundry & utility: Laundry (other - unspecified location)
Neighborhood map
What this means for you Summary
Snapshot
- This is a 2-bed/1.0-bath single-family listed at $175k.
Deal economics
- At list price, monthly cash flow is $-256 ($-3k/yr) — negative.
- To cash-flow at today's rent, offer at most $130k (25.8% below list).
- To meet the 1% rule (rent ≥ 1% of price), the offer needs to be $135k (22.8% below list).
- Recommended offer: $130k (25.8% below list) — sets the bar for cash-flow.
- Cap rate 4.5% vs local median 2.4% in Milton — top-decile yield for the area; either an underpriced asset or a hidden risk that comps aren't pricing in. Stress-test before assuming the spread holds.
Location & tenants
- Location reads 66/100 on livability (#652 in NY) — a middle-class / working-renter tenant base. Strengths: employment A+, housing A+, crime B+; Watch: amenities F, commute F, cost of living D-.
- Ballston Spa Central School District (suburban): math 54% / reading 55% proficiency, ranked #289 of 590 in NY (top 49%) — acceptable for families but not a draw, mixed tenant base, ~2y average lease.
- Zoned schools: Ballston Spa Senior High School (math 92% / reading 64%, grade A-, #568 of 1,100 statewide, top 52%, 1,249 students, 32% FRL).
- Zoned-school proficiency averages 78% at this address vs 54% district-wide (+24 pts) — the actual schools serving this property are materially stronger than the Ballston Spa Central School District average implies; a family-tenant draw the district grade alone would hide.
- Market conditions: 14 active listings in the ZIP; 1,132 units permitted in Saratoga County in 2024 (378 in 5+ unit buildings).
Forward outlook
- In year one you build about $15k of equity ($1k loan paydown + $14k appreciation (7.7% local appreciation)).
- Saratoga County population projected at +4% by 2050 — modest demand growth; plan on rents tracking national, not racing it.
- By year 3, paydown + projected appreciation supports a ~$37k cash-out refi (75% LTV) — recoverable capital for the next deal without selling this one.
Negotiation context
- Only 8 days on market — expect competitive offers; lowballing is unlikely to land.
- 2 sale attempts since 21y ago with the ask held roughly flat each time — persistent listings suggest the price (not the market) is what's stuck; bring a comps-based counter.
- Current owner paid $110k; list at $175k implies a 59% gain — meaningful room to come down on a strong offer.
Risks & watch-outs
- Watch-outs: built in 1950 — expect roof / HVAC / electrical / plumbing capex.
Questions for the listing agent
- What do current leases actually rent for vs. the listed asking? Can we see a recent rent roll and the last 12 months of T-12 income?
- Built in 1950 — when were the roof, HVAC, electrical panel, plumbing, and water heater last replaced?
- Is there a deadline driving the sale (1031 exchange, divorce, estate, relocation)? That informs how much negotiation room exists.
- The area grade is low — what's the realistic commute time and amenity access for the typical tenant pool here? Any planned neighborhood developments (good or bad) we should know about?
- What's the average days-on-market for RENTAL listings here right now (not sales)? A rising rental-DOM trend means longer vacancies and softer asking-rent achievability than the comps imply.
- What's the recent tenant-quality profile in this submarket — average credit score on applications, eviction rate, late-payment / NSF rate, and stable-employment percentage? A property-management company in the area should have these aggregated.
- How much new for-sale + rental construction is in the pipeline within 1–3 miles? Heavy new supply typically softens prices + rents 12–24 months out; constrained supply supports both.
Investment metrics
- 1% rule
- 0.77% ✗
- Cap rate
- 4.54%
- Cash-on-cash
- -6.27%
- DSCR
- 0.72
- GRM
- 10.8
CMA / ARV
- ARV (on-the-fly)
- $146,932
- Comps found
- 1
Show comp detail 1 sale within ~0.75 mi
| Address | Dist | Beds/Ba | Sqft | Sold | Price | $/sf | Match |
|---|---|---|---|---|---|---|---|
| 708 Route 29 | 0.09mi | 2/1.0 | 1,160 (-14%) | 22mo | $126,000 | $109 | 54 |
Match score weights: distance 35% · size 25% · config 20% · recency 20%. Top-matched comps best support the ARV.
Projected returns pro-forma
7.72% appreciation · 3.0% rent growth · sell at horizon
- IRR
- 14.6%
- Equity multiple
- 2.08×
- Total profit
- $52,793
- Equity at exit
- $129,672
- IRR
- 14.5%
- Equity multiple
- 4.38×
- Total profit
- $165,408
- Equity at exit
- $254,331
Cash invested: $49,000 (down + closing). Projections, not guarantees.
Landlord ↔ Tenant lean methodology
- Overall (STATE)
- 15 Strongly Tenant-Friendly
- State New York
- 15 Strongly Tenant-Friendly · D+10
- County
- — inherits STATE
- City
- — inherits STATE
ZIP-level market 12863
- Home prices YoY
- 2.5%
- Active inventory
- 14
- Price-to-rent
- 10.8×
Monthly cashflow live
- Estimated rent
- $1,350 medium interval (Pro) →
- Mortgage (P&I)
- −$918
- Tax from tax record
- −$332 /mo · $3,986/yr
- Insurance
- −$73
- HOA
- −$0
- Vacancy / Maint / Mgmt
- −$284
- Net cashflow
- $-256
Break-even live
Sensitivity live
| Price | -10% $-157 | -5% $-206 | +0% $-256 | +5% $-306 | +10% $-355 |
|---|---|---|---|---|---|
| Rent | -10% $-363 | -5% $-309 | +0% $-256 | +5% $-203 | +10% $-149 |
| Rate | -1.0pp $-168 | -0.5pp $-211 | base $-256 | +0.5pp $-301 | +1.0pp $-347 |
UW: 25.0% down · 7.5% · 30yr · 1.5% tax · 5.0% vac · 8.0% maint · 8.0% mgmt
Financing live
Cash to close
- Down payment
- $43,750
- Closing costs
- $5,250
- Reserves months
- —
- Total cash needed
- —
Loan-product check · same deal, 3 products live
Conventional
25% down · 7.5% · 30yr
- Down + closing
- —
- Monthly P&I
- —
- Monthly cashflow
- —
- DSCR
- —
- Eligible?
- —
Personal DTI + credit; lowest rate.
DSCR
20% down · 8.5% · 30yr
- Down + closing
- —
- Monthly P&I
- —
- Monthly cashflow
- —
- DSCR
- —
- Eligible?
- —
No personal income docs; deal must DSCR.
Hard money
10% down · 12.0% · 12mo
- Down + closing
- —
- Monthly P&I
- —
- Monthly cashflow
- —
- DSCR
- —
- Eligible?
- —
Short-term bridge; refi at stabilization.
Listing history 7 events
-
2026-06-07statusdays on market $175,000 Pending 8 DOM
-
2026-06-03days on market $175,000 Active 5 DOM
-
2026-06-02days on market $175,000 Active 4 DOM
-
2026-06-01days on market $175,000 Active 3 DOM
-
2026-05-31days on market $175,000 Active 2 DOM
-
2026-05-31remarks 518-char remark
-
2026-05-31$175,000 Active 1 DOM
ⓘ Source: listings_history table (triggers on properties + properties_extension) + one-shot
backfill from property_details.listing_events for pre-trigger history.
Tax reassessment forecast NY · Partial reset (capped growth)
- Current annual tax
- $3,986 · $332/mo
- Projected year-2 tax
- $3,986 · $332/mo
- Expected delta
- $0/yr ($0/mo · 0.0%)
ⓘ Screening estimate from a state-policy table — verify with the county assessor before closing.
Climate risk First Street
- Flood 1/10 Low FEMA zone X · 0% chance over 30 yrs
- Wildfire 4/10 Moderate
- Heat 2/10 Low 7 d/yr ≥96°F today · 16 d/yr by 30 yrs out
- Wind 2/10 Low 4% chance of damaging wind over 30 yrs
- Air quality 1/10 Low 0 unhealthy d/yr today · 0 by 30 yrs out
Nearby sold comps map
Loading sold comps map…
Walkable amenities ~0.75 mi
Loading nearby amenities…
Taxation est. · year 1
- Rental income
- $16,205
- − Mortgage interest
- −$9,803
- − Property taxes
- −$3,986
- − Insurance
- −$875
- − Repairs & maintenance
- −$1,296
- − Management
- −$1,296
- − Depreciation
- −$5,091
- Taxable loss
- −$6,143
- Est. tax savings @ 24.0%
- +$1,474
- After-tax cash flow
- $-1,598/yr
For passive investors: Depreciation is non-cash, so a rental often shows a tax loss while cash-flowing — sheltering income. Rental losses are passive: they offset passive income freely, and up to $25,000/yr can offset ordinary (W-2) income if you actively participate and your MAGI is under $100k (phasing out to $0 by $150k); unused losses carry forward. On sale, claimed depreciation is recaptured at up to 25%, and gains may owe capital-gains tax (a 1031 exchange can defer both). Figures are a year-1 estimate at your 24.0% rate — not tax advice; consult a CPA.
Schools (NCES district)
- District
- Ballston Spa Central School District
- NCES district ID
- 3603930
- Math proficiency
- 54% ▼ -13.00%
- Reading proficiency
- 55% ▼ -4.00%
- Median HH income
- $66,705
- Composite
- 48.12/100
- National rank
- #2184
- State rank
- #289 of 590 in NY
Livability — Milton
- Score
- 66/100
- State rank
- #652
- US rank
- #11825
Category grades
Schools grade is shown separately in the Schools card above.
Census & demographics
- Population (ZIP)
- 870
Population outlook (Saratoga County) Hauer SSP2
- Today (2025)
- 238,889 people
- By 2030
- 243,681 · +2.0%
- By 2040
- 249,118 · +4.3%
- By 2050
- 248,638 · +4.1%
- By 2075
- 241,675 · +1.2%
- By 2100
- 213,150 · -10.8%
Race, ethnicity, and origin ACS 2023
- Neighborhood character
- Predominantly White (99%)
- Race & ethnicity
- White 99% Hispanic / Latino 1%
- Common ancestry
- Portuguese 9% Italian 6% Romanian 2%
Political lean MEDSL · Saratoga
- 2024 margin
- Toss-up / Even · D 50.9% · R 49.1%
- 2008→2024 swing
- -1.6pp toward R · 2008: 3.4pp · 2024: 1.8pp
- All cycles
- 2024: D+1.8 2020: D+5.4 2016: R+4.4 2012: D+2.1 2008: D+3.4
Not yet ingested
- Civics
- —
Market trends
- HPI YoY
- ▲ 7.72%
- Current HPI
- 320.2866
- Rent YoY
- —
- Metro
- —
- State GDP YoY
- ▲ 2.60%
- F500 in state
- 92
Industry mix (Fortune 500 HQ in NY)
| Industry | F500 HQs | Revenue |
|---|---|---|
| Financial Services | 10 | $950B |
|
||
| Consumer Goods | 9 | $162B |
|
||
| Insurance | 4 | $225B |
|
||
| Telecommunications | 2 | $144B |
|
||
| Pharmaceuticals | 2 | $112B |
|
||
| Media / Entertainment | 2 | $69B |
|
||
Price history
+483.3% since first listed6 events — show timeline
- 2026-05-29 Listed $175,000 Global MLS
- 2006-01-12 Sold (Public Records) $110,000 Public Records
- 2005-12-23 Sold (MLS) $110,000 Global MLS
- 2005-11-21 Listing Removed — Global MLS
- 2005-10-25 Listed $114,500 Global MLS
- 2005-10-19 Sold (Public Records) $30,000 Public Records
Property tax history
+7.5%/yrLatest (2025): $3,986 · +2.1% YoY. Source: county tax records.
Cash-flow waterfall
monthlySold comps — $/sqft
last 12 mo · ≤1 miLoading sold comps…