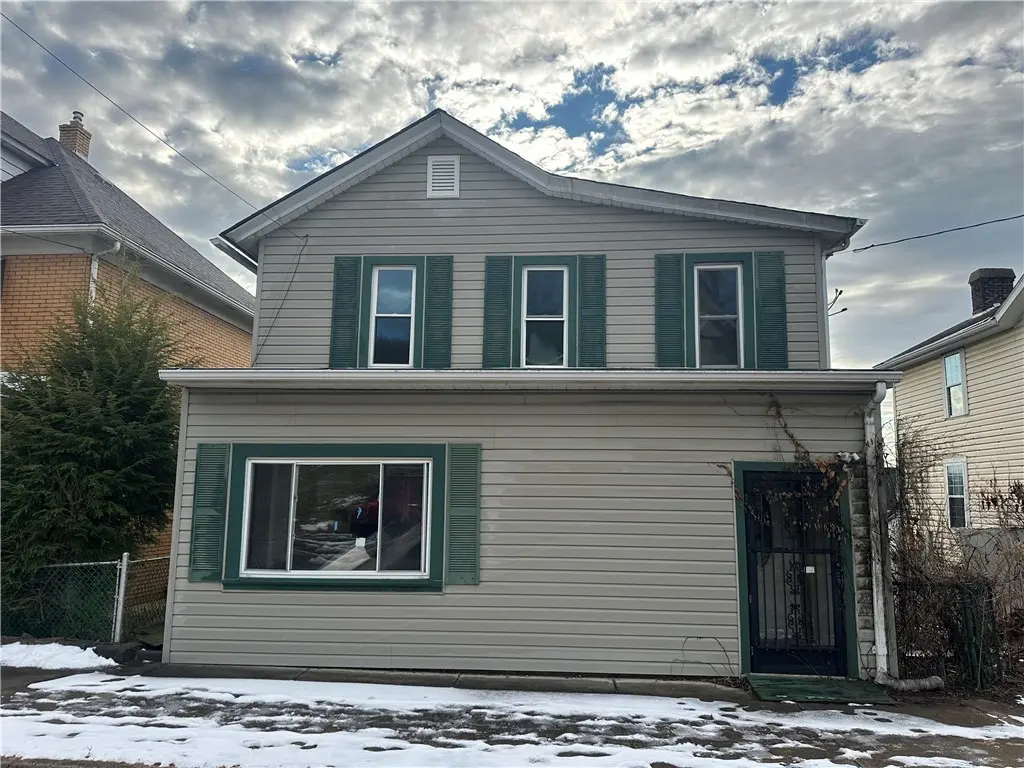
305 W 9th Ave · Tarentum, PA
Flood risk 1/10 · Minimal
- FEMA flood zone
- X (unshaded)
- Chance of flooding over 30 yrs
- 0.0%
- Est. flood insurance / yr
- $473 – $860
Fire risk 1/10 · Minimal
- Est. fire insurance / yr
- $511 – $949
Heat risk 4/10 · Minor
- Hot days now (above 97°F)
- 8 days/yr
- Hot days in 30 yrs
- 20 days/yr
Wind risk 2/10 · Minimal
- Chance of severe wind over 30 yrs
- —
Air-quality risk 4/10 · Minor
- Unhealthy air days now
- 5 days/yr
- Unhealthy air days in 30 yrs
- 6 days/yr
Risk factors via First Street. Map © Google.
Why this score? — see what drove the A- grade
The composite is a weighted blend of 9 inputs, each scored 0–100. Each bar is that input's sub-score; the figure is the points it added to the 100-point composite (weight × sub-score).
- Cash flow +30.0/30.0
- ARV discount +15.0/15.0
- DSCR +10.0/10.0
- 1% rule +9.3/10.0
- Appreciation +5.2/10.0
- Livability +4.0/5.0
- Schools +3.3/10.0
- Rent growth +2.5/5.0
- Condition / age +2.5/5.0
$80,000
🖨 Deal sheet 📄 Offer letter ✓ Due diligence
Listing remarks MLS
INVESTOR SPECIAL! Complete the renovations and customize this large home to your desired style. Home has great bones, a unique layout, a full basement, and a fenced-in back yard with a view! Great location on a friendly street with sidewalks. Close to Rt. 28, Pittsburgh Mills, and 20 minutes to the City of Pittsburgh.
Key facts
- Fenced-in back yard
- Great location
- Unique layout
Tags
Neighborhood map
What this means for you Summary
Snapshot
- This is a 3-bed/1.5-bath single-family listed at $80k.
Deal economics
- At list price, monthly cash flow is $303 ($4k/yr) — positive.
- The deal already cash-flows at list — no discount required.
- Meets the 1% rule at list price ($1k rent vs $80k).
- Recommended offer: $70k (12.0% below list) — sets the bar for market timing.
Location & tenants
- Location reads 79/100 on livability (#240 in PA, #2,066 nationally) — a middle-class / working-renter tenant base. Strengths: commute A+, cost of living A+, housing A+; Watch: schools C-, amenities F, employment F.
- Highlands SD (suburban): math 29% / reading 48% proficiency, ranked #376 of 539 in PA (top 70%) — families likely to look elsewhere, expect single-tenant / working-renter base with shorter leases.
- Market conditions: 39 active listings in the ZIP; 4 comparable units currently listed for rent nearby; rentals lingering (median 44d on market — plan ~5-8 weeks vacancy on turnover, expect pricing pressure); 50% of comp listings sitting > 30 days — soft ceiling on asking rent; 2,996 units permitted in Allegheny County in 2024 (1,588 in 5+ unit buildings).
Forward outlook
- In year one you build about $916 of equity ($553 loan paydown + $363 appreciation (0.5% local appreciation)).
- At projected returns (0.5% appreciation + 3.0% rent growth), your $22k cash investment doubles in ~5 years — after that, you're playing with house money.
Negotiation context
- It's been on market 164 days — a 12% lower offer ($70k) is reasonable based on typical stale-listing flexibility.
- 4 sale attempts since 5y ago with the ask held roughly flat each time — persistent listings suggest the price (not the market) is what's stuck; bring a comps-based counter.
- Current owner paid $37k; list at $80k implies a 116% gain — meaningful room to come down on a strong offer.
Risks & watch-outs
- Watch-outs: built in 1900 — expect roof / HVAC / electrical / plumbing capex.
Questions for the listing agent
- It's been on market 164 days. Have you received any prior offers? Is the seller open to a 12% concession, seller financing, or rate buy-down credit?
- Built in 1900 — when were the roof, HVAC, electrical panel, plumbing, and water heater last replaced?
- Why hasn't it sold? Are there any deal-killer items the seller is aware of (foundation, flood, title, zoning, code violations)?
- Is there a deadline driving the sale (1031 exchange, divorce, estate, relocation)? That informs how much negotiation room exists.
- What's the average days-on-market for RENTAL listings here right now (not sales)? A rising rental-DOM trend means longer vacancies and softer asking-rent achievability than the comps imply.
- What's the recent tenant-quality profile in this submarket — average credit score on applications, eviction rate, late-payment / NSF rate, and stable-employment percentage? A property-management company in the area should have these aggregated.
- How much new for-sale + rental construction is in the pipeline within 1–3 miles? Heavy new supply typically softens prices + rents 12–24 months out; constrained supply supports both.
Investment metrics
- 1% rule
- 1.43% ✓
- Cap rate
- 10.84%
- Cash-on-cash
- 16.25%
- DSCR
- 1.72
- GRM
- 5.8
CMA / ARV
- ARV (median comp)
- $100,864
- List price
- $80,000
- Delta
- -20.68%
- Verdict
- UNDERPRICED
- Comps
- 20 within 1.0 mi
Show comp detail 12 sales within ~0.75 mi
| Address | Dist | Beds/Ba | Sqft | Sold | Price | $/sf | Match |
|---|---|---|---|---|---|---|---|
| 126 W 8th Ave | 0.17mi | 3/2.0 | 1,953 (-2%) | 21mo | $167,000 | $86 | 70 |
| 417 W 8th Ave | 0.18mi | 3/2.0 | 1,760 (-11%) | 5mo | $43,000 | $24 | 67 |
| 410 W 8th Ave | 0.16mi | 3/2.0 | 1,691 (-15%) | 2mo | $62,500 | $37 | 64 |
| 422 W 8th Ave | 0.19mi | 3/1.5 | 1,690 (-15%) | 3mo | $151,000 | $89 | 64 |
| 313 E 9th Ave | 0.55mi | 3/2.0 | 1,851 (-7%) | 3mo | $75,000 | $41 | 59 |
| 326 E 9th Ave | 0.59mi | 4/1.5 (+1) | 1,934 (-3%) | 6mo | $50,000 | $26 | 58 |
| 911 Corbet St | 0.61mi | 3/2.0 | 1,950 (-2%) | 15mo | $205,000 | $105 | 54 |
| 200 Lock St | 0.58mi | 3/1.5 | 2,102 (+6%) | 18mo | $125,000 | $59 | 48 |
| 500 E 11th Ave | 0.68mi | 3/2.5 | 1,919 (-3%) | 13mo | $215,000 | $112 | 48 |
| 512 E 8th Ave | 0.70mi | 4/1.5 (+1) | 1,974 (-1%) | 17mo | $160,000 | $81 | 47 |
| 408 East 8th Ave | 0.65mi | 3/2.0 | 1,875 (-6%) | 19mo | $119,500 | $64 | 42 |
| 419 E 6th Ave | 0.71mi | 4/2.5 (+1) | 2,090 (+5%) | 12mo | $42,500 | $20 | 39 |
Match score weights: distance 35% · size 25% · config 20% · recency 20%. Top-matched comps best support the ARV.
Projected returns pro-forma
0.45% appreciation · 3.0% rent growth · sell at horizon
- IRR
- 16.9%
- Equity multiple
- 1.84×
- Total profit
- $18,741
- Equity at exit
- $25,061
- IRR
- 20.9%
- Equity multiple
- 3.40×
- Total profit
- $53,853
- Equity at exit
- $31,628
Cash invested: $22,400 (down + closing). Projections, not guarantees.
Landlord ↔ Tenant lean methodology
- Overall (STATE)
- 62 Landlord-Friendly
- State Pennsylvania
- 62 Landlord-Friendly · EVEN
- County
- — inherits STATE
- City
- — inherits STATE
ZIP-level market 15084
- Home prices YoY
- 0.2%
- Active inventory
- 39
- Price-to-rent
- 5.8×
Monthly cashflow live
- Estimated rent
- $1,141 medium interval (Pro) →
- Mortgage (P&I)
- −$420
- Tax from tax record
- −$145 /mo · $1,745/yr
- Insurance
- −$33
- HOA
- −$0
- Vacancy / Maint / Mgmt
- −$240
- Net cashflow
- $303
Break-even live
UW: 25.0% down · 7.5% · 30yr · 1.5% tax · 5.0% vac · 8.0% maint · 8.0% mgmt
Financing live
Cash to close
- Down payment
- $20,000
- Closing costs
- $2,400
- Reserves months
- —
- Total cash needed
- —
Loan-product check · same deal, 3 products live
Conventional
25% down · 7.5% · 30yr
- Down + closing
- —
- Monthly P&I
- —
- Monthly cashflow
- —
- DSCR
- —
- Eligible?
- —
Personal DTI + credit; lowest rate.
DSCR
20% down · 8.5% · 30yr
- Down + closing
- —
- Monthly P&I
- —
- Monthly cashflow
- —
- DSCR
- —
- Eligible?
- —
No personal income docs; deal must DSCR.
Hard money
10% down · 12.0% · 12mo
- Down + closing
- —
- Monthly P&I
- —
- Monthly cashflow
- —
- DSCR
- —
- Eligible?
- —
Short-term bridge; refi at stabilization.
Rent comps 4 comps
| Address | Beds | Baths | Sqft | Rent | $/sqft | DOM | Units | Dist |
|---|---|---|---|---|---|---|---|---|
| 424 W 7th Ave Unit 1 Tarentum, PA | 2.0 | 1.0 | 1632 | $1,000 | $0.61 | 43d | 1 | 0.18mi |
| 424 W 7th Ave Unit 2 Tarentum, PA | 3.0 | 1.0 | 1632 | $1,250 | $0.77 | 43d | 1 | 0.18mi |
| 875 1st Ave Brackenridge, PA | 3.0 | 2.0 | 1440 | $1,399 | $0.97 | 14d | 1 | 1.24mi |
| 300 Craigdell Rd New Kensington, PA | 3.0 | 2.0 | 1300 | $1,130 | $0.87 | 1d | 1 | 1.32mi |
Listing history 25 events
-
2026-06-18days on market $80,000 Active 164 DOM
-
2026-06-17days on market $80,000 Active 163 DOM
-
2026-06-16days on market $80,000 Active 162 DOM
-
2026-06-15days on market $80,000 Active 161 DOM
-
2026-06-13days on market $80,000 Active 159 DOM
-
2026-06-13days on market $80,000 Active 158 DOM
-
2026-06-09days on market $80,000 Active 155 DOM
-
2026-06-08days on market $80,000 Active 154 DOM
-
2026-06-07days on market $80,000 Active 153 DOM
-
2026-06-05days on market $80,000 Active 150 DOM
-
2026-06-03days on market $80,000 Active 149 DOM
-
2026-06-02days on market $80,000 Active 148 DOM
-
2026-06-01days on market $80,000 Active 147 DOM
-
2026-05-31days on market $80,000 Active 146 DOM
-
2026-01-05$80,000 Active 319-char remark
Show marketing remark (319 chars)
INVESTOR SPECIAL! Complete the renovations and customize this large home to your desired style. Home has great bones, a unique layout, a full basement, and a fenced-in back yard with a view! Great location on a friendly street with sidewalks. Close to Rt. 28, Pittsburgh Mills, and 20 minutes to the City of Pittsburgh.
-
2023-11-28price $74,999 163-char remark
Show marketing remark (163 chars)
Lots of potential at this 2 story colonial home. Ready to renovate, this home is situated not far from Route 28, it features large rooms and a desirable floor plan
-
2023-10-02$64,999 Active 163-char remark
Show marketing remark (163 chars)
Lots of potential at this 2 story colonial home. Ready to renovate, this home is situated not far from Route 28, it features large rooms and a desirable floor plan
-
2022-07-21status Pending
-
2022-07-08soldstatus $37,000 Closed
-
2022-05-11historical Contingent
-
2022-04-27price $32,500
-
2022-04-11status Active
-
2022-01-05status Pending
-
2021-11-29$45,000 Active
-
1986-05-29soldstatus $29,900
ⓘ Source: listings_history table (triggers on properties + properties_extension) + one-shot
backfill from property_details.listing_events for pre-trigger history.
Tax reassessment forecast PA · Partial reset (capped growth)
- Current annual tax
- $1,745 · $145/mo
- Projected year-2 tax
- $1,745 · $145/mo
- Expected delta
- $0/yr ($0/mo · 0.0%)
ⓘ Screening estimate from a state-policy table — verify with the county assessor before closing.
Climate risk First Street
- Flood 1/10 Low FEMA zone X (unshaded) · 0% chance over 30 yrs
- Wildfire 1/10 Low
- Heat 4/10 Moderate 8 d/yr ≥97°F today · 20 d/yr by 30 yrs out
- Wind 2/10 Low
- Air quality 4/10 Moderate 5 unhealthy d/yr today · 6 by 30 yrs out
Nearby sold comps map
Loading sold comps map…
Walkable amenities ~0.75 mi
Loading nearby amenities…
Taxation est. · year 1
- Rental income
- $13,694
- − Mortgage interest
- −$4,481
- − Property taxes
- −$1,745
- − Insurance
- −$400
- − Repairs & maintenance
- −$1,096
- − Management
- −$1,096
- − Depreciation
- −$2,327
- Taxable income
- $2,550
- Est. tax owed @ 24.0%
- −$612
- After-tax cash flow
- $3,027/yr
For passive investors: Depreciation is non-cash, so a rental often shows a tax loss while cash-flowing — sheltering income. Rental losses are passive: they offset passive income freely, and up to $25,000/yr can offset ordinary (W-2) income if you actively participate and your MAGI is under $100k (phasing out to $0 by $150k); unused losses carry forward. On sale, claimed depreciation is recaptured at up to 25%, and gains may owe capital-gains tax (a 1031 exchange can defer both). Figures are a year-1 estimate at your 24.0% rate — not tax advice; consult a CPA.
Schools (NCES district)
- District
- Highlands SD
- NCES district ID
- 4211880
- Math proficiency
- 29% ▼ -9.00%
- Reading proficiency
- 48% ▼ -9.00%
- Median HH income
- $43,730
- Composite
- 32.58/100
- National rank
- #5679
- State rank
- #376 of 539 in PA
Livability — Tarentum
- Score
- 79/100
- State rank
- #240
- US rank
- #2066
Category grades
Schools grade is shown separately in the Schools card above.
Census & demographics
- Census place
- Tarentum, PA
- Population (ZIP)
- 9,884
Population outlook (Allegheny County) Hauer SSP2
- Today (2025)
- 1,250,282 people
- By 2030
- 1,256,482 · +0.5%
- By 2040
- 1,256,318 · +0.5%
- By 2050
- 1,244,169 · -0.5%
- By 2075
- 1,197,693 · -4.2%
- By 2100
- 1,093,187 · -12.6%
Race, ethnicity, and origin ACS 2023
- Neighborhood character
- Predominantly White (92%)
- Race & ethnicity
- White 92% Two or more races 4% Black 3% Hispanic / Latino 1%
- Common ancestry
- Romanian 14% Lithuanian 2% Serbian 2%
- Foreign-born
- 1%
- Languages at home
- 98% English-only · French/Haitian/Cajun 1%
Political lean MEDSL · Allegheny
- 2024 margin
- Strong D (+20.3) · D 59.7% · R 39.4%
- 2008→2024 swing
- +4.8pp toward D · 2008: 15.5pp · 2024: 20.3pp
- All cycles
- 2024: D+20.3 2020: D+20.4 2016: D+16.4 2012: D+14.4 2008: D+15.5
Not yet ingested
- Civics
- —
Market trends
- HPI YoY
- ▲ 0.45%
- Current HPI
- 230.7532
- Rent YoY
- —
- Metro
- —
- State GDP YoY
- ▲ 1.68%
- F500 in state
- 34
Industry mix (Fortune 500 HQ in PA)
| Industry | F500 HQs | Revenue |
|---|---|---|
| Healthcare | 2 | $309B |
|
||
| Insurance | 2 | $27B |
|
||
| Telecommunications / Media | 1 | $124B |
|
||
| Industrial Distribution | 1 | $22B |
|
||
| Financial Services | 1 | $20B |
|
||
| Chemicals / Materials | 1 | $18B |
|
||
Price history
+167.6% since first listed11 events — show timeline
- 2026-01-05 Listed $80,000 West Penn MLS
- 2023-11-28 Price Changed $74,999 West Penn MLS
- 2023-10-02 Listed $64,999 West Penn MLS
- 2022-07-21 Pending — West Penn MLS
- 2022-07-08 Sold (MLS) $37,000 West Penn MLS
- 2022-05-11 Contingent — West Penn MLS
- 2022-04-27 Price Changed $32,500 West Penn MLS
- 2022-04-11 Relisted — West Penn MLS
- 2022-01-05 Pending — West Penn MLS
- 2021-11-29 Listed $45,000 West Penn MLS
- 1986-05-29 Sold (Public Records) $29,900 Public Records
Property tax history
+4.4%/yrLatest (2026): $1,745 · -1.3% YoY. Source: county tax records.
Cash-flow waterfall
monthlySold comps — $/sqft
last 12 mo · ≤1 miLoading sold comps…