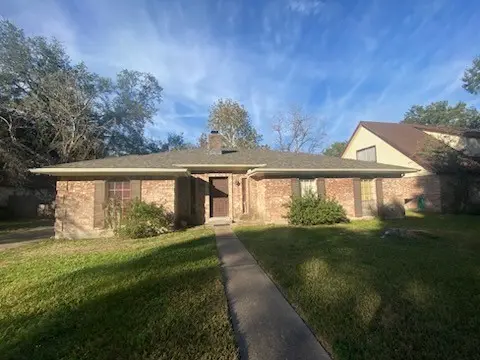
4306 Saratoga Dr · Houston, TX
Flood risk 6/10 · Moderate
- FEMA flood zone
- X (unshaded)
- Chance of flooding over 30 yrs
- 0.69%
- Est. flood insurance / yr
- $507 – $1,088
Fire risk 1/10 · Minimal
- Est. fire insurance / yr
- $1,222 – $2,270
Heat risk 9/10 · Severe
- Hot days now (above 109°F)
- 7 days/yr
- Hot days in 30 yrs
- 24 days/yr
Wind risk 9/10 · Severe
- Chance of severe wind over 30 yrs
- 99.0%
Air-quality risk 3/10 · Minor
- Unhealthy air days now
- 3 days/yr
- Unhealthy air days in 30 yrs
- 4 days/yr
Risk factors via First Street. Map © Google.
Why this score? — see what drove the C- grade
The composite is a weighted blend of 9 inputs, each scored 0–100. Each bar is that input's sub-score; the figure is the points it added to the 100-point composite (weight × sub-score).
- Cash flow +17.4/30.0
- ARV discount +15.0/15.0
- 1% rule +6.0/10.0
- DSCR +5.4/10.0
- Livability +3.7/5.0
- Condition / age +2.5/5.0
- Rent growth +2.2/5.0
- Schools +1.5/10.0
- Appreciation +0.0/10.0
$195,000
🖨 Deal sheet 📄 Offer letter ✓ Due diligence
Listing remarks MLS
Property is currently occupied and requries a 24-48hr notice.... Serious buyers only please.. No Subject To, No Wholesalers No Verbal Offers. Property is currently occupied. Room dimensions are the approximate buyer and buyers agent to verify dementia school district and Homeowner association information. Investor, cash, flip project Fix and flip property or potential rental. Property has a new roof, garage repair, both showers repaired. and any additional information will be provided on the sellers disclosure.
Key facts
- 8,890 sq ft lot
- Garage
- Built 1972
Neighborhood map
What this means for you Summary
Snapshot
- This is a 3-bed/2.0-bath single-family listed at $195k.
Deal economics
- At list price, monthly cash flow is $146 ($2k/yr) — positive.
- The deal already cash-flows at list — no discount required.
- Meets the 1% rule at list price ($2k rent vs $195k).
- Recommended offer: $177k (9.0% below list) — sets the bar for market timing.
- Cap rate 7.2% vs local median 3.2% in Houston — top-decile yield for the area; either an underpriced asset or a hidden risk that comps aren't pricing in. Stress-test before assuming the spread holds.
Location & tenants
- Location reads 74/100 on livability (#184 in TX, #4,771 nationally) — a middle-class / working-renter tenant base. Strengths: amenities A+, cost of living A+, housing A+; Watch: schools D, crime F.
- Aldine ISD (suburban): math 16% / reading 21% proficiency, ranked #790 of 826 in TX (top 96%) — low school quality limits family demand, transient renter base, plan for 1-2y turnover; 79% free/reduced lunch — lower-income household profile, screen leases tightly.
- Market conditions: Rents soft (-1.0%/yr); 468 active listings in the ZIP; 10 comparable units currently listed for rent nearby; rentals at typical pace (median 22d on market — plan ~3-4 weeks tenant-placement turnaround); 40% of comp listings sitting > 30 days — soft ceiling on asking rent; 29,883 units permitted in Harris County in 2024 (8,621 in 5+ unit buildings).
- At $2,136/mo this rent would consume 47% of the median local household income ($54k/yr) (locally 2294% of renters already pay >50% of income on rent) — very limited rent-growth headroom before tenants either downsize or default.
Forward outlook
- Local home prices are declining (-3.0%/yr); year-one equity from $1k of loan paydown is wiped out by about $6k of value loss. Plan a longer hold.
- Harris County population projected at +47% by 2050 — long-run rental-demand tailwind backs the buy-and-hold thesis.
Negotiation context
- It's been on market 96 days — a 9% lower offer ($177k) is reasonable based on typical stale-listing flexibility.
- 3 sale attempts since 3y ago with the ask held roughly flat each time — persistent listings suggest the price (not the market) is what's stuck; bring a comps-based counter.
Risks & watch-outs
- Watch-outs: property tax is 2.7% of price.
- Climate carrying-cost: major flood risk; severe wind risk, 99% chance of damaging wind over 30y; extreme-heat days projected 7→24/yr by 2055 (HVAC capex compounding) — expect insurance premiums to compound above CPI over the hold.
Questions for the listing agent
- It's been on market 96 days. Have you received any prior offers? Is the seller open to a 9% concession, seller financing, or rate buy-down credit?
- Built in 1972 — when were the roof, HVAC, electrical panel, plumbing, and water heater last replaced?
- Property tax is high relative to price — has the assessment been appealed recently, and will the sale trigger a re-assessment?
- Why hasn't it sold? Are there any deal-killer items the seller is aware of (foundation, flood, title, zoning, code violations)?
- Is there a deadline driving the sale (1031 exchange, divorce, estate, relocation)? That informs how much negotiation room exists.
- Schools are D-rated, which usually means shorter tenancies and higher turnover. Who's the typical renter profile here, and what's been the actual vacancy rate?
- Crime grade is F in this area — have there been break-ins, vandalism, or insurance claims at this property in the last 3 years? What carrier currently insures it and at what premium?
- What's the average days-on-market for RENTAL listings here right now (not sales)? A rising rental-DOM trend means longer vacancies and softer asking-rent achievability than the comps imply.
- What's the recent tenant-quality profile in this submarket — average credit score on applications, eviction rate, late-payment / NSF rate, and stable-employment percentage? A property-management company in the area should have these aggregated.
- How much new for-sale + rental construction is in the pipeline within 1–3 miles? Heavy new supply typically softens prices + rents 12–24 months out; constrained supply supports both.
Investment metrics
- 1% rule
- 1.10% ✓
- Cap rate
- 7.19%
- Cash-on-cash
- 3.22%
- DSCR
- 1.14
- GRM
- 7.6
CMA / ARV
- ARV (median comp)
- $249,664
- List price
- $195,000
- Delta
- -21.90%
- Verdict
- UNDERPRICED
- Comps
- 20 within 1.0 mi
Show comp detail 12 sales within ~0.75 mi
| Address | Dist | Beds/Ba | Sqft | Sold | Price | $/sf | Match |
|---|---|---|---|---|---|---|---|
| 4206 Saratoga Dr | 0.04mi | 3/2.0 | 1,828 (-10%) | 6mo | $220,000 | $120 | 77 |
| 3615 Mayfield Oaks Ln | 0.49mi | 3/2.0 | 2,132 (+5%) | 2mo | $295,000 | $138 | 66 |
| 5710 Council Grove Ln | 0.36mi | 3/2.0 | 1,859 (-8%) | 6mo | $175,000 | $94 | 65 |
| 7706 Ashmole Ln | 0.70mi | 3/2.0 | 2,003 (-1%) | 2mo | $220,000 | $110 | 64 |
| 3522 Almington Ln | 0.56mi | 3/2.0 | 1,936 (-4%) | 5mo | $200,000 | $103 | 63 |
| 7709 Inwood Grove Ln | 0.36mi | 3/2.5 | 1,810 (-10%) | 2mo | $355,000 | $196 | 62 |
| 5906 Lawn Ln | 0.63mi | 3/2.0 | 1,916 (-5%) | 6mo | $349,999 | $183 | 57 |
| 7628 Inwood Hills Ln | 0.41mi | 3/2.5 | 1,768 (-13%) | 3mo | $335,000 | $189 | 56 |
| 5639 Council Grove Ln | 0.35mi | 4/2.5 (+1) | 2,243 (+11%) | 4mo | $265,000 | $118 | 55 |
| 7726 Ashmole Ln | 0.71mi | 3/2.0 | 1,874 (-7%) | 3mo | $219,900 | $117 | 52 |
| 7707 Inwood Grove Ln | 0.36mi | 4/2.5 (+1) | 1,757 (-13%) | 2mo | $349,000 | $199 | 52 |
| 8618 Scenic Green Dr | 0.70mi | 3/2.0 | 1,800 (-11%) | 1mo | $198,000 | $110 | 48 |
Match score weights: distance 35% · size 25% · config 20% · recency 20%. Top-matched comps best support the ARV.
Projected returns pro-forma
-3.0% appreciation · 0.0% rent growth · sell at horizon
- IRR
- -15.0%
- Equity multiple
- 0.48×
- Total profit
- $-28,386
- Equity at exit
- $29,075
- IRR
- -13.5%
- Equity multiple
- 0.34×
- Total profit
- $-36,294
- Equity at exit
- $16,860
Cash invested: $54,600 (down + closing). Projections, not guarantees.
Landlord ↔ Tenant lean methodology
- Overall (STATE)
- 87 Strongly Landlord-Friendly
- State Texas
- 87 Strongly Landlord-Friendly · R+5
- County
- — inherits STATE
- City
- — inherits STATE
ZIP-level market 77088
- Home prices YoY
- -23.2%
- Rents YoY
- -1.0%
- Active inventory
- 468
- Price-to-rent
- 7.6×
Monthly cashflow live
- Estimated rent
- $2,136 high interval (Pro) →
- Mortgage (P&I)
- −$1,023
- Tax from tax record
- −$437 /mo · $5,248/yr
- Insurance
- −$81
- HOA
- −$0
- Vacancy / Maint / Mgmt
- −$449
- Net cashflow
- $146
Break-even live
UW: 25.0% down · 7.5% · 30yr · 1.5% tax · 5.0% vac · 8.0% maint · 8.0% mgmt
Financing live
Cash to close
- Down payment
- $48,750
- Closing costs
- $5,850
- Reserves months
- —
- Total cash needed
- —
Loan-product check · same deal, 3 products live
Conventional
25% down · 7.5% · 30yr
- Down + closing
- —
- Monthly P&I
- —
- Monthly cashflow
- —
- DSCR
- —
- Eligible?
- —
Personal DTI + credit; lowest rate.
DSCR
20% down · 8.5% · 30yr
- Down + closing
- —
- Monthly P&I
- —
- Monthly cashflow
- —
- DSCR
- —
- Eligible?
- —
No personal income docs; deal must DSCR.
Hard money
10% down · 12.0% · 12mo
- Down + closing
- —
- Monthly P&I
- —
- Monthly cashflow
- —
- DSCR
- —
- Eligible?
- —
Short-term bridge; refi at stabilization.
Rent comps 10 comps
| Address | Beds | Baths | Sqft | Rent | $/sqft | DOM | Units | Dist |
|---|---|---|---|---|---|---|---|---|
| 5218 Long Creek Ln Houston, TX | 4.0 | 2.0 | 1941 | $2,000 | $1.03 | 44d | 1 | 0.37mi |
| 7628 Inwood Hills Ln Houston, TX | 3.0 | 3.0 | 1768 | $2,500 | $1.41 | 44d | 1 | 0.41mi |
| 8402 Storm Creek Ct Houston, TX | 4.0 | 2.5 | 2612 | $2,083 | $0.80 | 13d | 1 | 0.45mi |
| 8822 Woodcamp Dr Houston, TX | 3.0 | 2.5 | 1687 | $1,740 | $1.03 | 5d | 1 | 0.74mi |
| 3018 Stallings Dr Houston, TX | 4.0 | 2.0 | 1512 | $1,550 | $1.03 | 44d | 1 | 1.04mi |
| 6240 Antoine Dr Unit 6273 Houston, TX | 3.0 | 2.0 | 1484 | $1,432 | $0.96 | 3d | 1 | 1.17mi |
| 7504 Carver Rd Houston, TX | 3.0 | 2.5 | 1694 | $2,500 | $1.48 | 5d | 1 | 1.23mi |
| 6615 Goldspier St Houston, TX | 3.0 | 2.0 | 1848 | $2,150 | $1.16 | 22d | 1 | 1.32mi |
| 6018 Elkwood Forest Dr Houston, TX | 3.0 | 2.0 | 1840 | $1,975 | $1.07 | 44d | 1 | 1.41mi |
| 7008 Emma Lou St Houston, TX | 3.0 | 2.5 | 1610 | $3,000 | $1.86 | 19d | 1 | 1.49mi |
Listing history 23 events
-
2026-06-18days on market $195,000 Active 96 DOM
-
2026-06-17days on market $195,000 Active 95 DOM
-
2026-06-16days on market $195,000 Active 94 DOM
-
2026-06-15days on market $195,000 Active 93 DOM
-
2026-06-13days on market $195,000 Active 91 DOM
-
2026-06-13days on market $195,000 Active 90 DOM
-
2026-06-09days on market $195,000 Active 87 DOM
-
2026-06-08days on market $195,000 Active 86 DOM
-
2026-06-07days on market $195,000 Active 85 DOM
-
2026-06-04days on market $195,000 Active 82 DOM
-
2026-06-03days on market $195,000 Active 81 DOM
-
2026-06-02days on market $195,000 Active 80 DOM
-
2026-06-01days on market $195,000 Active 79 DOM
-
2026-05-31days on market $195,000 Active 78 DOM
-
2026-03-14$195,000 Active 516-char remark
Show marketing remark (516 chars)
Property is currently occupied and requries a 24-48hr notice.... Serious buyers only please.. No Subject To, No Wholesalers No Verbal Offers. Property is currently occupied. Room dimensions are the approximate buyer and buyers agent to verify dementia school district and Homeowner association information. Investor, cash, flip project Fix and flip property or potential rental. Property has a new roof, garage repair, both showers repaired. and any additional information will be provided on the sellers disclosure.
-
2026-03-14historical
Show marketing remark (516 chars)
Property is currently occupied and requries a 24-48hr notice.... Serious buyers only please.. No Subject To, No Wholesalers No Verbal Offers. Property is currently occupied. Room dimensions are the approximate buyer and buyers agent to verify dementia school district and Homeowner association information. Investor, cash, flip project Fix and flip property or potential rental. Property has a new roof, garage repair, both showers repaired. and any additional information will be provided on the sellers disclosure.
-
2026-02-04price $205,000
-
2025-10-17$215,000 Active
-
2023-10-16historical
-
2023-09-08price $200,000
-
2023-08-20$219,000 Active
-
2006-05-12soldstatus
-
1988-01-01soldstatus
ⓘ Source: listings_history table (triggers on properties + properties_extension) + one-shot
backfill from property_details.listing_events for pre-trigger history.
Tax reassessment forecast TX · Resets to sale price
- Current annual tax
- $5,248 · $437/mo
- Projected year-2 tax
- $5,248 · $437/mo
- Expected delta
- $0/yr ($0/mo · 0.0%)
ⓘ Screening estimate from a state-policy table — verify with the county assessor before closing.
Climate risk First Street
- Flood 6/10 Major FEMA zone X (unshaded) · 69% chance over 30 yrs
- Wildfire 1/10 Low
- Heat 9/10 Extreme 7 d/yr ≥109°F today · 24 d/yr by 30 yrs out
- Wind 9/10 Extreme 99% chance of damaging wind over 30 yrs
- Air quality 3/10 Moderate 3 unhealthy d/yr today · 4 by 30 yrs out
Nearby sold comps map
Loading sold comps map…
Walkable amenities ~0.75 mi
Loading nearby amenities…
Taxation est. · year 1
- Rental income
- $25,633
- − Mortgage interest
- −$10,923
- − Property taxes
- −$5,248
- − Insurance
- −$975
- − Repairs & maintenance
- −$2,051
- − Management
- −$2,051
- − Depreciation
- −$5,673
- Taxable loss
- −$1,287
- Est. tax savings @ 24.0%
- +$309
- After-tax cash flow
- $2,065/yr
For passive investors: Depreciation is non-cash, so a rental often shows a tax loss while cash-flowing — sheltering income. Rental losses are passive: they offset passive income freely, and up to $25,000/yr can offset ordinary (W-2) income if you actively participate and your MAGI is under $100k (phasing out to $0 by $150k); unused losses carry forward. On sale, claimed depreciation is recaptured at up to 25%, and gains may owe capital-gains tax (a 1031 exchange can defer both). Figures are a year-1 estimate at your 24.0% rate — not tax advice; consult a CPA.
Schools (NCES district)
- District
- Aldine ISD
- NCES district ID
- 4807710
- Math proficiency
- 16% ▼ -23.00%
- Reading proficiency
- 21% ▼ -11.00%
- Median HH income
- $37,081
- Composite
- 15.42/100
- National rank
- #9317
- State rank
- #790 of 826 in TX
Livability — Houston
- Score
- 74/100
- State rank
- #184
- US rank
- #4771
Category grades
Schools grade is shown separately in the Schools card above.
Census & demographics
- Census place
- Houston, TX
- County
- Harris County · 4,702,590 people
- City population
- 3,226,434
- Metro
- Houston-The Woodlands-Sugar Land, TX
- Population (ZIP)
- 57,047
- Household income
- $54,411
- Rent vs Own
- Severe rent burden
- 2294.0
Population outlook (Harris County) Hauer SSP2
- Today (2025)
- 5,571,493 people
- By 2030
- 6,089,821 · +9.3%
- By 2040
- 7,142,806 · +28.2%
- By 2050
- 8,185,864 · +46.9%
- By 2075
- 10,574,329 · +89.8%
- By 2100
- 12,109,958 · +117.4%
Race, ethnicity, and origin ACS 2023
- Neighborhood character
- Diverse neighborhood (Simpson 0.59)
- Race & ethnicity
- Hispanic / Latino 52% Black 37% Two or more races 18% White 6% Asian 4%
- Hispanic origin (detail)
- Mexican 36%
- Common ancestry
- Lithuanian 1%
- Foreign-born
- 25% · Canada, Vietnam, China
- Languages at home
- 49% English-only · Spanish 47% Vietnamese 3%
Political lean MEDSL · Harris
- 2024 margin
- Lean D (+5.5) · D 52.0% · R 46.4% · Other 1.6%
- 2008→2024 swing
- +3.9pp toward D · 2008: 1.6pp · 2024: 5.5pp
- All cycles
- 2024: D+5.5 2020: D+13.3 2016: D+12.4 2012: D+0.1 2008: D+1.6
Not yet ingested
- Civics
- —
Market trends
- HPI YoY
- ▼ -98.37%
- Current HPI
- 325.0499
- Rent YoY
- ▼ -1.01%
- Metro
- Houston-The Woodlands-Sugar Land, TX
- State GDP YoY
- ▲ 3.95%
- F500 in state
- 110
Industry mix (Fortune 500 HQ in TX)
| Industry | F500 HQs | Revenue |
|---|---|---|
| Energy | 16 | $1,198B |
|
||
| Technology | 5 | $198B |
|
||
| Engineering / Construction | 4 | $72B |
|
||
| Energy Services | 3 | $60B |
|
||
| Utilities | 3 | $41B |
|
||
| Healthcare | 2 | $330B |
|
||
Price history
-11.0% since first listed9 events — show timeline
- 2026-03-14 Listing Removed — HARMLS
- 2026-03-14 Listed $195,000 HARMLS
- 2026-02-04 Price Changed $205,000 HARMLS
- 2025-10-17 Listed $215,000 HARMLS
- 2023-10-16 Listing Removed — HARMLS
- 2023-09-08 Price Changed $200,000 HARMLS
- 2023-08-20 Listed $219,000 HARMLS
- 2006-05-12 Sold (Public Records) — Public Records
- 1988-01-01 Sold (Public Records) — Public Records
Property tax history
+7.8%/yrLatest (2025): $5,248 · +5.6% YoY. Source: county tax records.
Cash-flow waterfall
monthlySold comps — $/sqft
last 12 mo · ≤1 miLoading sold comps…