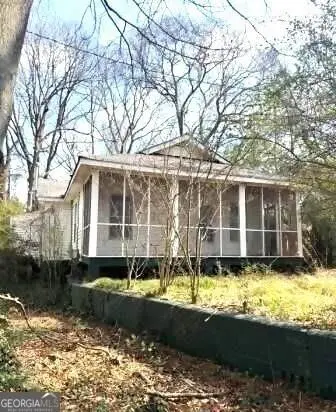
3404 Randell Brown Ave · Hapeville, GA
Flood risk 1/10 · Minimal
- FEMA flood zone
- X (unshaded)
- Chance of flooding over 30 yrs
- 0.0%
- Est. flood insurance / yr
- $473 – $860
Fire risk 1/10 · Minimal
- Est. fire insurance / yr
- $963 – $1,789
Heat risk 5/10 · Moderate
- Hot days now (above 104°F)
- 7 days/yr
- Hot days in 30 yrs
- 18 days/yr
Wind risk 6/10 · Moderate
- Chance of severe wind over 30 yrs
- 27.0%
Air-quality risk 4/10 · Minor
- Unhealthy air days now
- 4 days/yr
- Unhealthy air days in 30 yrs
- 6 days/yr
Risk factors via First Street. Map © Google.
Why this score? — see what drove the B grade
The composite is a weighted blend of 9 inputs, each scored 0–100. Each bar is that input's sub-score; the figure is the points it added to the 100-point composite (weight × sub-score).
- Cash flow +30.0/30.0
- 1% rule +10.0/10.0
- DSCR +10.0/10.0
- ARV discount +7.5/15.0
- Schools +4.5/10.0
- Rent growth +3.9/5.0
- Livability +3.8/5.0
- Condition / age +1.0/5.0
- Appreciation +0.0/10.0
$114,900
🖨 Deal sheet 📄 Offer letter ✓ Due diligence
Listing remarks MLS
Great opportunity to get into the popular Hapeville community for less than the homes around you! This property is ready to start fresh with a renovation or tear down and start over. Walking distance to the elementary school, local library, skate park, splash pad, senior center, local eateries and pubs. Minutes to Hartsfield International Airport. Using GPS search for 3404 Park Ave, Hapeville to locate property.
Key facts
- Local eateries
- Senior center
- Local pubs
Tags
Property features AI
Finance
- HOA & community: Community amenities include park, playground, tennis courts, public transportation and nearby shopping and restaurants
Exterior
- Parking: Driveway parking (open parking)
- Utilities: Public water; Public sewer; Electric service (other)
- Home design: One-level home; Fixer condition; Fee simple ownership; Raised foundation
- Construction: Vinyl siding; Composition roof; Raised foundation; Built with vinyl siding
- Exterior features: Front porch; Rear porch; Paved road access; Near public transport, schools, shopping, park, playground, restaurants, tennis courts
Interior
- Kitchen: Kitchen with other/unspecified features; Other appliances included
- Bedrooms: Three main-level bedrooms; Master on main
- Flooring: Other flooring
- Bathrooms: Two full bathrooms, both on the main level; Master bathroom with other/unspecified features
- Interior features: Other interior features; No common walls; Crawl space basement
- Laundry & utility: Laundry with other/unspecified features
Neighborhood map
What this means for you Summary
Snapshot
- This is a 3-bed/2.0-bath single-family listed at $115k. Condition is rated poor.
Deal economics
- At list price, monthly cash flow is $758 ($9k/yr) — positive.
- The deal already cash-flows at list — no discount required.
- Meets the 1% rule at list price ($2k rent vs $115k).
- Recommended offer: $111k (3.0% below list) — sets the bar for market timing.
- Cap rate 14.2% vs local median 3.6% in Hapeville — top-decile yield for the area; either an underpriced asset or a hidden risk that comps aren't pricing in. Stress-test before assuming the spread holds.
Location & tenants
- Location reads 76/100 on livability (#25 in GA, #3,590 nationally) — a middle-class / working-renter tenant base. Strengths: cost of living A+, housing A+, employment A-; Watch: commute F.
- Fulton County (suburban): math 49% / reading 53% proficiency, ranked #12 of 174 in GA (top 7%) — acceptable for families but not a draw, mixed tenant base, ~2y average lease.
- Zoned schools: Hapeville Elementary School (math 37% / reading 37%, grade F, #485 of 1,228 statewide, top 41%, 528 students, 100% FRL); Paul D. West Middle School (math 17% / reading 17%, grade F, #381 of 470 statewide, top 82%, 803 students, 100% FRL); Tri-Cities High School (math 5% / reading 30%, grade F, #264 of 424 statewide, top 63%, 1,483 students, 100% FRL) — zoned schools average 100% FRL vs 41% district-wide (59 pts higher); higher-poverty schools than district average — tighter screening recommended.
- Zoned-school proficiency averages 24% at this address vs 51% district-wide (-27 pts) — the specific schools serving this property underperform the Fulton County average; the district grade overstates school quality for this exact location.
- Market conditions: Rents rising fast (+5.5%/yr); 175 active listings in the ZIP; 29 comparable units currently listed for rent nearby; rentals at typical pace (median 15d on market — plan ~3-4 weeks tenant-placement turnaround); 11,565 units permitted in Fulton County in 2024 (8,159 in 5+ unit buildings).
Forward outlook
- Local home prices are declining (-3.0%/yr); year-one equity from $794 of loan paydown is wiped out by about $3k of value loss. Plan a longer hold.
- Fulton County population projected at +38% by 2050 — long-run rental-demand tailwind backs the buy-and-hold thesis.
- At projected returns (-3.0% appreciation + 5.5% rent growth), your $32k cash investment doubles in ~4 years — after that, you're playing with house money.
Negotiation context
- It's been on market 51 days — a 3% lower offer ($111k) is reasonable based on typical stale-listing flexibility.
- 7 sale attempts since 3y ago with the ask held roughly flat each time — persistent listings suggest the price (not the market) is what's stuck; bring a comps-based counter.
Risks & watch-outs
- Watch-outs: built in 1920 — expect roof / HVAC / electrical / plumbing capex.
- Climate carrying-cost: major wind risk, 27% chance of damaging wind over 30y; extreme-heat days projected 7→18/yr by 2055 (HVAC capex compounding) — expect insurance premiums to compound above CPI over the hold.
Questions for the listing agent
- It's been on market 51 days. Have you received any prior offers? Is the seller open to a 3% concession, seller financing, or rate buy-down credit?
- Have any recent inspections been done? Can we get a copy of the seller's disclosures and any deferred-maintenance estimates?
- Built in 1920 — when were the roof, HVAC, electrical panel, plumbing, and water heater last replaced?
- Is there a deadline driving the sale (1031 exchange, divorce, estate, relocation)? That informs how much negotiation room exists.
- Schools are F-rated, which usually means shorter tenancies and higher turnover. Who's the typical renter profile here, and what's been the actual vacancy rate?
- What's the average days-on-market for RENTAL listings here right now (not sales)? A rising rental-DOM trend means longer vacancies and softer asking-rent achievability than the comps imply.
- What's the recent tenant-quality profile in this submarket — average credit score on applications, eviction rate, late-payment / NSF rate, and stable-employment percentage? A property-management company in the area should have these aggregated.
- How much new for-sale + rental construction is in the pipeline within 1–3 miles? Heavy new supply typically softens prices + rents 12–24 months out; constrained supply supports both.
Investment metrics
- 1% rule
- 1.71% ✓
- Cap rate
- 14.21%
- Cash-on-cash
- 28.28%
- DSCR
- 2.26
- GRM
- 4.9
CMA / ARV
- ARV (median comp)
- $270,457
- List price
- $114,900
- Delta
- -57.52%
- Verdict
- UNDERPRICED
- Comps
- 20 within 1.0 mi
Show comp detail 6 sales within ~0.75 mi
| Address | Dist | Beds/Ba | Sqft | Sold | Price | $/sf | Match |
|---|---|---|---|---|---|---|---|
| 3436 Louise St | 0.23mi | 4/1.0 (+1) | 1,320 (+12%) | 4mo | $202,000 | $153 | 57 |
| 3317 Ward Dr SW | 0.72mi | 3/2.0 | 1,204 (+2%) | 16mo | $225,000 | $187 | 49 |
| 447 North Ave | 0.66mi | 2/1.0 (-1) | 1,124 (-5%) | 6mo | $305,000 | $271 | 48 |
| 3215 Pennignton Cir | 0.67mi | 3/2.0 | 1,075 (-9%) | 10mo | $220,000 | $205 | 45 |
| 3309 Ward Dr SW | 0.72mi | 2/1.0 (-1) | 1,066 (-10%) | 8mo | $75,000 | $70 | 35 |
| 3181 Pennington Cir SW | 0.73mi | 4/3.0 (+1) | 1,300 (+10%) | 17mo | $145,000 | $112 | 26 |
Match score weights: distance 35% · size 25% · config 20% · recency 20%. Top-matched comps best support the ARV.
Projected returns pro-forma
-3.0% appreciation · 5.45% rent growth · sell at horizon
- IRR
- 25.3%
- Equity multiple
- 2.08×
- Total profit
- $34,660
- Equity at exit
- $17,132
- IRR
- 34.5%
- Equity multiple
- 4.54×
- Total profit
- $113,890
- Equity at exit
- $9,934
Cash invested: $32,172 (down + closing). Projections, not guarantees.
Landlord ↔ Tenant lean methodology
- Overall (STATE)
- 90 Strongly Landlord-Friendly
- State Georgia
- 90 Strongly Landlord-Friendly · R+3
- County
- — inherits STATE
- City
- — inherits STATE
ZIP-level market 30354
- Home prices YoY
- -17.5%
- Rents YoY
- 5.5%
- Active inventory
- 175
- Price-to-rent
- 4.9×
Monthly cashflow live
- Estimated rent
- $1,965 high interval (Pro) →
- Mortgage (P&I)
- −$603
- Tax est. 1.5%
- −$144 /mo · $1,724/yr
- Insurance
- −$48
- HOA
- −$0
- Vacancy / Maint / Mgmt
- −$413
- Net cashflow
- $758
Break-even live
UW: 25.0% down · 7.5% · 30yr · 1.5% tax · 5.0% vac · 8.0% maint · 8.0% mgmt
Financing live
Cash to close
- Down payment
- $28,725
- Closing costs
- $3,447
- Reserves months
- —
- Total cash needed
- —
Loan-product check · same deal, 3 products live
Conventional
25% down · 7.5% · 30yr
- Down + closing
- —
- Monthly P&I
- —
- Monthly cashflow
- —
- DSCR
- —
- Eligible?
- —
Personal DTI + credit; lowest rate.
DSCR
20% down · 8.5% · 30yr
- Down + closing
- —
- Monthly P&I
- —
- Monthly cashflow
- —
- DSCR
- —
- Eligible?
- —
No personal income docs; deal must DSCR.
Hard money
10% down · 12.0% · 12mo
- Down + closing
- —
- Monthly P&I
- —
- Monthly cashflow
- —
- DSCR
- —
- Eligible?
- —
Short-term bridge; refi at stabilization.
Rent comps 29 comps
| Address | Beds | Baths | Sqft | Rent | $/sqft | DOM | Units | Dist |
|---|---|---|---|---|---|---|---|---|
| 397 N Central Ave Hapeville, GA | 1.0–2.0 | 1.0–2.0 | 950 | $2,704 | $2.85 | 1d | 24 | 0.37mi |
| 3287 Russell St Atlanta, GA | 2.0 | 1.0 | 800 | $1,195 | $1.49 | 43d | 1 | 0.59mi |
| 3558 Elm St Atlanta, GA | 3.0 | 1.0–2.0 | 1098 | $3,249 | $2.96 | 12d | 33 | 0.60mi |
| 3301 Old Jonesboro Rd Atlanta, GA | 2.0 | 1.0 | 899 | $2,250 | $2.50 | 5d | 1 | 0.61mi |
| 536 College St Hapeville, GA | 2.0 | 1.0 | 765 | $1,295 | $1.69 | 17d | 1 | 0.66mi |
| 558 College St Atlanta, GA | 1.0–2.0 | 1.5 | 850 | $1,289 | $1.52 | 15d | 6 | 0.69mi |
| 436 Grady Pl Atlanta, GA | 3.0 | 2.0 | 1425 | $2,100 | $1.47 | 15d | 1 | 0.71mi |
| 518 North Ave Atlanta, GA | 2.0 | 1.5 | 1096 | $2,150 | $1.96 | 10d | 1 | 0.76mi |
| 3640 S Fulton Ave Atlanta, GA | 1.0–2.0 | 1.0–2.0 | 950 | $1,793 | $1.89 | 2d | 27 | 0.87mi |
| 535 Lake Dr Atlanta, GA | 3.0 | 2.0 | 1080 | $2,275 | $2.11 | 43d | 1 | 0.87mi |
| 3188 Ward Dr SW Atlanta, GA | 3.0 | 1.5 | 1025 | $1,800 | $1.76 | 12d | 1 | 0.88mi |
| 3066 Waters Rd SW Atlanta, GA | 3.0 | 1.0 | 1144 | $1,395 | $1.22 | 20d | 1 | 0.89mi |
| 3054 Waters Rd SW Atlanta, GA | 3.0 | 1.0 | 891 | $1,800 | $2.02 | 7d | 1 | 0.91mi |
| 210 Oak Dr SE Atlanta, GA | 3.0 | 2.0 | 1330 | $1,400 | $1.05 | 24d | 1 | 0.91mi |
| 231 Maple St Atlanta, GA | 3.0 | 2.0 | 1068 | $1,645 | $1.54 | 43d | 1 | 0.94mi |
| 3116 Jackson St Atlanta, GA | 2.0 | 2.0 | 1016 | $1,900 | $1.87 | 43d | 1 | 0.99mi |
| 331 Simca St SE Atlanta, GA | 3.0 | 1.0 | 1000 | $1,700 | $1.70 | 3d | 1 | 1.00mi |
| 278 Moreland Way Atlanta, GA | 3.0 | 2.0 | 1000 | $1,945 | $1.95 | 24d | 1 | 1.04mi |
| 324 Macedonia Rd SE Atlanta, GA | 3.0 | 1.0 | 1000 | $1,295 | $1.29 | 7d | 1 | 1.05mi |
| 735 Oak Dr Hapeville, GA | 2.0 | 1.0 | 1053 | $1,550 | $1.47 | 22d | 1 | 1.08mi |
| 167 Alyson Ct SE Atlanta, GA | 4.0 | 2.0 | 1344 | $1,825 | $1.36 | 24d | 1 | 1.12mi |
| 2959 Forrest Hills Dr SW Atlanta, GA | 1.0–2.0 | 1.0–1.5 | 925 | $1,250 | $1.35 | 13d | 1 | 1.12mi |
| 2959 Forrest Hills Dr SW Atlanta, GA | 1.0–2.0 | 1.0–1.5 | 925 | $1,250 | $1.35 | 16d | 2 | 1.12mi |
| 801 N Central Ave Atlanta, GA | 2.0–4.0 | 2.5–3.5 | 1586 | $3,195 | $2.01 | 3d | 10 | 1.16mi |
| 3162 Oakdale Rd Atlanta, GA | 3.0 | 1.0 | 1040 | $3,200 | $3.08 | 43d | 1 | 1.22mi |
| 3018 Grand Ave SW Atlanta, GA | 2.0 | 1.0 | 825 | $1,400 | $1.70 | 4d | 1 | 1.26mi |
| 45 Baker Dr SW Atlanta, GA | 3.0 | 2.0 | 1056 | $1,600 | $1.52 | 24d | 1 | 1.31mi |
| 2875 3rd Ave SW Unit A Atlanta, GA | 2.0 | 1.0 | 900 | $1,245 | $1.38 | 2d | 1 | 1.36mi |
| 2786 Old Hapeville Rd SW Atlanta, GA | 2.0 | 1.5 | 1050 | $1,150 | $1.10 | 24d | 1 | 1.45mi |
Listing history 24 events
-
2026-06-18days on market $114,900 Active 51 DOM
-
2026-06-17days on market $114,900 Active 50 DOM
-
2026-06-16days on market $114,900 Active 49 DOM
-
2026-06-15days on market $114,900 Active 48 DOM
-
2026-06-13days on market $114,900 Active 46 DOM
-
2026-06-09days on market $114,900 Active 42 DOM
-
2026-06-08days on market $114,900 Active 41 DOM
-
2026-06-07days on market $114,900 Active 40 DOM
-
2026-06-04days on market $114,900 Active 37 DOM
-
2026-06-03days on market $114,900 Active 36 DOM
-
2026-06-01days on market $114,900 Active 34 DOM
-
2026-05-31days on market $114,900 Active 33 DOM
-
2026-04-27$114,900 New 419-char remark
Show marketing remark (419 chars)
Great opportunity to get into the popular Hapeville community for less than the homes around you! This property is ready to start fresh with a renovation or tear down and start over. Walking distance to the elementary school, local library, skate park, splash pad, senior center, local eateries and pubs. Minutes to Hartsfield International Airport. Using GPS search for 3404 Park Ave, Hapeville to locate property.
-
2026-04-27$114,900 Active 419-char remark
Show marketing remark (419 chars)
Great opportunity to get into the popular Hapeville community for less than the homes around you! This property is ready to start fresh with a renovation or tear down and start over. Walking distance to the elementary school, local library, skate park, splash pad, senior center, local eateries and pubs. Minutes to Hartsfield International Airport. Using GPS search for 3404 Park Ave, Hapeville to locate property.
-
2026-04-24historical
-
2026-04-16$114,900 New
-
2025-12-31historical
-
2025-11-30status Active
-
2024-12-31historical
-
2024-11-12price $199,000
-
2024-11-12price $199,000
-
2024-10-30$215,000 Active
-
2024-10-30$215,000 New
-
2023-08-16$200,000 Active
ⓘ Source: listings_history table (triggers on properties + properties_extension) + one-shot
backfill from property_details.listing_events for pre-trigger history.
Climate risk First Street
- Flood 1/10 Low FEMA zone X (unshaded) · 0% chance over 30 yrs
- Wildfire 1/10 Low
- Heat 5/10 Major 7 d/yr ≥104°F today · 18 d/yr by 30 yrs out
- Wind 6/10 Major 27% chance of damaging wind over 30 yrs
- Air quality 4/10 Moderate 4 unhealthy d/yr today · 6 by 30 yrs out
Nearby sold comps map
Loading sold comps map…
Walkable amenities ~0.75 mi
Loading nearby amenities…
Taxation est. · year 1
- Rental income
- $23,578
- − Mortgage interest
- −$6,436
- − Property taxes
- −$1,724
- − Insurance
- −$574
- − Repairs & maintenance
- −$1,886
- − Management
- −$1,886
- − Depreciation
- −$3,343
- Taxable income
- $7,729
- Est. tax owed @ 24.0%
- −$1,855
- After-tax cash flow
- $7,243/yr
For passive investors: Depreciation is non-cash, so a rental often shows a tax loss while cash-flowing — sheltering income. Rental losses are passive: they offset passive income freely, and up to $25,000/yr can offset ordinary (W-2) income if you actively participate and your MAGI is under $100k (phasing out to $0 by $150k); unused losses carry forward. On sale, claimed depreciation is recaptured at up to 25%, and gains may owe capital-gains tax (a 1031 exchange can defer both). Figures are a year-1 estimate at your 24.0% rate — not tax advice; consult a CPA.
Condition & rehab AI · 12 photos
This property requires extensive renovation and repair work to bring it up to a livable condition. Significant investment is needed to improve the kitchen, bathrooms, roof, exterior, flooring, interior walls, windows, foundation, and HVAC systems. Once renovated, it will be move-in ready and attract buyers and renters.
Repairs flagged
- Major Kitchen appliances — Likely non-functional and in poor condition
- Major Bathroom fixtures — Worn-out and in poor condition
- Major Roof repair — Signs of damage and possible leaks
- Major Exterior siding repair — Peeling paint and damage
- Major Flooring replacement — Worn-out and uneven
- Major Interior wall repair — Peeling paint and exposed areas
- Major Window repair — Damaged frames
- Major Foundation repair — Signs of settling
- Major HVAC replacement — Likely non-functional
Value-add opportunities
- Both Kitchen renovation — Modern kitchen with appliances will attract buyers and renters
- Both Bathroom renovation — Upgraded bathroom will attract buyers and renters
- Both Roof replacement — New roof will prevent leaks and improve curb appeal
- Both Exterior siding repair and paint — Fresh siding and paint will improve curb appeal and attract buyers
- Both Flooring replacement — New flooring will improve the living space and attract buyers
- Both Interior wall repair and paint — Fresh paint and repairs will improve the living space and attract buyers
- Both Window repair and replacement — New windows will improve energy efficiency and attract buyers
- Both Foundation repair — Stabilized foundation will improve the structural integrity and attract buyers
- Both HVAC replacement — Modern HVAC system will improve comfort and attract buyers
Renovation cost estimate screening
| Repair item | Severity | Est. cost |
|---|---|---|
| Kitchen appliances · Likely non-functional and in poor condition | Major | $15,000–50,000 |
| Bathroom fixtures · Worn-out and in poor condition | Major | $15,000–50,000 |
| Roof repair · Signs of damage and possible leaks | Major | $15,000–50,000 |
| Exterior siding repair · Peeling paint and damage | Major | $15,000–50,000 |
| Flooring replacement · Worn-out and uneven | Major | $15,000–50,000 |
| Interior wall repair · Peeling paint and exposed areas | Major | $15,000–50,000 |
| Window repair · Damaged frames | Major | $15,000–50,000 |
| Foundation repair · Signs of settling | Major | $15,000–50,000 |
| HVAC replacement · Likely non-functional | Major | $15,000–50,000 |
| Total estimated repair cost · 9 items | $135,000–450,000 |
Value-add ROI direction
- Both Kitchen renovation — Modern kitchen with appliances will attract buyers and renters ↑
- Both Bathroom renovation — Upgraded bathroom will attract buyers and renters ↑
- Both Roof replacement — New roof will prevent leaks and improve curb appeal ↑
- Both Exterior siding repair and paint — Fresh siding and paint will improve curb appeal and attract buyers ↑
- Both Flooring replacement — New flooring will improve the living space and attract buyers ↑
- Both Interior wall repair and paint — Fresh paint and repairs will improve the living space and attract buyers ↑
- Both Window repair and replacement — New windows will improve energy efficiency and attract buyers ↑
- Both Foundation repair — Stabilized foundation will improve the structural integrity and attract buyers ↑
- Both HVAC replacement — Modern HVAC system will improve comfort and attract buyers ↑
ⓘ Cost ranges are severity-bucket heuristics (US national rule-of-thumb). Get contractor quotes + a written scope before underwriting a rehab budget.
Schools (NCES district)
- District
- Fulton County
- NCES district ID
- 1302280
- Math proficiency
- 49% ▼ -2.00%
- Reading proficiency
- 53% ▬ 0.00%
- Median HH income
- $68,035
- Composite
- 45.33/100
- National rank
- #2640
- State rank
- #12 of 174 in GA
Livability — Hapeville
- Score
- 76/100
- State rank
- #25
- US rank
- #3590
Category grades
Schools grade is shown separately in the Schools card above.
Census & demographics
- Census place
- Hapeville, GA
- County
- Fulton County · 1,094,430 people
- Metro
- Atlanta-Sandy Springs-Alpharetta, GA
- Population (ZIP)
- 16,182
- Household income
- $63,189
- Rent vs Own
- Severe rent burden
- 930.0
Population outlook (Fulton County) Hauer SSP2
- Today (2025)
- 1,203,707 people
- By 2030
- 1,299,706 · +8.0%
- By 2040
- 1,488,256 · +23.6%
- By 2050
- 1,664,580 · +38.3%
- By 2075
- 2,036,072 · +69.2%
- By 2100
- 2,222,402 · +84.6%
Race, ethnicity, and origin ACS 2023
- Neighborhood character
- Predominantly Black (68%)
- Race & ethnicity
- Black 68% Hispanic / Latino 16% White 10% Two or more races 9% Native American 2% Asian 1%
- Hispanic origin (detail)
- Mexican 13%
- Common ancestry
- Italian 2% Romanian 1% Swedish 1%
- Foreign-born
- 11% · Canada, Vietnam, Guatemala
- Languages at home
- 81% English-only · Spanish 15% German/W. Germanic 1% Vietnamese 1%
Political lean MEDSL · Fulton
- 2024 margin
- Solid D (+44.9) · D 71.9% · R 27.0% · Other 1.1%
- 2008→2024 swing
- +9.8pp toward D · 2008: 35.0pp · 2024: 44.9pp
- All cycles
- 2024: D+44.9 2020: D+46.4 2016: D+42.1 2012: D+29.6 2008: D+35.0
Not yet ingested
- Civics
- —
Market trends
- HPI YoY
- ▼ -67.78%
- Current HPI
- 320.1111
- Rent YoY
- ▲ 5.45%
- Metro
- Atlanta-Sandy Springs-Alpharetta, GA
- State GDP YoY
- ▲ 2.66%
- F500 in state
- 28
Industry mix (Fortune 500 HQ in GA)
| Industry | F500 HQs | Revenue |
|---|---|---|
| Paper / Packaging | 2 | $29B |
|
||
| Retail | 1 | $160B |
|
||
| Transportation / Logistics | 1 | $91B |
|
||
| Airlines | 1 | $62B |
|
||
| Consumer Goods | 1 | $47B |
|
||
| Utilities | 1 | $25B |
|
||
Price history
-42.5% since first listed12 events — show timeline
- 2026-04-27 Listed $114,900 FMLS
- 2026-04-27 Listed $114,900 GAMLS
- 2026-04-24 Listing Removed — GAMLS
- 2026-04-16 Listed $114,900 GAMLS
- 2025-12-31 Listing Removed — FMLS
- 2025-11-30 Relisted — FMLS
- 2024-12-31 Listing Removed — GAMLS
- 2024-11-12 Price Changed $199,000 GAMLS
- 2024-11-12 Price Changed $199,000 FMLS
- 2024-10-30 Listed $215,000 GAMLS
- 2024-10-30 Listed $215,000 FMLS
- 2023-08-16 Listed $200,000 FMLS
Cash-flow waterfall
monthlySold comps — $/sqft
last 12 mo · ≤1 miLoading sold comps…