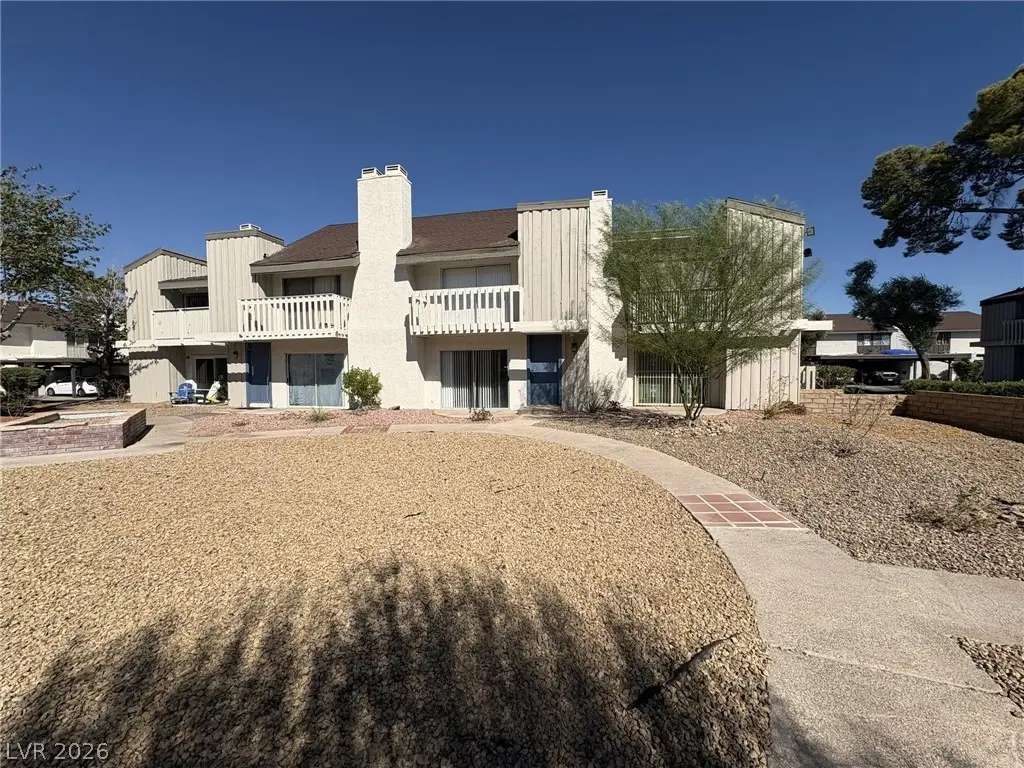
528 Delfern Ln · Paradise, NV
Flood risk 1/10 · Minimal
- FEMA flood zone
- X (unshaded)
- Chance of flooding over 30 yrs
- 0.0%
- Est. flood insurance / yr
- $507 – $1,088
Fire risk 1/10 · Minimal
- Est. fire insurance / yr
- $490 – $910
Heat risk 8/10 · Major
- Hot days now (above 106°F)
- 7 days/yr
- Hot days in 30 yrs
- 18 days/yr
Wind risk 1/10 · Minimal
- Chance of severe wind over 30 yrs
- —
Air-quality risk 3/10 · Minor
- Unhealthy air days now
- 2 days/yr
- Unhealthy air days in 30 yrs
- 3 days/yr
Risk factors via First Street. Map © Google.
Why this score? — see what drove the C grade
The composite is a weighted blend of 9 inputs, each scored 0–100. Each bar is that input's sub-score; the figure is the points it added to the 100-point composite (weight × sub-score).
- Cash flow +25.2/30.0
- DSCR +8.3/10.0
- 1% rule +8.0/10.0
- ARV discount +7.5/15.0
- Livability +3.8/5.0
- Schools +2.6/10.0
- Condition / age +2.5/5.0
- Rent growth +1.4/5.0
- Appreciation +0.0/10.0
$199,900
🖨 Deal sheet 📄 Offer letter ✓ Due diligence
Listing remarks MLS
* * * WOW WHAT DEAL * * * Over 1500 sq ft for such a low price * * * Balcony off master * * Serene courtyard in front * * * BRAND NEW EVERYTHING TOP TO BOTTOM * * * YOU WONT BELIEVE YOUR EYES * * * Time is of the essence * * *
Key facts
- Tennis courts
- Pool
- Prime location
Tags
Property features AI
Finance
- HOA & community: Homeowners association (Greenwood); Monthly HOA fee; HOA covers maintenance of grounds and recreation facilities; Community amenities include gated access, pool, spa/hot tub, and tennis courts; Community pool
Exterior
- Parking: Assigned covered parking; Detached 1-space carport
- Security: Gated community
- Utilities: Public water; Public sewer; Electricity available; Underground utilities
- Home design: 2 stories; Multi-family property; Resale property; Faces west; Has attached unit
- Construction: Pitched roof
- Exterior features: Balcony; Patio; Private yard; Full fencing; Desert landscaping; Landscaped grounds
Interior
- Kitchen: Laminate countertops; Tile flooring in kitchen; Disposal; Electric range; Refrigerator
- Bedrooms: 3 possible bedrooms; Upstairs bedrooms with closets; Bedroom with ceiling fan and walk-in closet
- Flooring: Carpet; Ceramic tile
- Bathrooms: 2 full bathrooms; 1 half bathroom; Shower-only bathroom
- Heating & cooling: Central heating (electric); Central air conditioning (electric)
- Interior features: Blinds; Window treatments; Unfurnished
- Laundry & utility: Main level laundry room; Electric dryer hookup; Washer; Dryer; Electric water heater
Neighborhood map
What this means for you Summary
Snapshot
- This is a 3-bed/2.5-bath townhouse listed at $200k.
Deal economics
- At list price, monthly cash flow is $450 ($5k/yr) — positive.
- The deal already cash-flows at list — no discount required.
- Meets the 1% rule at list price ($3k rent vs $200k).
Location & tenants
- Location reads 76/100 on livability (#10 in NV, #3,494 nationally) — a middle-class / working-renter tenant base. Strengths: commute A+, housing A-, cost of living B; Watch: employment D+, schools F, crime D-.
- Clark County School District (urban): math 21% / reading 39% proficiency, ranked #11 of 17 in NV (top 65%) — families likely to look elsewhere, expect single-tenant / working-renter base with shorter leases.
- Market conditions: Rents falling (-4.4%/yr); 178 active listings in the ZIP; 40 comparable units currently listed for rent nearby; rentals at typical pace (median 24d on market — plan ~3-4 weeks tenant-placement turnaround); 48% of comp listings sitting > 30 days — soft ceiling on asking rent; lower-income renter base — watch delinquency; 14,754 units permitted in Clark County in 2024 (2,301 in 5+ unit buildings).
- At $2,600/mo this rent would consume 76% of the median local household income ($41k/yr) (locally 2744% of renters already pay >50% of income on rent) — very limited rent-growth headroom before tenants either downsize or default.
Forward outlook
- Local home prices are declining (-3.0%/yr); year-one equity from $1k of loan paydown is wiped out by about $6k of value loss. Plan a longer hold.
- Clark County population projected at +36% by 2050 — long-run rental-demand tailwind backs the buy-and-hold thesis.
Negotiation context
- Only 8 days on market — expect competitive offers; lowballing is unlikely to land.
- 3 sale attempts since 20y ago with the ask held roughly flat each time — persistent listings suggest the price (not the market) is what's stuck; bring a comps-based counter.
Risks & watch-outs
- Climate carrying-cost: extreme-heat days projected 7→18/yr by 2055 (HVAC capex compounding) — expect insurance premiums to compound above CPI over the hold.
Questions for the listing agent
- Built in 1974 — when were the roof, HVAC, electrical panel, plumbing, and water heater last replaced?
- What does the HOA fee cover, when was the last increase, and are there any pending special assessments or reserve-fund shortfalls?
- Is there a deadline driving the sale (1031 exchange, divorce, estate, relocation)? That informs how much negotiation room exists.
- Schools are F-rated, which usually means shorter tenancies and higher turnover. Who's the typical renter profile here, and what's been the actual vacancy rate?
- Crime grade is D in this area — have there been break-ins, vandalism, or insurance claims at this property in the last 3 years? What carrier currently insures it and at what premium?
- What's the average days-on-market for RENTAL listings here right now (not sales)? A rising rental-DOM trend means longer vacancies and softer asking-rent achievability than the comps imply.
- What's the recent tenant-quality profile in this submarket — average credit score on applications, eviction rate, late-payment / NSF rate, and stable-employment percentage? A property-management company in the area should have these aggregated.
- How much new for-sale + rental construction is in the pipeline within 1–3 miles? Heavy new supply typically softens prices + rents 12–24 months out; constrained supply supports both.
Investment metrics
- 1% rule
- 1.30% ✓
- Cap rate
- 8.99%
- Cash-on-cash
- 9.64%
- DSCR
- 1.43
- GRM
- 6.4
CMA / ARV
No comps found within radius.
Projected returns pro-forma
-3.0% appreciation · 0.0% rent growth · sell at horizon
- IRR
- -5.6%
- Equity multiple
- 0.80×
- Total profit
- $-11,202
- Equity at exit
- $29,806
- IRR
- -0.5%
- Equity multiple
- 0.97×
- Total profit
- $-1,616
- Equity at exit
- $17,284
Cash invested: $55,972 (down + closing). Projections, not guarantees.
Landlord ↔ Tenant lean methodology
- Overall (STATE)
- 71 Landlord-Friendly
- State Nevada
- 71 Landlord-Friendly · R+1
- County
- — inherits STATE
- City
- — inherits STATE
ZIP-level market 89169
- Home prices YoY
- -33.4%
- Rents YoY
- -4.4%
- Active inventory
- 178
- Price-to-rent
- 6.4×
Monthly cashflow live
- Estimated rent
- $2,600 high interval (Pro) →
- Mortgage (P&I)
- −$1,048
- Tax from tax record
- −$69 /mo · $826/yr
- Insurance
- −$83
- HOA
- −$404
- Vacancy / Maint / Mgmt
- −$546
- Net cashflow
- $450
Break-even live
UW: 25.0% down · 7.5% · 30yr · 1.5% tax · 5.0% vac · 8.0% maint · 8.0% mgmt
Financing live
Cash to close
- Down payment
- $49,975
- Closing costs
- $5,997
- Reserves months
- —
- Total cash needed
- —
Loan-product check · same deal, 3 products live
Conventional
25% down · 7.5% · 30yr
- Down + closing
- —
- Monthly P&I
- —
- Monthly cashflow
- —
- DSCR
- —
- Eligible?
- —
Personal DTI + credit; lowest rate.
DSCR
20% down · 8.5% · 30yr
- Down + closing
- —
- Monthly P&I
- —
- Monthly cashflow
- —
- DSCR
- —
- Eligible?
- —
No personal income docs; deal must DSCR.
Hard money
10% down · 12.0% · 12mo
- Down + closing
- —
- Monthly P&I
- —
- Monthly cashflow
- —
- DSCR
- —
- Eligible?
- —
Short-term bridge; refi at stabilization.
Rent comps 40 comps
| Address | Beds | Baths | Sqft | Rent | $/sqft | DOM | Units | Dist |
|---|---|---|---|---|---|---|---|---|
| 544 Oakbrook Ln Las Vegas, NV | 2.0 | 1.5 | 1146 | $1,950 | $1.70 | 43d | 1 | 0.01mi |
| 3550 Paradise Rd Las Vegas, NV | 3.0 | 1.0–2.0 | 947 | $1,750 | $1.85 | 43d | 20 | 0.11mi |
| 3776 Howard Hughes Pkwy Las Vegas, NV | 3.0 | 1.0–2.5 | 1548 | $3,698 | $2.39 | 1d | 9 | 0.36mi |
| 3930 Paradise Rd Las Vegas, NV | 3.0 | 1.0–2.0 | 999 | $3,370 | $3.37 | 2d | 87 | 0.37mi |
| 360 E Desert Inn Rd Las Vegas, NV | 2.0–3.0 | 2.0–3.0 | 2120 | $4,500 | $2.12 | 43d | 4 | 0.55mi |
| 360 E Desert Inn Rd Las Vegas, NV | 2.0–3.0 | 2.0–3.0 | 2120 | $4,400 | $2.08 | 23d | 3 | 0.55mi |
| 360 E Desert Inn Rd Las Vegas, NV | 2.0–3.0 | 2.0 | 1989 | $4,400 | $2.21 | 4d | 2 | 0.55mi |
| 3930 University Center Dr Las Vegas, NV | 2.0 | 2.0–3.0 | 1200 | $1,725 | $1.44 | 43d | 2 | 0.56mi |
| 900 E Desert Inn Rd Las Vegas, NV | 1.0–2.0 | 1.0–2.0 | 1077 | $1,800 | $1.67 | 43d | 5 | 0.59mi |
| 818 E Flamingo Rd Las Vegas, NV | 1.0–2.0 | 1.0–2.5 | 1158 | $2,895 | $2.50 | 2d | 34 | 0.62mi |
| 3159 Bel Air Dr Las Vegas, NV | 2.0 | 2.0 | 1305 | $2,750 | $2.11 | 21d | 1 | 0.75mi |
| 3151 Bel Air Dr Las Vegas, NV | 3.0 | 2.5 | 2176 | $3,100 | $1.42 | 23d | 1 | 0.76mi |
| 3145 Bel Air Dr Las Vegas, NV | 2.0 | 2.0 | 1305 | $2,495 | $1.91 | 21d | 1 | 0.76mi |
| 260 E Flamingo Rd Las Vegas, NV | 2.0 | 2.0 | 1018 | $2,475 | $2.43 | 2d | 1 | 0.80mi |
| 260 E Flamingo Rd Las Vegas, NV | 2.0 | 2.0 | 1018 | $2,372 | $2.33 | 23d | 2 | 0.80mi |
| 270 E Flamingo Rd Las Vegas, NV | 1.0–2.0 | 1.0–2.0 | 877 | $2,100 | $2.39 | 43d | 7 | 0.82mi |
| 3111 Bel Air Dr Las Vegas, NV | 2.0–3.0 | 2.5 | 2032 | $2,800 | $1.38 | 43d | 3 | 0.85mi |
| 3111 Bel Air Dr Las Vegas, NV | 2.0–3.0 | 2.5–3.5 | 2764 | $15,000 | $5.43 | 4d | 2 | 0.85mi |
| 1061 E Flamingo Rd Las Vegas, NV | 1.0–2.0 | 1.0–2.0 | 967 | $2,203 | $2.28 | 14d | 35 | 0.91mi |
| 2831 Geary Pl #2909 Las Vegas, NV | 2.0 | 1.0 | 1112 | $1,899 | $1.71 | 43d | 1 | 0.94mi |
| 2999 Bel Air Dr Las Vegas, NV | 2.0 | 2.0 | 1326 | $2,700 | $2.04 | 21d | 1 | 0.98mi |
| 2777 Paradise Rd #3503 Las Vegas, NV | 2.0 | 2.5 | 2195 | $6,950 | $3.17 | 43d | 1 | 1.02mi |
| 2747 Paradise Rd #205 Las Vegas, NV | 2.0 | 2.0 | 1556 | $2,856 | $1.84 | 43d | 1 | 1.04mi |
| 1575 Cherokee Ln Las Vegas, NV | 4.0 | 2.0 | 1952 | $2,350 | $1.20 | 43d | 1 | 1.10mi |
| 596 Tam O Shanter Las Vegas, NV | 2.0 | 2.0 | 1350 | $1,750 | $1.30 | 43d | 1 | 1.10mi |
| 624 Tam O Shanter Las Vegas, NV | 2.0 | 2.5 | 1800 | $2,600 | $1.44 | 14d | 1 | 1.11mi |
| 1601 E Katie Ave Las Vegas, NV | 1.0–2.0 | 1.0–2.0 | 809 | $1,852 | $2.29 | 43d | 13 | 1.12mi |
| 3334 Seminole Cir Las Vegas, NV | 4.0 | 3.0 | 1947 | $5,200 | $2.67 | 23d | 1 | 1.16mi |
| 322 Karen Ave Las Vegas, NV | 1.0–2.0 | 1.5–2.0 | 1109 | $3,500 | $3.15 | 3d | 3 | 1.17mi |
| 322 Karen Ave Las Vegas, NV | 1.0–2.0 | 1.0–2.0 | 1109 | $3,500 | $3.15 | 3d | 3 | 1.17mi |
| 222 Karen Ave #4005 Las Vegas, NV | 2.0 | 3.0 | 1646 | $4,500 | $2.73 | 23d | 1 | 1.18mi |
| 222 Karen Ave #3804 Las Vegas, NV | 2.0 | 3.0 | 1646 | $5,000 | $3.04 | 43d | 1 | 1.18mi |
| 222 Karen Ave #3504 Las Vegas, NV | 3.0 | 2.5 | 1646 | $4,000 | $2.43 | 43d | 1 | 1.18mi |
| 222 Karen Ave #4101 Las Vegas, NV | 2.0 | 2.0 | 1399 | $4,000 | $2.86 | 1d | 1 | 1.18mi |
| 1700 E Viking Rd Las Vegas, NV | 2.0 | 2.0 | 1085 | $1,662 | $1.53 | 43d | 3 | 1.21mi |
| 2700 Las Vegas Blvd S Las Vegas, NV | 2.0 | 2.0–2.5 | 1283 | $2,792 | $2.18 | 12d | 4 | 1.22mi |
| 2700 Las Vegas Blvd S Las Vegas, NV | 1.0–2.0 | 1.0–2.5 | 1226 | $2,950 | $2.41 | 17d | 4 | 1.22mi |
| 1100 Tam O Shanter Las Vegas, NV | 2.0 | 2.0 | 1400 | $2,100 | $1.50 | 43d | 1 | 1.30mi |
| 205 E Harmon Ave Las Vegas, NV | 1.0–2.0 | 1.5–2.0 | 1182 | $1,950 | $1.65 | 43d | 5 | 1.31mi |
| 1734 Sombrero Dr Las Vegas, NV | 4.0 | 2.0 | 2173 | $2,795 | $1.29 | 43d | 1 | 1.35mi |
HOA detail
- Monthly dues
- $404 · $4,848/yr
Listing history 9 events
-
2026-04-28status Pending
-
2026-04-20$199,900 Active
-
2026-03-13historical
-
2025-11-22$235,000 Active
-
2006-07-31soldstatus $209,900 242-char remark
Show marketing remark (242 chars)
* * * WOW WHAT DEAL * * * Over 1500 sq ft for such a low price * * * Balcony off master * * Serene courtyard in front * * * BRAND NEW EVERYTHING TOP TO BOTTOM * * * YOU WONT BELIEVE YOUR EYES * * * Time is of the essence * * *
-
2006-07-31soldstatus $209,900
Show marketing remark (242 chars)
* * * WOW WHAT DEAL * * * Over 1500 sq ft for such a low price * * * Balcony off master * * Serene courtyard in front * * * BRAND NEW EVERYTHING TOP TO BOTTOM * * * YOU WONT BELIEVE YOUR EYES * * * Time is of the essence * * *
-
2006-05-05$209,900 242-char remark
Show marketing remark (242 chars)
* * * WOW WHAT DEAL * * * Over 1500 sq ft for such a low price * * * Balcony off master * * Serene courtyard in front * * * BRAND NEW EVERYTHING TOP TO BOTTOM * * * YOU WONT BELIEVE YOUR EYES * * * Time is of the essence * * *
-
2003-02-20soldstatus $109,000
-
1998-10-29soldstatus $60,000
ⓘ Source: listings_history table (triggers on properties + properties_extension) + one-shot
backfill from property_details.listing_events for pre-trigger history.
Tax reassessment forecast NV · Resets to sale price
- Current annual tax
- $826 · $69/mo
- Projected year-2 tax
- $1,179 · $98/mo
- Expected delta
- +$353/yr (+$29/mo · 42.7%)
ⓘ Screening estimate from a state-policy table — verify with the county assessor before closing.
Climate risk First Street
- Flood 1/10 Low FEMA zone X (unshaded) · 0% chance over 30 yrs
- Wildfire 1/10 Low
- Heat 8/10 Severe 7 d/yr ≥106°F today · 18 d/yr by 30 yrs out
- Wind 1/10 Low
- Air quality 3/10 Moderate 2 unhealthy d/yr today · 3 by 30 yrs out
Nearby sold comps map
Loading sold comps map…
Walkable amenities ~0.75 mi
Loading nearby amenities…
Taxation est. · year 1
- Rental income
- $31,200
- − Mortgage interest
- −$11,198
- − Property taxes
- −$826
- − Insurance
- −$1,000
- − Repairs & maintenance
- −$2,496
- − Management
- −$2,496
- − HOA
- −$4,848
- − Depreciation
- −$5,815
- Taxable income
- $2,522
- Est. tax owed @ 24.0%
- −$605
- After-tax cash flow
- $4,790/yr
For passive investors: Depreciation is non-cash, so a rental often shows a tax loss while cash-flowing — sheltering income. Rental losses are passive: they offset passive income freely, and up to $25,000/yr can offset ordinary (W-2) income if you actively participate and your MAGI is under $100k (phasing out to $0 by $150k); unused losses carry forward. On sale, claimed depreciation is recaptured at up to 25%, and gains may owe capital-gains tax (a 1031 exchange can defer both). Figures are a year-1 estimate at your 24.0% rate — not tax advice; consult a CPA.
Schools (NCES district)
- District
- Clark County School District
- NCES district ID
- 3200060
- Math proficiency
- 21% ▼ -13.00%
- Reading proficiency
- 39% ▼ -8.00%
- Median HH income
- $53,611
- Composite
- 26.48/100
- National rank
- #7211
- State rank
- #11 of 17 in NV
Livability — Paradise
- Score
- 76/100
- State rank
- #10
- US rank
- #3494
Category grades
Schools grade is shown separately in the Schools card above.
Census & demographics
- Census place
- Paradise, NV
- County
- Clark County · 2,306,105 people
- City population
- 227,885
- Metro
- Las Vegas-Henderson-Paradise, NV
- Population (ZIP)
- 22,171
- Household income
- $40,904
- Rent vs Own
- Severe rent burden
- 2744.0
Population outlook (Clark County) Hauer SSP2
- Today (2025)
- 2,504,101 people
- By 2030
- 2,693,770 · +7.6%
- By 2040
- 3,061,208 · +22.2%
- By 2050
- 3,400,072 · +35.8%
- By 2075
- 4,139,522 · +65.3%
- By 2100
- 4,596,916 · +83.6%
Race, ethnicity, and origin ACS 2023
- Neighborhood character
- Highly diverse neighborhood (Simpson 0.74)
- Race & ethnicity
- Hispanic / Latino 33% White 30% Black 23% Two or more races 13% Asian 9% Native American 2%
- Hispanic origin (detail)
- Mexican 21% Cuban 5%
- Common ancestry
- Iranian 1% Italian 1% Slovak 1%
- Foreign-born
- 30% · Canada, China
- Languages at home
- 59% English-only · Spanish 27% Tagalog/Filipino 4% Other Asian/Pacific 3%
Political lean MEDSL · Clark
- 2024 margin
- Toss-up / Even · D 50.4% · R 47.8% · Other 1.7%
- 2008→2024 swing
- -16.5pp toward R · 2008: 19.1pp · 2024: 2.6pp
- All cycles
- 2024: D+2.6 2020: D+9.3 2016: D+10.7 2012: D+14.5 2008: D+19.1
Not yet ingested
- Civics
- —
Market trends
- HPI YoY
- ▼ -136.91%
- Current HPI
- 272.6449
- Rent YoY
- ▼ -4.43%
- Metro
- Las Vegas-Henderson-Paradise, NV
- State GDP YoY
- ▲ 3.08%
- F500 in state
- 6
Industry mix (Fortune 500 HQ in NV)
| Industry | F500 HQs | Revenue |
|---|---|---|
| Hotels / Casinos | 3 | $36B |
|
||
Price history
+233.2% since first listed9 events — show timeline
- 2026-04-28 Pending — GLVAR
- 2026-04-20 Listed $199,900 GLVAR
- 2026-03-13 Listing Removed — GLVAR
- 2025-11-22 Listed $235,000 GLVAR
- 2006-07-31 Sold (Public Records) $209,900 Public Records
- 2006-07-31 Sold (MLS) $209,900 GLVAR
- 2006-05-05 Listed $209,900 GLVAR
- 2003-02-20 Sold (Public Records) $109,000 Public Records
- 1998-10-29 Sold (Public Records) $60,000 Public Records
Property tax history
-1.0%/yrLatest (2025): $826 · +7.6% YoY. Source: county tax records.
Cash-flow waterfall
monthlySold comps — $/sqft
last 12 mo · ≤1 miLoading sold comps…