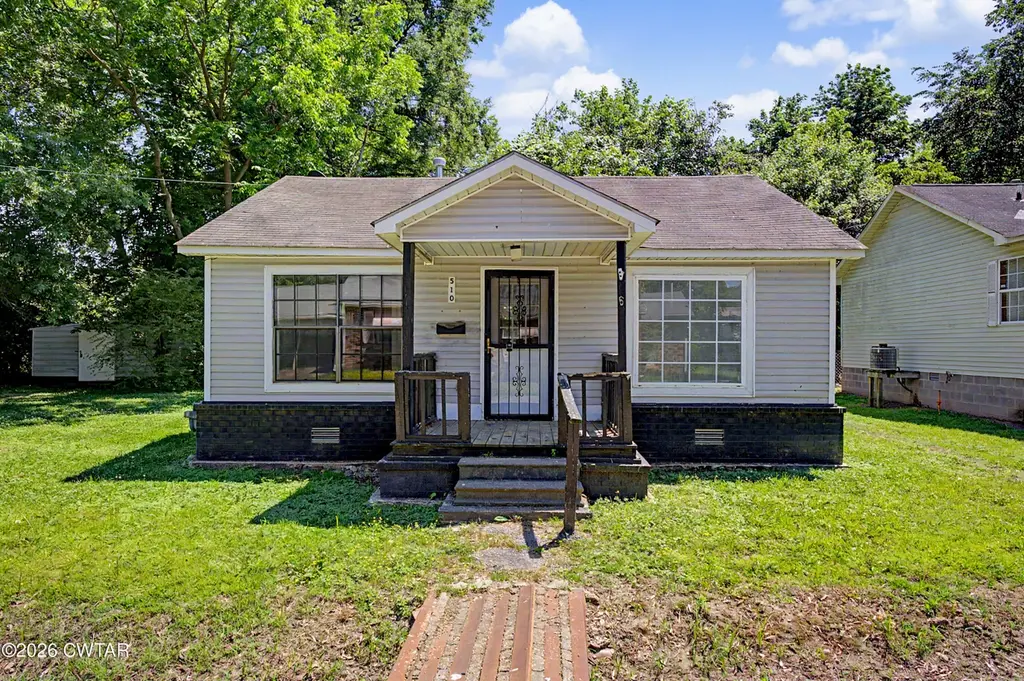
510 Barnes Dr · Trenton, TN
Flood risk 1/10 · Minimal
- FEMA flood zone
- X (unshaded)
- Chance of flooding over 30 yrs
- 0.0%
- Est. flood insurance / yr
- $507 – $1,088
Fire risk 3/10 · Minor
- Est. fire insurance / yr
- $949 – $1,763
Heat risk 6/10 · Moderate
- Hot days now (above 108°F)
- 7 days/yr
- Hot days in 30 yrs
- 20 days/yr
Wind risk 4/10 · Minor
- Chance of severe wind over 30 yrs
- 11.0%
Air-quality risk 1/10 · Minimal
- Unhealthy air days now
- 0 days/yr
- Unhealthy air days in 30 yrs
- 0 days/yr
Risk factors via First Street. Map © Google.
Why this score? — see what drove the B- grade
The composite is a weighted blend of 9 inputs, each scored 0–100. Each bar is that input's sub-score; the figure is the points it added to the 100-point composite (weight × sub-score).
- Cash flow +30.0/30.0
- DSCR +10.0/10.0
- 1% rule +9.1/10.0
- ARV discount +7.5/15.0
- Livability +2.6/5.0
- Rent growth +2.5/5.0
- Condition / age +2.5/5.0
- Schools +2.0/10.0
- Appreciation +0.0/10.0
$59,900
🖨 Deal sheet 📄 Offer letter ✓ Due diligence
Listing remarks MLS
THE WORK IS DONE ALREADY in this cute and cozy home just off of Gibson Rd. Fresh paint inside and out, new flooring. Most homes offered at this price need the work that has already been competed here. Come by and see it before it's too late.
Key facts
- 2 parking spots
- Built 1944
- Listed 31 days
Property features AI
Exterior
- Parking: 2 parking spaces
- Security: Smoke detector(s)
- Utilities: Public water; Public sewer; Electricity available; Natural gas available; Cable available; Phone available
- Home design: Single-family residence; One story
- Construction: Brick and vinyl siding exterior; Block foundation; Shingle roof
- Exterior features: Covered front porch; Storage structure; Level lot; Asphalt road frontage on a city street (publicly maintained)
Interior
- Kitchen: Electric range; Range hood; Refrigerator
- Bedrooms: 2 bedrooms on the main level
- Flooring: Carpet; Vinyl
- Bathrooms: 1 full bathroom (main level)
- Heating & cooling: Cooling with ceiling fan(s)
- Interior features: Ceiling fan(s)
- Laundry & utility: Washer; Washer hookup; Electric dryer hookup; Dedicated laundry room; Gas water heater
Neighborhood map
What this means for you Summary
Snapshot
- This is a 2-bed/1.0-bath single-family listed at $60k.
Deal economics
- At list price, monthly cash flow is $289 ($3k/yr) — positive.
- The deal already cash-flows at list — no discount required.
- Meets the 1% rule at list price ($847 rent vs $60k).
- Recommended offer: $58k (3.0% below list) — sets the bar for market timing.
Location & tenants
- Location reads 51/100 on livability (#408 in TN) — a working-class tenant base; expect higher turnover. Strengths: cost of living A+, housing A-; Watch: health & safety C-, schools F, crime D-.
- Trenton (town): math 24% / reading 24% proficiency, ranked #99 of 139 in TN (top 71%) — low school quality limits family demand, transient renter base, plan for 1-2y turnover.
- Market conditions: 82 active listings in the ZIP; 155 units permitted in Gibson County in 2024 (0 in 5+ unit buildings).
Forward outlook
- Local home prices are declining (-3.0%/yr); year-one equity from $414 of loan paydown is wiped out by about $2k of value loss. Plan a longer hold.
- Gibson County population projected to shrink 8% by 2050 — rents likely to lag national; underwrite the cash flow, not the appreciation.
- At projected returns (-3.0% appreciation + 3.0% rent growth), your $17k cash investment doubles in ~6 years — after that, you're playing with house money.
Negotiation context
- It's been on market 32 days — a 3% lower offer ($58k) is reasonable based on typical stale-listing flexibility.
- 2 sale attempts since 6y ago; this cycle's ask has dropped $5k (8%) from the opening price — seller is motivated, your offer sets the floor, not the list.
- Current owner paid $51k; 17% above their basis — modest negotiation headroom, anchor on the comps not their cost.
Risks & watch-outs
- Watch-outs: built in 1944 — expect roof / HVAC / electrical / plumbing capex.
- Climate carrying-cost: extreme-heat days projected 7→20/yr by 2055 (HVAC capex compounding) — expect insurance premiums to compound above CPI over the hold.
Questions for the listing agent
- It's been on market 32 days. Have you received any prior offers? Is the seller open to a 3% concession, seller financing, or rate buy-down credit?
- Built in 1944 — when were the roof, HVAC, electrical panel, plumbing, and water heater last replaced?
- Is there a deadline driving the sale (1031 exchange, divorce, estate, relocation)? That informs how much negotiation room exists.
- Schools are F-rated, which usually means shorter tenancies and higher turnover. Who's the typical renter profile here, and what's been the actual vacancy rate?
- Crime grade is D in this area — have there been break-ins, vandalism, or insurance claims at this property in the last 3 years? What carrier currently insures it and at what premium?
- What's the average days-on-market for RENTAL listings here right now (not sales)? A rising rental-DOM trend means longer vacancies and softer asking-rent achievability than the comps imply.
- What's the recent tenant-quality profile in this submarket — average credit score on applications, eviction rate, late-payment / NSF rate, and stable-employment percentage? A property-management company in the area should have these aggregated.
- How much new for-sale + rental construction is in the pipeline within 1–3 miles? Heavy new supply typically softens prices + rents 12–24 months out; constrained supply supports both.
Investment metrics
- 1% rule
- 1.41% ✓
- Cap rate
- 12.08%
- Cash-on-cash
- 20.66%
- DSCR
- 1.92
- GRM
- 5.9
CMA / ARV
No comps found within radius.
Projected returns pro-forma
-3.0% appreciation · 3.0% rent growth · sell at horizon
- IRR
- 13.0%
- Equity multiple
- 1.52×
- Total profit
- $8,677
- Equity at exit
- $8,931
- IRR
- 21.9%
- Equity multiple
- 2.86×
- Total profit
- $31,205
- Equity at exit
- $5,179
Cash invested: $16,772 (down + closing). Projections, not guarantees.
Landlord ↔ Tenant lean methodology
- Overall (STATE)
- 87 Strongly Landlord-Friendly
- State Tennessee
- 87 Strongly Landlord-Friendly · R+13
- County
- — inherits STATE
- City
- — inherits STATE
ZIP-level market 38382
- Home prices YoY
- -14.0%
- Active inventory
- 82
- Price-to-rent
- 5.9×
Monthly cashflow live
- Estimated rent
- $847 medium interval (Pro) →
- Mortgage (P&I)
- −$314
- Tax from tax record
- −$41 /mo · $493/yr
- Insurance
- −$25
- HOA
- −$0
- Vacancy / Maint / Mgmt
- −$178
- Net cashflow
- $289
Break-even live
UW: 25.0% down · 7.5% · 30yr · 1.5% tax · 5.0% vac · 8.0% maint · 8.0% mgmt
Financing live
Cash to close
- Down payment
- $14,975
- Closing costs
- $1,797
- Reserves months
- —
- Total cash needed
- —
Loan-product check · same deal, 3 products live
Conventional
25% down · 7.5% · 30yr
- Down + closing
- —
- Monthly P&I
- —
- Monthly cashflow
- —
- DSCR
- —
- Eligible?
- —
Personal DTI + credit; lowest rate.
DSCR
20% down · 8.5% · 30yr
- Down + closing
- —
- Monthly P&I
- —
- Monthly cashflow
- —
- DSCR
- —
- Eligible?
- —
No personal income docs; deal must DSCR.
Hard money
10% down · 12.0% · 12mo
- Down + closing
- —
- Monthly P&I
- —
- Monthly cashflow
- —
- DSCR
- —
- Eligible?
- —
Short-term bridge; refi at stabilization.
Listing history 20 events
-
2026-06-18days on market $59,900 Active 32 DOM
-
2026-06-17days on market $59,900 Active 31 DOM
-
2026-06-16days on market $59,900 Active 30 DOM
-
2026-06-15days on market $59,900 Active 29 DOM
-
2026-06-13days on market $59,900 Active 27 DOM
-
2026-06-12days on market $59,900 Active 26 DOM
-
2026-06-09days on market $59,900 Active 23 DOM
-
2026-06-08days on market $59,900 Active 22 DOM
-
2026-06-08days on market $59,900 Active 21 DOM
-
2026-06-07days on market $59,900 Active 20 DOM
-
2026-06-03pricedays on market $59,900 Active 17 DOM
-
2026-06-02days on market $64,900 Active 16 DOM
-
2026-06-01days on market $64,900 Active 15 DOM
-
2026-05-31days on market $64,900 Active 14 DOM
-
2026-05-18$64,900 Active
-
2025-09-07price $65,000
-
2025-08-22price $69,900
-
2021-04-27soldstatus $51,000
-
2021-04-23soldstatus $51,000 241-char remark
Show marketing remark (241 chars)
THE WORK IS DONE ALREADY in this cute and cozy home just off of Gibson Rd. Fresh paint inside and out, new flooring. Most homes offered at this price need the work that has already been competed here. Come by and see it before it's too late.
-
2020-12-31$59,000 241-char remark
Show marketing remark (241 chars)
THE WORK IS DONE ALREADY in this cute and cozy home just off of Gibson Rd. Fresh paint inside and out, new flooring. Most homes offered at this price need the work that has already been competed here. Come by and see it before it's too late.
ⓘ Source: listings_history table (triggers on properties + properties_extension) + one-shot
backfill from property_details.listing_events for pre-trigger history.
Tax reassessment forecast TN · Resets to sale price
- Current annual tax
- $493 · $41/mo
- Projected year-2 tax
- $493 · $41/mo
- Expected delta
- $0/yr ($0/mo · 0.0%)
ⓘ Screening estimate from a state-policy table — verify with the county assessor before closing.
Climate risk First Street
- Flood 1/10 Low FEMA zone X (unshaded) · 0% chance over 30 yrs
- Wildfire 3/10 Moderate
- Heat 6/10 Major 7 d/yr ≥108°F today · 20 d/yr by 30 yrs out
- Wind 4/10 Moderate 11% chance of damaging wind over 30 yrs
- Air quality 1/10 Low 0 unhealthy d/yr today · 0 by 30 yrs out
Nearby sold comps map
Loading sold comps map…
Walkable amenities ~0.75 mi
Loading nearby amenities…
Taxation est. · year 1
- Rental income
- $10,161
- − Mortgage interest
- −$3,355
- − Property taxes
- −$493
- − Insurance
- −$300
- − Repairs & maintenance
- −$813
- − Management
- −$813
- − Depreciation
- −$1,743
- Taxable income
- $2,645
- Est. tax owed @ 24.0%
- −$635
- After-tax cash flow
- $2,830/yr
For passive investors: Depreciation is non-cash, so a rental often shows a tax loss while cash-flowing — sheltering income. Rental losses are passive: they offset passive income freely, and up to $25,000/yr can offset ordinary (W-2) income if you actively participate and your MAGI is under $100k (phasing out to $0 by $150k); unused losses carry forward. On sale, claimed depreciation is recaptured at up to 25%, and gains may owe capital-gains tax (a 1031 exchange can defer both). Figures are a year-1 estimate at your 24.0% rate — not tax advice; consult a CPA.
Schools (NCES district)
- District
- Trenton
- NCES district ID
- 4704100
- Math proficiency
- 24% ▼ -13.00%
- Reading proficiency
- 24% ▼ -2.00%
- Median HH income
- $33,930
- Composite
- 19.7/100
- National rank
- #8723
- State rank
- #99 of 139 in TN
Livability — Trenton
- Score
- 51/100
- State rank
- #408
- US rank
- #25391
Category grades
Schools grade is shown separately in the Schools card above.
Census & demographics
- Census place
- Trenton, TN
- Population (ZIP)
- 8,163
Population outlook (Gibson County) Hauer SSP2
- Today (2025)
- 48,793 people
- By 2030
- 48,221 · -1.2%
- By 2040
- 46,793 · -4.1%
- By 2050
- 44,909 · -8.0%
- By 2075
- 40,191 · -17.6%
- By 2100
- 33,574 · -31.2%
Race, ethnicity, and origin ACS 2023
- Neighborhood character
- Predominantly White (75%)
- Race & ethnicity
- White 75% Black 17% Two or more races 5% Hispanic / Latino 3%
- Common ancestry
- Italian 1% Portuguese 1% Slovak 1%
- Foreign-born
- 1% · Canada
- Languages at home
- 98% English-only · Spanish 1%
Political lean MEDSL · Gibson
- 2024 margin
- Solid R (+52.0) · D 23.6% · R 75.5%
- 2008→2024 swing
- -23.2pp toward R · 2008: -28.8pp · 2024: -52.0pp
- All cycles
- 2024: R+52.0 2020: R+47.0 2016: R+43.8 2012: R+32.1 2008: R+28.8
Not yet ingested
- Civics
- —
Market trends
- HPI YoY
- ▼ -30.72%
- Current HPI
- 188.1546
- Rent YoY
- —
- Metro
- —
- State GDP YoY
- ▲ 2.78%
- F500 in state
- 22
Industry mix (Fortune 500 HQ in TN)
| Industry | F500 HQs | Revenue |
|---|---|---|
| Healthcare | 3 | $91B |
|
||
| Retail | 3 | $72B |
|
||
| Transportation / Logistics | 1 | $88B |
|
||
| Paper / Packaging | 1 | $19B |
|
||
| Insurance | 1 | $13B |
|
||
| Energy | 1 | $12B |
|
||
Price history
+10.0% since first listed6 events — show timeline
- 2026-05-18 Listed $64,900 CWTAR
- 2025-09-07 Price Changed $65,000 CWTAR
- 2025-08-22 Price Changed $69,900 CWTAR
- 2021-04-27 Sold (Public Records) $51,000 Public Records
- 2021-04-23 Sold (MLS) $51,000 CWTAR
- 2020-12-31 Listed $59,000 CWTAR
Property tax history
+8.7%/yrLatest (2025): $493 · +56.0% YoY. Source: county tax records.
Cash-flow waterfall
monthlySold comps — $/sqft
last 12 mo · ≤1 miLoading sold comps…