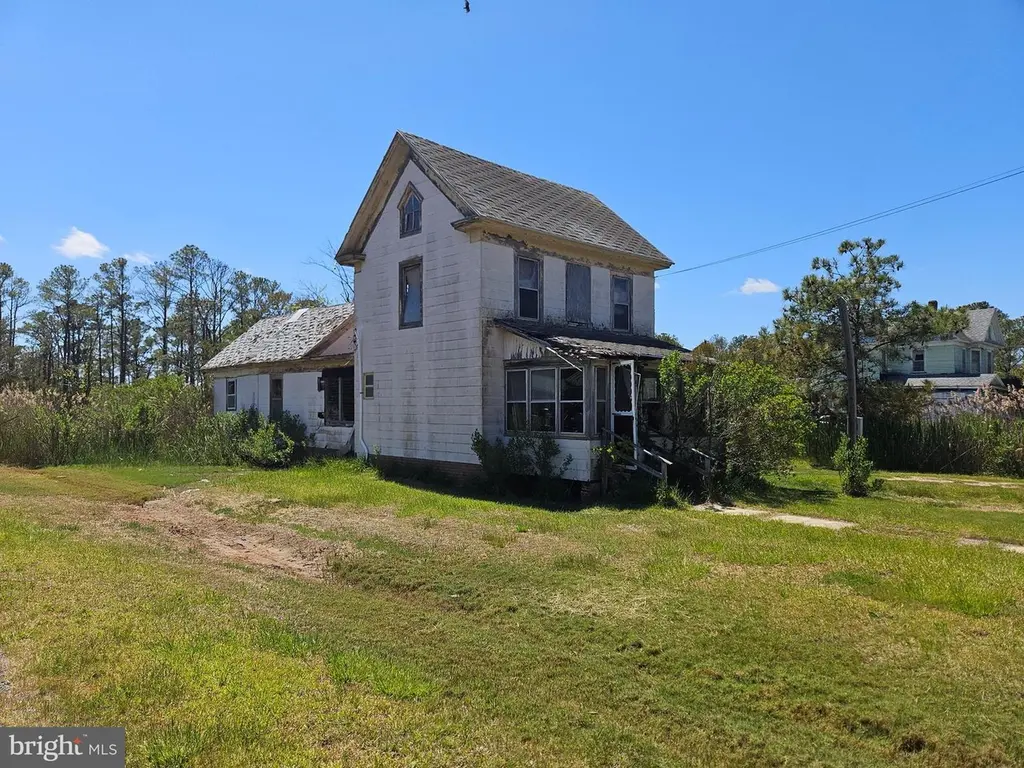
2800 Calvary Rd · Crisfield, MD
Flood risk 10/10 · Severe
- FEMA flood zone
- AE
- Chance of flooding over 30 yrs
- 0.99%
- Est. flood insurance / yr
- $1,737 – $8,500
Fire risk 5/10 · Moderate
- Est. fire insurance / yr
- $755 – $1,403
Heat risk 9/10 · Severe
- Hot days now (above 101°F)
- 7 days/yr
- Hot days in 30 yrs
- 19 days/yr
Wind risk 8/10 · Major
- Chance of severe wind over 30 yrs
- 80.0%
Air-quality risk 2/10 · Minimal
- Unhealthy air days now
- 1 days/yr
- Unhealthy air days in 30 yrs
- 2 days/yr
Risk factors via First Street. Map © Google.
Why this score? — see what drove the C- grade
The composite is a weighted blend of 9 inputs, each scored 0–100. Each bar is that input's sub-score; the figure is the points it added to the 100-point composite (weight × sub-score).
- Cash flow +15.0/30.0
- Appreciation +10.0/10.0
- ARV discount +7.5/15.0
- 1% rule +5.0/10.0
- DSCR +5.0/10.0
- Livability +3.4/5.0
- Rent growth +2.5/5.0
- Condition / age +2.5/5.0
- Schools +1.5/10.0
$15,000
🖨 Deal sheet (PDF) 📄 Offer letter ✓ Due diligence
Listing remarks
HOUSE WAS BEAUTIFUL BACK IN ITS DAY. .ALOT OF SWEAT EQUITY COULD MAKE IT HAPPEN AGAIN. .. OR BUILD YOUR OWN VACATION HOUSE OR DREAM HOME ON THIS LARGE LOT IN A NICE LOCATION CLOSE TO WATER, BRING YOUR BOAT AND CRAB NETS, JENKINS CREEK PUBLIC BOAT RAMP IN RIGHT DOWN THE ROAD. LOT HAS PUBLIC SEWER RUNNING TO IT, NEEDS TO BE HOOKED UP. MANY POSSIBILITIES FOR THIS PRICE!! * Sold in AS IS condition. * Also listed as Land- MLS# MDSO2007308.
Key facts
- Public sewer
- Close to water
- Large lot
Tags
Property features AI
Exterior
- Parking: Off-street parking
- Utilities: Public sewer; Well required
- Home design: Detached property; Major rehab needed
- Construction: Asbestos construction material; Block foundation; Above-grade and below-grade structures; Finished above-grade area reported by assessor
- Exterior features: Trees/wooded lot; Located outside city limits; Federal Flood Zone
Interior
- Bedrooms: Three bedrooms on the upper level
- Bathrooms: One full bathroom
- Interior features: Living area reported by assessor; No basement
Neighborhood map
What this means for you Summary
Snapshot
- This is a 3-bed/1.0-bath single-family listed at $15k.
Deal economics
- At list price, monthly cash flow is $315 ($4k/yr) — positive.
- The deal already cash-flows at list — no discount required.
- Meets the 1% rule at list price ($1k rent vs $15k).
- Cap rate 65.6% vs local median 1.5% in Crisfield — top-decile yield for the area; either an underpriced asset or a hidden risk that comps aren't pricing in. Stress-test before assuming the spread holds.
Location & tenants
- Location reads 68/100 on livability (#199 in MD) — a middle-class / working-renter tenant base. Strengths: crime A+, cost of living A+, health & safety A+; Watch: schools F, amenities F, commute F.
- Somerset County Public Schools (town): math 12% / reading 23% proficiency, ranked #22 of 24 in MD (top 92%) — low school quality limits family demand, transient renter base, plan for 1-2y turnover; 64% free/reduced lunch — lower-income household profile, screen leases tightly.
- Market conditions: 92 active listings in the ZIP; 49 units permitted in Somerset County in 2024 (0 in 5+ unit buildings).
Forward outlook
- In year one you build about $2k of equity ($104 loan paydown + $2k appreciation (10.0% local appreciation)).
- Somerset County population projected at -16% by 2050 — secular population decline; favor cash flow + early exit over multi-decade hold.
- At projected returns (10.0% appreciation + 3.0% rent growth), your $4k cash investment doubles in ~1 year — after that, you're playing with house money.
Negotiation context
- Only 9 days on market — expect competitive offers; lowballing is unlikely to land.
- 2 sale attempts with the ask held roughly flat each time — persistent listings suggest the price (not the market) is what's stuck; bring a comps-based counter.
- Current owner paid $10k; list at $15k implies a 50% gain — meaningful room to come down on a strong offer.
Risks & watch-outs
- Watch-outs: property tax is 2.8% of price; flood insurance adds $427/mo; built in 1900 — expect roof / HVAC / electrical / plumbing capex.
- Climate carrying-cost: in FEMA flood zone AE (mandatory federal flood insurance); severe wind risk, 80% chance of damaging wind over 30y; moderate wildfire risk; extreme-heat days projected 7→19/yr by 2055 (HVAC capex compounding) — expect insurance premiums to compound above CPI over the hold.
Questions for the listing agent
- Built in 1900 — when were the roof, HVAC, electrical panel, plumbing, and water heater last replaced?
- Property tax is high relative to price — has the assessment been appealed recently, and will the sale trigger a re-assessment?
- What's the actual annual flood-insurance premium (NFIP or private), and is the property in a SFHA with mandatory coverage?
- Is there a deadline driving the sale (1031 exchange, divorce, estate, relocation)? That informs how much negotiation room exists.
- Schools are F-rated, which usually means shorter tenancies and higher turnover. Who's the typical renter profile here, and what's been the actual vacancy rate?
- What's the average days-on-market for RENTAL listings here right now (not sales)? A rising rental-DOM trend means longer vacancies and softer asking-rent achievability than the comps imply.
- What's the recent tenant-quality profile in this submarket — average credit score on applications, eviction rate, late-payment / NSF rate, and stable-employment percentage? A property-management company in the area should have these aggregated.
- How much new for-sale + rental construction is in the pipeline within 1–3 miles? Heavy new supply typically softens prices + rents 12–24 months out; constrained supply supports both.
Investment metrics
- 1% rule
- 7.27% ✓
- Cap rate
- 65.58%
- Cash-on-cash
- 211.74%
- DSCR
- 10.42
- GRM
- 1.1
CMA / ARV
- ARV (median comp)
- $81,851
- List price
- $15,000
- Delta
- -81.67%
- Verdict
- UNDERPRICED
- Comps
- 18 within 1.0 mi
Show comp detail 4 sales within ~0.75 mi
| Address | Dist | Beds/Ba | Sqft | Sold | Price | $/sf | Match |
|---|---|---|---|---|---|---|---|
| 2800 Calvary Rd | 0.00mi | 3/1.0 | 1,048 (0%) | 1mo | $10,000 | $10 | 100 |
| 2902 Byrdtown Rd | 0.42mi | 3/1.0 | 1,072 (+2%) | 14mo | $80,000 | $75 | 65 |
| 2990 Byrdtown Rd | 0.57mi | 3/1.0 | 1,000 (-5%) | 6mo | $119,000 | $119 | 61 |
| 3053 Lawsonia Rd | 0.70mi | 2/1.0 (-1) | 1,064 (+2%) | 13mo | $12,500 | $12 | 49 |
Match score weights: distance 35% · size 25% · config 20% · recency 20%. Top-matched comps best support the ARV.
Projected returns pro-forma
10.0% appreciation · 3.0% rent growth · sell at horizon
- IRR
- 99.4%
- Equity multiple
- 7.78×
- Total profit
- $28,493
- Equity at exit
- $13,513
- IRR
- 94.9%
- Equity multiple
- 17.36×
- Total profit
- $68,726
- Equity at exit
- $29,142
Cash invested: $4,200 (down + closing). Projections, not guarantees.
Landlord ↔ Tenant lean methodology
- Overall (STATE)
- 27 Tenant-Leaning
- State Maryland
- 27 Tenant-Leaning · D+14
- County
- — inherits STATE
- City
- — inherits STATE
ZIP-level market 21817
- Home prices YoY
- 7.3%
- Active inventory
- 92
- Price-to-rent
- 1.1×
Monthly cashflow live
- Estimated rent
- $1,091 medium interval (Pro) →
- Mortgage (P&I)
- −$79
- Tax from tax record
- −$36 /mo · $427/yr
- Insurance
- −$6
- Flood insurance flood zone
- −$427 /mo · $5,118/yr
- HOA
- −$0
- Vacancy / Maint / Mgmt
- −$229
- Net cashflow
- $315
Break-even live
Sensitivity live
| Price | -10% $323 | -5% $319 | +0% $315 | +5% $310 | +10% $306 |
|---|---|---|---|---|---|
| Rent | -10% $228 | -5% $271 | +0% $315 | +5% $358 | +10% $401 |
| Rate | -1.0pp $322 | -0.5pp $318 | base $315 | +0.5pp $311 | +1.0pp $307 |
UW: 25.0% down · 7.5% · 30yr · 1.5% tax · 5.0% vac · 8.0% maint · 8.0% mgmt
Financing live
Cash to close
- Down payment
- $3,750
- Closing costs
- $450
- Reserves months
- —
- Total cash needed
- —
Loan-product check · same deal, 3 products live
Conventional
25% down · 7.5% · 30yr
- Down + closing
- —
- Monthly P&I
- —
- Monthly cashflow
- —
- DSCR
- —
- Eligible?
- —
Personal DTI + credit; lowest rate.
DSCR
20% down · 8.5% · 30yr
- Down + closing
- —
- Monthly P&I
- —
- Monthly cashflow
- —
- DSCR
- —
- Eligible?
- —
No personal income docs; deal must DSCR.
Hard money
10% down · 12.0% · 12mo
- Down + closing
- —
- Monthly P&I
- —
- Monthly cashflow
- —
- DSCR
- —
- Eligible?
- —
Short-term bridge; refi at stabilization.
Listing history 4 events
-
2026-05-13status Pending 441-char remark
-
2026-05-13historical
-
2026-05-06$15,000 Active
-
2026-05-04$15,000 Active 441-char remark
ⓘ Source: listings_history table (triggers on properties + properties_extension) + one-shot
backfill from property_details.listing_events for pre-trigger history.
Tax reassessment forecast MD · Partial reset (capped growth)
- Current annual tax
- $427 · $36/mo
- Projected year-2 tax
- $427 · $36/mo
- Expected delta
- $0/yr ($0/mo · 0.0%)
ⓘ Screening estimate from a state-policy table — verify with the county assessor before closing.
Climate risk First Street
- Flood 10/10 Extreme FEMA zone AE · 99% chance over 30 yrs
- Wildfire 5/10 Major
- Heat 9/10 Extreme 7 d/yr ≥101°F today · 19 d/yr by 30 yrs out
- Wind 8/10 Severe 80% chance of damaging wind over 30 yrs
- Air quality 2/10 Low 1 unhealthy d/yr today · 2 by 30 yrs out
Nearby sold comps map
Loading sold comps map…
Walkable amenities ~0.75 mi
Loading nearby amenities…
Taxation est. · year 1
- Rental income
- $13,088
- − Mortgage interest
- −$840
- − Property taxes
- −$427
- − Insurance
- −$5,194
- − Repairs & maintenance
- −$1,047
- − Management
- −$1,047
- − Depreciation
- −$436
- Taxable income
- $4,096
- Est. tax owed @ 24.0%
- −$983
- After-tax cash flow
- $2,792/yr
For passive investors: Depreciation is non-cash, so a rental often shows a tax loss while cash-flowing — sheltering income. Rental losses are passive: they offset passive income freely, and up to $25,000/yr can offset ordinary (W-2) income if you actively participate and your MAGI is under $100k (phasing out to $0 by $150k); unused losses carry forward. On sale, claimed depreciation is recaptured at up to 25%, and gains may owe capital-gains tax (a 1031 exchange can defer both). Figures are a year-1 estimate at your 24.0% rate — not tax advice; consult a CPA.
Schools (NCES district)
- District
- Somerset County Public Schools
- NCES district ID
- 2400570
- Math proficiency
- 12% ▼ -7.00%
- Reading proficiency
- 23% ▼ -14.00%
- Median HH income
- $38,810
- Composite
- 14.73/100
- National rank
- #9396
- State rank
- #22 of 24 in MD
Livability — Crisfield
- Score
- 68/100
- State rank
- #199
- US rank
- #9181
Category grades
Schools grade is shown separately in the Schools card above.
Census & demographics
- Population (ZIP)
- 4,102
Population outlook (Somerset County) Hauer SSP2
- Today (2025)
- 24,474 people
- By 2030
- 23,547 · -3.8%
- By 2040
- 21,498 · -12.2%
- By 2050
- 20,427 · -16.5%
- By 2075
- 16,594 · -32.2%
- By 2100
- 12,132 · -50.4%
Race, ethnicity, and origin ACS 2023
- Neighborhood character
- Predominantly White (72%)
- Race & ethnicity
- White 72% Black 20% Two or more races 4% Hispanic / Latino 3% Asian 1%
- Common ancestry
- Italian 2% Serbian 1% Romanian 1%
- Foreign-born
- 2% · Canada
- Languages at home
- 97% English-only · Spanish 2%
Political lean MEDSL · Somerset
- 2024 margin
- R (+17.4) · D 40.2% · R 57.5% · Other 2.3%
- 2008→2024 swing
- -14.8pp toward R · 2008: -2.6pp · 2024: -17.4pp
- All cycles
- 2024: R+17.4 2020: R+14.8 2016: R+17.9 2012: R+2.5 2008: R+2.6
Not yet ingested
- Civics
- —
Market trends
- HPI YoY
- ▲ 19.92%
- Current HPI
- 292.866
- Rent YoY
- —
- Metro
- —
- State GDP YoY
- ▲ 2.97%
- F500 in state
- 12
Industry mix (Fortune 500 HQ in MD)
| Industry | F500 HQs | Revenue |
|---|---|---|
| Aerospace / Defense | 1 | $71B |
|
||
| Utilities | 1 | $25B |
|
||
| Hotels | 1 | $24B |
|
||
| Consumer Goods | 1 | $7B |
|
||
| Real Estate | 1 | $6B |
|
||
| Chemicals | 1 | $2B |
|
||
Price history
-33.3% since first listed5 events — show timeline
- 2026-06-03 Sold (MLS) $10,000 BRIGHT MLS
- 2026-05-13 Pending — BRIGHT MLS
- 2026-05-13 Listing Removed — BRIGHT MLS
- 2026-05-06 Listed $15,000 BRIGHT MLS
- 2026-05-04 Listed $15,000 BRIGHT MLS
Property tax history
+0.7%/yrLatest (2025): $427 · +15.9% YoY. Source: county tax records.
Cash-flow waterfall
monthlySold comps — $/sqft
last 12 mo · ≤1 miLoading sold comps…