1460 Sam Nelson Rd · Canton, GA
Flood risk 1/10 · Minimal
- FEMA flood zone
- X (unshaded)
- Chance of flooding over 30 yrs
- 0.0%
- Est. flood insurance / yr
- $507 – $1,088
Fire risk 6/10 · Moderate
- Est. fire insurance / yr
- $963 – $1,789
Heat risk 4/10 · Minor
- Hot days now (above 103°F)
- 7 days/yr
- Hot days in 30 yrs
- 16 days/yr
Wind risk 4/10 · Minor
- Chance of severe wind over 30 yrs
- 11.0%
Air-quality risk 4/10 · Minor
- Unhealthy air days now
- 5 days/yr
- Unhealthy air days in 30 yrs
- 6 days/yr
Risk factors via First Street. Map © Google.
Why this score? — see what drove the C grade
The composite is a weighted blend of 9 inputs, each scored 0–100. Each bar is that input's sub-score; the figure is the points it added to the 100-point composite (weight × sub-score).
- Cash flow +29.0/30.0
- DSCR +10.0/10.0
- 1% rule +8.1/10.0
- Schools +4.2/10.0
- Livability +3.3/5.0
- Condition / age +2.5/5.0
- Rent growth +2.1/5.0
- ARV discount +0.0/15.0
- Appreciation +0.0/10.0
$130,000
🖨 Deal sheet 📄 Offer letter ✓ Due diligence
Listing remarks MLS
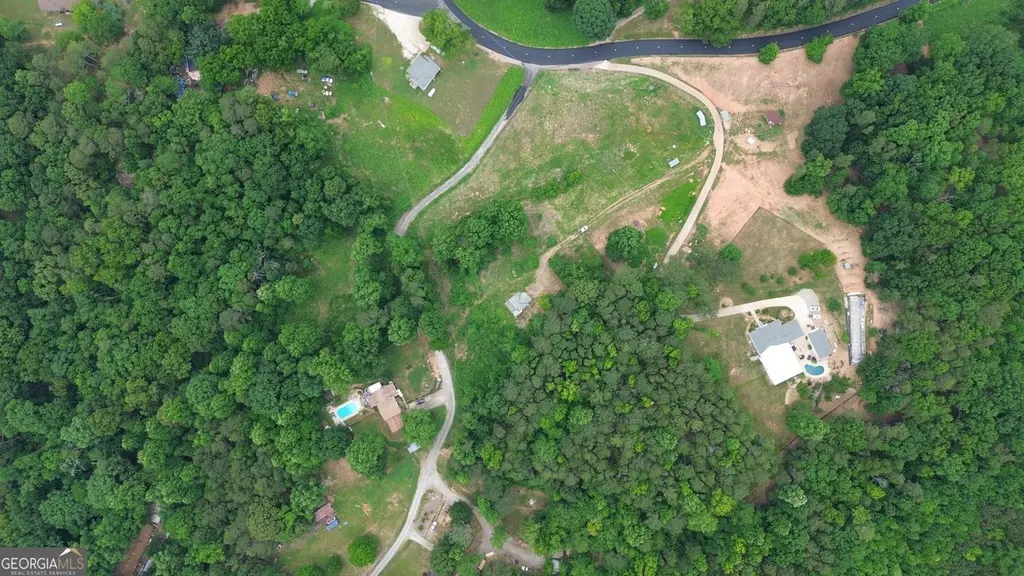
Three acres in Canton with public water, electric, and a septic tank already available. The existing home is a tear-down, so the value is in the land, location, and utilities. The lot offers room for a custom build, outdoor space, a workshop, garden areas, or added privacy. The property is a short drive to Riverstone Parkway, Canton Marketplace, downtown Canton, and The Mill on Etowah for shopping, dining, groceries, and services. Nearby outdoor options include Etowah River Park, Heritage Park, Boling Park, and Hickory Log Creek Reservoir, offering trails, green space, river access, fishing, and kayaking. Bring your plans and explore the potential of this 3-acre Canton property.
Key facts
- Septic tank
- Electric
- Custom build
Tags
Property features AI
Exterior
- Parking: Four total parking spaces
- Utilities: Public water; Septic tank sewer
- Home design: One level; Other construction materials
- Construction: Composition/Shingle roof
- Exterior features: Screened patio/porch; Property listed as fixer condition
Interior
- Kitchen: No kitchen features listed
- Bedrooms: Two main-level bedrooms; Bedroom features: none listed
- Flooring: Carpet flooring
- Bathrooms: One full bathroom (main level); Master bathroom: none listed
- Interior features: One fireplace; No shared/common walls; Other interior features
- Laundry & utility: No laundry/utility appliances listed
Neighborhood map
What this means for you Summary
Snapshot
- This is a 2-bed/1.0-bath single-family listed at $130k.
Deal economics
- At list price, monthly cash flow is $446 ($5k/yr) — positive.
- The deal already cash-flows at list — no discount required.
- Meets the 1% rule at list price ($2k rent vs $130k).
- Cap rate 10.4% vs local median 2.7% in Canton — top-decile yield for the area; either an underpriced asset or a hidden risk that comps aren't pricing in. Stress-test before assuming the spread holds.
Location & tenants
- Location reads 66/100 on livability (#200 in GA) — a middle-class / working-renter tenant base. Strengths: housing A+, crime A, cost of living B; Watch: amenities F, commute F, health & safety F.
- Cherokee County (suburban): math 46% / reading 48% proficiency, ranked #17 of 174 in GA (top 10%) — families likely to look elsewhere, expect single-tenant / working-renter base with shorter leases.
- Zoned schools: R. M. Moore Elementary School (math 31% / reading 29%, grade F, #627 of 1,228 statewide, top 51%, 1,021 students, 60% FRL); Teasley Middle School (math 28% / reading 37%, grade F, #221 of 470 statewide, top 48%, 1,606 students, 52% FRL); Cherokee High School (math 35% / reading 40%, grade F, #65 of 424 statewide, top 16%, 2,937 students, 38% FRL) — zoned schools average 50% FRL vs 26% district-wide (24 pts higher); higher-poverty schools than district average — tighter screening recommended.
- Zoned-school proficiency averages 33% at this address vs 47% district-wide (-14 pts) — the specific schools serving this property underperform the Cherokee County average; the district grade overstates school quality for this exact location.
- Market conditions: Rents soft (-1.6%/yr); 637 active listings in the ZIP; solid renter incomes; 2,665 units permitted in Cherokee County in 2024 (852 in 5+ unit buildings).
Forward outlook
- Local home prices are declining (-3.0%/yr); year-one equity from $899 of loan paydown is wiped out by about $4k of value loss. Plan a longer hold.
- Cherokee County population projected at +34% by 2050 — long-run rental-demand tailwind backs the buy-and-hold thesis.
Negotiation context
- Only 7 days on market — expect competitive offers; lowballing is unlikely to land.
- 6 sale attempts since 2y ago with the ask held roughly flat each time — persistent listings suggest the price (not the market) is what's stuck; bring a comps-based counter.
- Current owner paid $92k; 41% above their basis — modest negotiation headroom, anchor on the comps not their cost.
Risks & watch-outs
- Watch-outs: built in 1954 — expect roof / HVAC / electrical / plumbing capex.
- Climate carrying-cost: major wildfire risk — expect insurance premiums to compound above CPI over the hold.
Questions for the listing agent
- Built in 1954 — when were the roof, HVAC, electrical panel, plumbing, and water heater last replaced?
- Is there a deadline driving the sale (1031 exchange, divorce, estate, relocation)? That informs how much negotiation room exists.
- Schools are D-rated, which usually means shorter tenancies and higher turnover. Who's the typical renter profile here, and what's been the actual vacancy rate?
- What's the average days-on-market for RENTAL listings here right now (not sales)? A rising rental-DOM trend means longer vacancies and softer asking-rent achievability than the comps imply.
- What's the recent tenant-quality profile in this submarket — average credit score on applications, eviction rate, late-payment / NSF rate, and stable-employment percentage? A property-management company in the area should have these aggregated.
- How much new for-sale + rental construction is in the pipeline within 1–3 miles? Heavy new supply typically softens prices + rents 12–24 months out; constrained supply supports both.
Investment metrics
- 1% rule
- 1.31% ✓
- Cap rate
- 10.41%
- Cash-on-cash
- 14.71%
- DSCR
- 1.65
- GRM
- 6.4
CMA / ARV
- ARV (on-the-fly)
- $91,773
- Comps found
- 1
Show comp detail 1 sale within ~0.75 mi
| Address | Dist | Beds/Ba | Sqft | Sold | Price | $/sf | Match |
|---|---|---|---|---|---|---|---|
| 1460 Sam Nelson Rd | 0.00mi | 2/1.0 | 927 (0%) | 17mo | $92,000 | $99 | 86 |
Match score weights: distance 35% · size 25% · config 20% · recency 20%. Top-matched comps best support the ARV.
Projected returns pro-forma
-3.0% appreciation · 0.0% rent growth · sell at horizon
- IRR
- 1.8%
- Equity multiple
- 1.07×
- Total profit
- $2,398
- Equity at exit
- $19,383
- IRR
- 8.2%
- Equity multiple
- 1.54×
- Total profit
- $19,518
- Equity at exit
- $11,240
Cash invested: $36,400 (down + closing). Projections, not guarantees.
Landlord ↔ Tenant lean methodology
- Overall (STATE)
- 90 Strongly Landlord-Friendly
- State Georgia
- 90 Strongly Landlord-Friendly · R+3
- County
- — inherits STATE
- City
- — inherits STATE
ZIP-level market 30114
- Home prices YoY
- -30.3%
- Rents YoY
- -1.6%
- Active inventory
- 637
- Price-to-rent
- 6.4×
Monthly cashflow live
- Estimated rent
- $1,702 medium interval (Pro) →
- Mortgage (P&I)
- −$682
- Tax est. 1.5%
- −$162 /mo · $1,950/yr
- Insurance
- −$54
- HOA
- −$0
- Vacancy / Maint / Mgmt
- −$357
- Net cashflow
- $446
Break-even live
UW: 25.0% down · 7.5% · 30yr · 1.5% tax · 5.0% vac · 8.0% maint · 8.0% mgmt
Financing live
Cash to close
- Down payment
- $32,500
- Closing costs
- $3,900
- Reserves months
- —
- Total cash needed
- —
Loan-product check · same deal, 3 products live
Conventional
25% down · 7.5% · 30yr
- Down + closing
- —
- Monthly P&I
- —
- Monthly cashflow
- —
- DSCR
- —
- Eligible?
- —
Personal DTI + credit; lowest rate.
DSCR
20% down · 8.5% · 30yr
- Down + closing
- —
- Monthly P&I
- —
- Monthly cashflow
- —
- DSCR
- —
- Eligible?
- —
No personal income docs; deal must DSCR.
Hard money
10% down · 12.0% · 12mo
- Down + closing
- —
- Monthly P&I
- —
- Monthly cashflow
- —
- DSCR
- —
- Eligible?
- —
Short-term bridge; refi at stabilization.
Listing history 6 events
-
2026-06-18days on market $130,000 Active 7 DOM
-
2026-06-17days on market $130,000 Active 6 DOM
-
2026-06-16days on market $130,000 Active 5 DOM
-
2026-06-15days on market $130,000 Active 4 DOM
-
2026-06-13remarks 687-char remark
-
2026-06-13$130,000 Active 2 DOM
ⓘ Source: listings_history table (triggers on properties + properties_extension) + one-shot
backfill from property_details.listing_events for pre-trigger history.
Climate risk First Street
- Flood 1/10 Low FEMA zone X (unshaded) · 0% chance over 30 yrs
- Wildfire 6/10 Major
- Heat 4/10 Moderate 7 d/yr ≥103°F today · 16 d/yr by 30 yrs out
- Wind 4/10 Moderate 11% chance of damaging wind over 30 yrs
- Air quality 4/10 Moderate 5 unhealthy d/yr today · 6 by 30 yrs out
Nearby sold comps map
Loading sold comps map…
Walkable amenities ~0.75 mi
Loading nearby amenities…
Taxation est. · year 1
- Rental income
- $20,426
- − Mortgage interest
- −$7,282
- − Property taxes
- −$1,950
- − Insurance
- −$650
- − Repairs & maintenance
- −$1,634
- − Management
- −$1,634
- − Depreciation
- −$3,782
- Taxable income
- $3,494
- Est. tax owed @ 24.0%
- −$839
- After-tax cash flow
- $4,517/yr
For passive investors: Depreciation is non-cash, so a rental often shows a tax loss while cash-flowing — sheltering income. Rental losses are passive: they offset passive income freely, and up to $25,000/yr can offset ordinary (W-2) income if you actively participate and your MAGI is under $100k (phasing out to $0 by $150k); unused losses carry forward. On sale, claimed depreciation is recaptured at up to 25%, and gains may owe capital-gains tax (a 1031 exchange can defer both). Figures are a year-1 estimate at your 24.0% rate — not tax advice; consult a CPA.
Schools (NCES district)
- District
- Cherokee County
- NCES district ID
- 1301110
- Math proficiency
- 46% ▼ -11.00%
- Reading proficiency
- 48% ▼ -8.00%
- Median HH income
- $69,295
- Composite
- 42.14/100
- National rank
- #3304
- State rank
- #17 of 174 in GA
Livability — Canton
- Score
- 66/100
- State rank
- #200
- US rank
- #12301
Category grades
Schools grade is shown separately in the Schools card above.
Census & demographics
- County
- Cherokee County · 289,977 people
- City population
- 116,078
- Metro
- Atlanta-Sandy Springs-Alpharetta, GA
- Population (ZIP)
- 62,391
- Household income
- $98,902
- Rent vs Own
- Severe rent burden
- 1820.0
Population outlook (Cherokee County) Hauer SSP2
- Today (2025)
- 281,923 people
- By 2030
- 303,845 · +7.8%
- By 2040
- 344,738 · +22.3%
- By 2050
- 379,010 · +34.4%
- By 2075
- 449,617 · +59.5%
- By 2100
- 484,103 · +71.7%
Race, ethnicity, and origin ACS 2023
- Neighborhood character
- Predominantly White (68%)
- Race & ethnicity
- White 68% Hispanic / Latino 18% Two or more races 9% Black 9% Native American 4%
- Hispanic origin (detail)
- Mexican 7%
- Common ancestry
- Slovak 3% Italian 2% Romanian 1%
- Foreign-born
- 10% · Canada, Jamaica
- Languages at home
- 85% English-only · Spanish 12% Other Indo-European 1%
Political lean MEDSL · Cherokee
- 2024 margin
- Solid R (+39.0) · D 30.1% · R 69.1%
- 2008→2024 swing
- +12.1pp toward D · 2008: -51.1pp · 2024: -39.0pp
- All cycles
- 2024: R+39.0 2020: R+39.2 2016: R+50.0 2012: R+57.8 2008: R+51.1
Not yet ingested
- Civics
- —
Market trends
- HPI YoY
- ▼ -106.82%
- Current HPI
- 245.474
- Rent YoY
- ▼ -1.63%
- Metro
- Atlanta-Sandy Springs-Alpharetta, GA
- State GDP YoY
- ▲ 2.66%
- F500 in state
- 28
Industry mix (Fortune 500 HQ in GA)
| Industry | F500 HQs | Revenue |
|---|---|---|
| Paper / Packaging | 2 | $29B |
|
||
| Retail | 1 | $160B |
|
||
| Transportation / Logistics | 1 | $91B |
|
||
| Airlines | 1 | $62B |
|
||
| Consumer Goods | 1 | $47B |
|
||
| Utilities | 1 | $25B |
|
||
Price history
+1283.0% since first listed18 events — show timeline
- 2026-06-12 Listing Removed — GAMLS
- 2026-06-11 Listed $130,000 FMLS
- 2026-06-11 Listed $130,000 FMLS
- 2026-06-11 Listed $130,000 GAMLS
- 2026-06-11 Listed $130,000 GAMLS
- 2025-01-27 Sold (Public Records) $92,000 Public Records
- 2025-01-24 Sold (Public Records) $55,500 Public Records
- 2025-01-23 Sold (MLS) $92,000 FMLS
- 2025-01-21 Sold (MLS) $92,000 GAMLS
- 2025-01-18 Pending — GAMLS
- 2025-01-18 Pending — FMLS
- 2025-01-11 Contingent — FMLS
- 2025-01-11 Contingent — GAMLS
- 2025-01-08 Price Changed $100,000 FMLS
- 2025-01-08 Price Changed $100,000 GAMLS
- 2024-12-18 Listed $120,000 GAMLS
- 2024-12-18 Listed $120,000 FMLS
- 1992-02-13 Sold (Public Records) $9,400 Public Records
Property tax history
-1.4%/yrLatest (2025): $251 · +20.3% YoY. Source: county tax records.
Cash-flow waterfall
monthlySold comps — $/sqft
last 12 mo · ≤1 miLoading sold comps…