 Multi-family
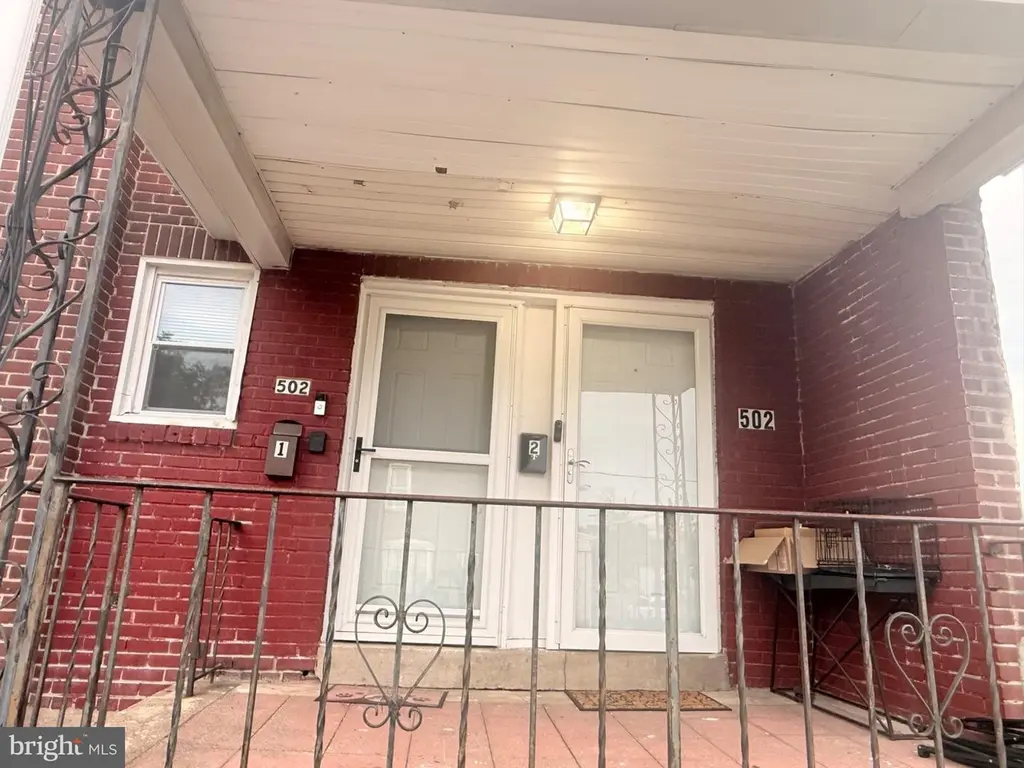
502 W 10th · Chester, PA
Flood risk 1/10 · Minimal
- FEMA flood zone
- X (unshaded)
- Chance of flooding over 30 yrs
- 0.0%
- Est. flood insurance / yr
- $473 – $860
Fire risk 1/10 · Minimal
- Est. fire insurance / yr
- $511 – $949
Heat risk 7/10 · Major
- Hot days now (above 105°F)
- 7 days/yr
- Hot days in 30 yrs
- 15 days/yr
Wind risk 6/10 · Moderate
- Chance of severe wind over 30 yrs
- 27.0%
Air-quality risk 3/10 · Minor
- Unhealthy air days now
- 2 days/yr
- Unhealthy air days in 30 yrs
- 4 days/yr
Risk factors via First Street. Map © Google.
Why this score? — see what drove the C grade
The composite is a weighted blend of 9 inputs, each scored 0–100. Each bar is that input's sub-score; the figure is the points it added to the 100-point composite (weight × sub-score).
- Cash flow +26.7/30.0
- DSCR +9.2/10.0
- 1% rule +7.0/10.0
- Rent growth +4.2/5.0
- Livability +3.7/5.0
- ARV discount +3.5/15.0
- Condition / age +2.5/5.0
- Schools +0.8/10.0
- Appreciation +0.0/10.0
$183,000
🖨 Deal sheet (PDF) 📄 Offer letter ✓ Due diligence
Multi-family units
County records classify this as Multi-Family (2-4 Unit). Listing-text estimate: 1 unit. estimate disagrees with records
Listing remarks MLS
MULTIPLE OFFERS RECEIVED. HIGHEST AND BEST OFFERS FROM ALL INTERESTED PARTIES ARE DUE NO LATER THAN MONDAY JAN 16TH AT NOON. Cash-Cow Alert! Here is a rare 2-family property in the City of Chester. This end-of-row building is configured with a one bedroom apartment on each floor, and each unit has its own entrance door. The first floor has a spacious living room, a bedroom behind that, and an L-shaped kitchen in the rear. Upstairs are 3 large rooms with the kitchen in the middle. The front and rear rooms could be used as bedrooms or one as a living room and the other as a bedroom. This is an excellent opportunity to live in one unit and have a tenant pay the mortgage, or, for an investor to add to their portfolio. Make sure to see this one right away. Make your appointment today!
Key facts
- 115 acre lot
- Built 1930
- Listed 22 days
Property features AI
Finance
- Other: Two total units; Two units leased; two month-to-month units; Units not furnished
- Financial info: Gross scheduled income approximately $25,800; Net operating income approximately $20,800; Total actual rent reported as $25,800; Ownership: Fee simple
Exterior
- Utilities: Public water; Public sewer; Hot water: Other
- Home design: End of row/townhouse; Built year estimated (per assessor)
- Construction: Brick exterior; Brick/mortar foundation
- Exterior features: Brick construction; Brick/mortar foundation; Above-grade and below-grade structures present; No tidal water
Interior
- Bedrooms: One 1-bedroom unit; Two 2-bedroom units
- Heating & cooling: Hot water heating; Natural gas fuel; Cooling listed as 'Other'
- Interior features: End of row/townhouse configuration; Assessor listed living area and finished area information
Neighborhood map
What this means for you Summary
Snapshot
- This is a 3-bed/2.0-bath multifamily listed at $183k.
Deal economics
- At list price, monthly cash flow is $498 ($6k/yr) — positive.
- The deal already cash-flows at list — no discount required.
- Meets the 1% rule at list price ($2k rent vs $183k).
- Recommended offer: $180k (1.5% below list) — sets the bar for market timing.
- Cap rate 9.6% vs local median 7.5% in Chester — meaningfully above typical; check what's discounted (condition, days-on-market, listing class) to confirm the premium yield is real.
Location & tenants
- Location reads 73/100 on livability (#540 in PA) — a middle-class / working-renter tenant base. Strengths: amenities A+, commute A+, cost of living A+; Watch: crime F, employment F.
- Chester-Upland SD (suburban): math 4% / reading 17% proficiency, ranked #533 of 539 in PA (top 99%) — low school quality limits family demand, transient renter base, plan for 1-2y turnover; 81% free/reduced lunch — lower-income household profile, screen leases tightly.
- Zoned schools: Toby Farms Intermediate School (math 2% / reading 12%, grade F, #506 of 512 statewide, top 99%, 299 students, 100% FRL) — zoned schools average 100% FRL vs 81% district-wide (19 pts higher); higher-poverty schools than district average — tighter screening recommended.
- Market conditions: Rents rising fast (+6.9%/yr); 140 active listings in the ZIP; 23 comparable units currently listed for rent nearby; rentals at typical pace (median 19d on market — plan ~3-4 weeks tenant-placement turnaround); lower-income renter base — watch delinquency; 299 units permitted in Delaware County in 2024 (5 in 5+ unit buildings).
- At $2,205/mo this rent would consume 64% of the median local household income ($41k/yr) (locally 2668% of renters already pay >50% of income on rent) — very limited rent-growth headroom before tenants either downsize or default.
Forward outlook
- Local home prices are declining (-3.0%/yr); year-one equity from $1k of loan paydown is wiped out by about $5k of value loss. Plan a longer hold.
- At projected returns (-3.0% appreciation + 6.9% rent growth), your $51k cash investment doubles in ~8 years — after that, you're playing with house money.
Negotiation context
- It's been on market 22 days — a 2% lower offer ($180k) is reasonable based on typical stale-listing flexibility.
- 4 sale attempts since 21y ago with the ask held roughly flat each time — persistent listings suggest the price (not the market) is what's stuck; bring a comps-based counter.
- Current owner paid $70k; list at $183k implies a 161% gain — meaningful room to come down on a strong offer.
Risks & watch-outs
- Watch-outs: built in 1930 — expect roof / HVAC / electrical / plumbing capex.
- Climate carrying-cost: major wind risk, 27% chance of damaging wind over 30y; extreme-heat days projected 7→15/yr by 2055 (HVAC capex compounding) — expect insurance premiums to compound above CPI over the hold.
Questions for the listing agent
- Built in 1930 — when were the roof, HVAC, electrical panel, plumbing, and water heater last replaced?
- Is there a deadline driving the sale (1031 exchange, divorce, estate, relocation)? That informs how much negotiation room exists.
- Schools are F-rated, which usually means shorter tenancies and higher turnover. Who's the typical renter profile here, and what's been the actual vacancy rate?
- Crime grade is F in this area — have there been break-ins, vandalism, or insurance claims at this property in the last 3 years? What carrier currently insures it and at what premium?
- What's the average days-on-market for RENTAL listings here right now (not sales)? A rising rental-DOM trend means longer vacancies and softer asking-rent achievability than the comps imply.
- What's the recent tenant-quality profile in this submarket — average credit score on applications, eviction rate, late-payment / NSF rate, and stable-employment percentage? A property-management company in the area should have these aggregated.
- How much new apartment / multifamily construction is in the pipeline within 1–3 miles? Heavy new supply (>2% of stock underway) typically softens rents 12–24 months out; light construction supports rent growth.
Investment metrics
- 1% rule
- 1.20% ✓
- Cap rate
- 9.56%
- Cash-on-cash
- 11.66%
- DSCR
- 1.52
- GRM
- 6.9
CMA / ARV
- ARV (on-the-fly)
- $168,072
- Comps found
- 1
Show comp detail 1 sale within ~0.75 mi
| Address | Dist | Beds/Ba | Sqft | Sold | Price | $/sf | Match |
|---|---|---|---|---|---|---|---|
| 210 8th St | 0.74mi | 2/— (-1) | 1,310 (+10%) | 8mo | $185,000 | $141 | 38 |
Match score weights: distance 35% · size 25% · config 20% · recency 20%. Top-matched comps best support the ARV.
Projected returns pro-forma
-3.0% appreciation · 6.88% rent growth · sell at horizon
- IRR
- 5.3%
- Equity multiple
- 1.21×
- Total profit
- $11,013
- Equity at exit
- $27,286
- IRR
- 18.0%
- Equity multiple
- 2.76×
- Total profit
- $90,253
- Equity at exit
- $15,822
Cash invested: $51,240 (down + closing). Projections, not guarantees.
Landlord ↔ Tenant lean methodology
- Overall (STATE)
- 62 Landlord-Friendly
- State Pennsylvania
- 62 Landlord-Friendly · EVEN
- County
- — inherits STATE
- City
- — inherits STATE
ZIP-level market 19013
- Rents YoY
- 6.9%
- Active inventory
- 140
- Price-to-rent
- 13.8×
Monthly cashflow live
- Estimated rent
- $2,205 high interval (Pro) →
- Mortgage (P&I)
- −$960
- Tax from tax record
- −$208 /mo · $2,499/yr
- Insurance
- −$76
- HOA
- −$0
- Vacancy / Maint / Mgmt
- −$463
- Net cashflow
- $498
Break-even live
Sensitivity live
| Price | -10% $601 | -5% $550 | +0% $498 | +5% $446 | +10% $394 |
|---|---|---|---|---|---|
| Rent | -10% $324 | -5% $411 | +0% $498 | +5% $585 | +10% $672 |
| Rate | -1.0pp $590 | -0.5pp $544 | base $498 | +0.5pp $450 | +1.0pp $402 |
2-unit breakdown (identical units grouped — click to expand)
| Units | Beds | Baths | Est. rent |
|---|---|---|---|
| 2× units | 1 | 1 | $2,206 |
| #1 | 1 | 1 | $1,103 |
| #2 | 1 | 1 | $1,103 |
| Total (2 units) | $2,205 | ||
UW: 25.0% down · 7.5% · 30yr · 1.5% tax · 5.0% vac · 8.0% maint · 8.0% mgmt
Financing live
Cash to close
- Down payment
- $45,750
- Closing costs
- $5,490
- Reserves months
- —
- Total cash needed
- —
Loan-product check · same deal, 3 products live
Conventional
25% down · 7.5% · 30yr
- Down + closing
- —
- Monthly P&I
- —
- Monthly cashflow
- —
- DSCR
- —
- Eligible?
- —
Personal DTI + credit; lowest rate.
DSCR
20% down · 8.5% · 30yr
- Down + closing
- —
- Monthly P&I
- —
- Monthly cashflow
- —
- DSCR
- —
- Eligible?
- —
No personal income docs; deal must DSCR.
Hard money
10% down · 12.0% · 12mo
- Down + closing
- —
- Monthly P&I
- —
- Monthly cashflow
- —
- DSCR
- —
- Eligible?
- —
Short-term bridge; refi at stabilization.
Rent comps 23 comps
| Address | Beds | Baths | Sqft | Rent | $/sqft | DOM | Units | Dist |
|---|---|---|---|---|---|---|---|---|
| 418 Penn St Chester, PA | 3.0 | 1.0 | 1250 | $1,350 | $1.08 | 45d | 1 | 0.44mi |
| 925 W 3rd St Chester, PA | 4.0 | 1.0 | 1500 | $1,700 | $1.13 | 20d | 1 | 0.59mi |
| 330 W 21st St Chester, PA | 3.0 | 1.0 | 1152 | $1,500 | $1.30 | 45d | 1 | 0.67mi |
| 814 Upland St Chester, PA | 3.0 | 1.0 | 1344 | $1,525 | $1.13 | 9d | 1 | 0.73mi |
| 125 W 21st St Chester, PA | 4.0 | 1.5 | 1152 | $1,850 | $1.61 | 26d | 1 | 0.85mi |
| 1127 Walnut St Chester, PA | 4.0 | 1.5 | 1312 | $1,600 | $1.22 | 9d | 1 | 0.92mi |
| 13 E 21st St Unit A Chester, PA | 2.0 | 1.0 | 900 | $1,250 | $1.39 | 45d | 1 | 0.97mi |
| 25 W Parkway Ave Chester, PA | 3.0 | 1.0 | 1324 | $1,600 | $1.21 | 7d | 1 | 1.05mi |
| 2219 Madison St Unit B Chester, PA | 2.0 | 1.0 | 800 | $1,000 | $1.25 | 45d | 1 | 1.09mi |
| 30 W Roland Rd Brookhaven, PA | 3.0 | 1.0 | 1424 | $1,695 | $1.19 | 45d | 1 | 1.14mi |
| 2607 Edgmont Ave Unit 2F Brookhaven, PA | 2.0 | 1.0 | 850 | $1,600 | $1.88 | 26d | 1 | 1.19mi |
| 1211 Johnson St Chester, PA | 3.0 | 1.0 | 882 | $1,500 | $1.70 | 4d | 1 | 1.19mi |
| 1224 Elson Rd Brookhaven, PA | 3.0 | 2.0 | 1200 | $1,900 | $1.58 | 19d | 1 | 1.23mi |
| 1315 Harshaw Rd Brookhaven, PA | 3.0 | 2.5 | 1260 | $2,395 | $1.90 | 0d | 1 | 1.25mi |
| 314 E 24th St Chester, PA | 2.0 | 1.0–1.5 | 800 | $1,500 | $1.88 | 0d | 12 | 1.26mi |
| 1118 Brown St Unit 318 Chester, PA | 3.0 | 1.0 | 1092 | $1,900 | $1.74 | 16d | 1 | 1.26mi |
| 1124 Thomas St Chester, PA | 3.0 | 1.0 | 1046 | $1,200 | $1.15 | 26d | 1 | 1.29mi |
| 1510 Washington Ave Chester, PA | 4.0 | 1.5 | 1280 | $2,000 | $1.56 | 20d | 1 | 1.29mi |
| 2701 Madison St Chester, PA | 1.0–2.0 | 1.0 | 860 | $1,533 | $1.78 | 3d | 10 | 1.31mi |
| 2015 Hyatt St Chester, PA | 3.0 | 1.5 | 988 | $1,950 | $1.97 | 0d | 1 | 1.31mi |
| 1206 Thomas St Chester, PA | 3.0 | 1.0 | 833 | $1,399 | $1.68 | 26d | 1 | 1.34mi |
| 921 E 15th St Chester, PA | 3.0 | 1.0 | 1279 | $1,650 | $1.29 | 0d | 1 | 1.35mi |
| 1127 Ward St Chester, PA | 2.0 | 1.0 | 800 | $1,250 | $1.56 | 9d | 1 | 1.46mi |
Listing history 15 events
-
2026-06-21days on market $183,000 Active 22 DOM
-
2026-06-18days on market $183,000 Active 19 DOM
-
2026-06-17days on market $183,000 Active 18 DOM
-
2026-06-16days on market $183,000 Active 17 DOM
-
2026-06-15days on market $183,000 Active 16 DOM
-
2026-06-13days on market $183,000 Active 14 DOM
-
2026-06-13days on market $183,000 Active 13 DOM
-
2026-06-09days on market $183,000 Active 10 DOM
-
2026-06-08days on market $183,000 Active 9 DOM
-
2026-06-07days on market $183,000 Active 8 DOM
-
2026-06-04days on market $183,000 Active 5 DOM
-
2026-06-03days on market $183,000 Active 4 DOM
-
2026-06-02days on market $183,000 Active 3 DOM
-
2026-06-01days on market $183,000 Active 2 DOM
-
2026-05-31$183,000 Active 1 DOM
ⓘ Source: listings_history table (triggers on properties + properties_extension) + one-shot
backfill from property_details.listing_events for pre-trigger history.
Tax reassessment forecast PA · Partial reset (capped growth)
- Current annual tax
- $2,499 · $208/mo
- Projected year-2 tax
- $2,695 · $225/mo
- Expected delta
- +$196/yr (+$16/mo · 7.8%)
ⓘ Screening estimate from a state-policy table — verify with the county assessor before closing.
Climate risk First Street
- Flood 1/10 Low FEMA zone X (unshaded) · 0% chance over 30 yrs
- Wildfire 1/10 Low
- Heat 7/10 Severe 7 d/yr ≥105°F today · 15 d/yr by 30 yrs out
- Wind 6/10 Major 27% chance of damaging wind over 30 yrs
- Air quality 3/10 Moderate 2 unhealthy d/yr today · 4 by 30 yrs out
Nearby sold comps map
Loading sold comps map…
Walkable amenities ~0.75 mi
Loading nearby amenities…
Taxation est. · year 1
- Rental income
- $26,460
- − Mortgage interest
- −$10,251
- − Property taxes
- −$2,499
- − Insurance
- −$915
- − Repairs & maintenance
- −$2,117
- − Management
- −$2,117
- − Depreciation
- −$5,324
- Taxable income
- $3,238
- Est. tax owed @ 24.0%
- −$777
- After-tax cash flow
- $5,196/yr
For passive investors: Depreciation is non-cash, so a rental often shows a tax loss while cash-flowing — sheltering income. Rental losses are passive: they offset passive income freely, and up to $25,000/yr can offset ordinary (W-2) income if you actively participate and your MAGI is under $100k (phasing out to $0 by $150k); unused losses carry forward. On sale, claimed depreciation is recaptured at up to 25%, and gains may owe capital-gains tax (a 1031 exchange can defer both). Figures are a year-1 estimate at your 24.0% rate — not tax advice; consult a CPA.
Schools (NCES district)
- District
- Chester-Upland SD
- NCES district ID
- 4205860
- Math proficiency
- 4% ▼ -3.00%
- Reading proficiency
- 17% ▼ -6.00%
- Median HH income
- $29,790
- Composite
- 8.05/100
- National rank
- #9918
- State rank
- #533 of 539 in PA
Livability — Chester
- Score
- 73/100
- State rank
- #540
- US rank
- #5053
Category grades
Schools grade is shown separately in the Schools card above.
Census & demographics
- Census place
- Chester, PA
- County
- Delaware County · 399,863 people
- City population
- 35,064
- Metro
- Philadelphia-Camden-Wilmington, PA-NJ-DE-MD
- Population (ZIP)
- 35,064
- Household income
- $41,261
- Rent vs Own
- Severe rent burden
- 2668.0
Population outlook (Delaware County) Hauer SSP2
- Today (2025)
- 577,490 people
- By 2030
- 581,243 · +0.6%
- By 2040
- 584,700 · +1.2%
- By 2050
- 586,581 · +1.6%
- By 2075
- 598,706 · +3.7%
- By 2100
- 590,823 · +2.3%
Race, ethnicity, and origin ACS 2023
- Neighborhood character
- Predominantly Black (71%)
- Race & ethnicity
- Black 71% White 14% Hispanic / Latino 9% Two or more races 4%
- Hispanic origin (detail)
- Puerto Rican 6%
- Common ancestry
- Romanian 2%
- Foreign-born
- 4% · Canada
- Languages at home
- 92% English-only · Spanish 6%
Political lean MEDSL · Delaware
- 2024 margin
- Strong D (+23.7) · D 61.4% · R 37.6% · Other 1.0%
- 2008→2024 swing
- +2.3pp toward D · 2008: 21.4pp · 2024: 23.7pp
- All cycles
- 2024: D+23.7 2020: D+26.7 2016: D+22.0 2012: D+21.8 2008: D+21.4
Not yet ingested
- Civics
- —
Market trends
- HPI YoY
- ▼ -149.69%
- Current HPI
- 219.5173
- Rent YoY
- ▲ 6.88%
- Metro
- Philadelphia-Camden-Wilmington, PA-NJ-DE-MD
- State GDP YoY
- ▲ 1.68%
- F500 in state
- 34
Industry mix (Fortune 500 HQ in PA)
| Industry | F500 HQs | Revenue |
|---|---|---|
| Healthcare | 2 | $309B |
|
||
| Insurance | 2 | $27B |
|
||
| Telecommunications / Media | 1 | $124B |
|
||
| Industrial Distribution | 1 | $22B |
|
||
| Financial Services | 1 | $20B |
|
||
| Chemicals / Materials | 1 | $18B |
|
||
Price history
+404.8% since first listed14 events — show timeline
- 2026-05-30 Listed $183,000 BRIGHT MLS
- 2023-02-23 Sold (Public Records) $70,000 Public Records
- 2023-02-14 Sold (MLS) $70,000 BRIGHT MLS
- 2023-01-20 Pending — BRIGHT MLS
- 2023-01-18 Listing Removed — BRIGHT MLS
- 2023-01-04 Listed $30,000 BRIGHT MLS
- 2020-02-12 Pending — BRIGHT MLS
- 2020-01-28 Listing Removed — BRIGHT MLS
- 2020-01-28 Listing Removed — BRIGHT MLS
- 2020-01-10 Listed $31,500 BRIGHT MLS
- 2007-01-16 Sold (Public Records) $65,000 Public Records
- 2005-12-30 Sold (MLS) $36,250 BRIGHT MLS
- 2005-11-08 Listing Removed — BRIGHT MLS
- 2005-11-03 Listed $36,250 BRIGHT MLS
Property tax history
+21.3%/yrLatest (2026): $2,499 · +143.3% YoY. Source: county tax records.
Cash-flow waterfall
monthlySold comps — $/sqft
last 12 mo · ≤1 miLoading sold comps…