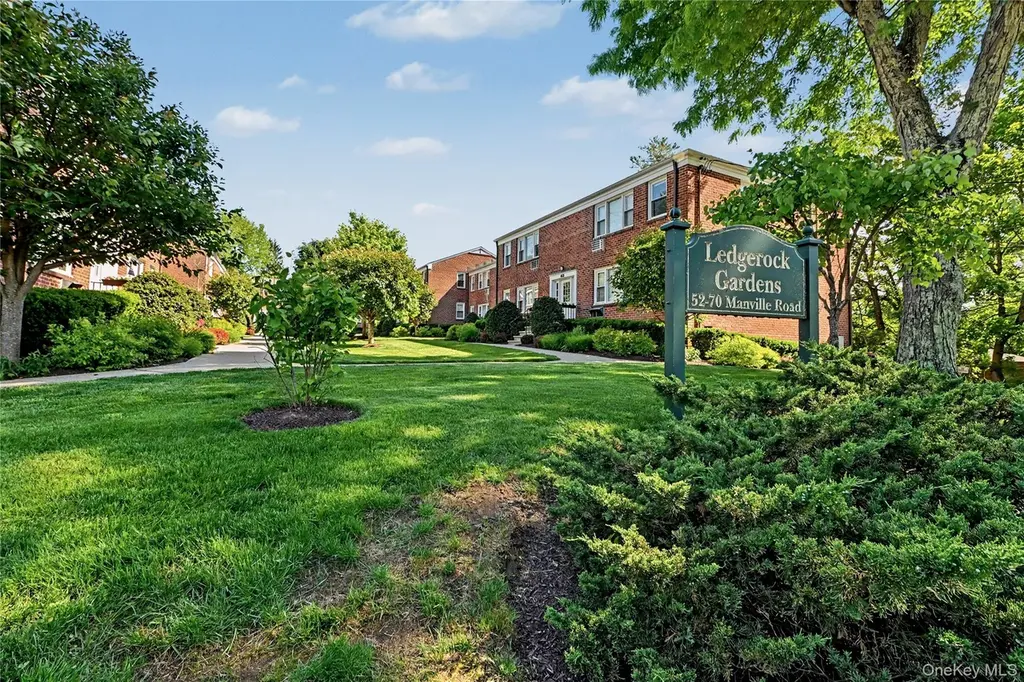
60 Manville Rd #1 · Pleasantville, NY
Flood risk No data
- FEMA flood zone
- —
- Chance of flooding over 30 yrs
- —
- Est. flood insurance / yr
- —
Fire risk No data
- Est. fire insurance / yr
- —
Heat risk No data
- Hot days now (above threshold)
- —
- Hot days in 30 yrs
- —
Wind risk No data
- Chance of severe wind over 30 yrs
- —
Air-quality risk No data
- Unhealthy air days now
- —
- Unhealthy air days in 30 yrs
- —
Risk factors via First Street. Map © Google.
Why this score? — see what drove the C grade
The composite is a weighted blend of 9 inputs, each scored 0–100. Each bar is that input's sub-score; the figure is the points it added to the 100-point composite (weight × sub-score).
- Cash flow +22.0/30.0
- ARV discount +7.5/15.0
- Schools +7.1/10.0
- DSCR +7.0/10.0
- 1% rule +5.8/10.0
- Livability +3.9/5.0
- Rent growth +2.5/5.0
- Condition / age +2.5/5.0
- Appreciation +0.0/10.0
$259,000
🖨 Deal sheet 📄 Offer letter ✓ Due diligence
Listing remarks
Enjoy the best of village living in this beautifully updated one-bedroom co-op, ideally situated in the heart of Pleasantville. Just moments from the park, local shops, and Metro-North, the location offers unmatched convenience for both daily living and commuting. The open-concept kitchen is thoughtfully updated with warm wood cabinetry, granite countertops, stainless steel appliances, and a tile floor, seamlessly flowing into a bright dining area with a window that fills the space with natural light. The spacious living room features gleaming wood floors, a walk-in closet, and a large picture window with sidelights that floods the room with sunshine. The generously sized corner bedroom off
Key facts
- Open-concept kitchen
- Walk-in closet
- Natural light
Tags
Property features AI
Finance
- HOA & community: Association: Ledgerock Gardens Inc.; Association maintains grounds; Playground on site
Exterior
- Parking: Garage (1 space); Total parking for 1 vehicle
- Utilities: Con-Edison electric service; Public sewer; Cable available; Electricity connected; Natural gas connected; Sewer connected; Trash collection (private); Water connected
- Home design: Stock cooperative; Entry on first floor; One-level unit
- Construction: Brick construction
- Exterior features: Brick construction; Not waterfront
Interior
- Kitchen: Dishwasher; Gas range; Microwave; Refrigerator
- Bedrooms: One-level layout (stories total: 3)
- Flooring: Tile; Wood
- Bathrooms: 1 full bathroom
- Heating & cooling: Oil heating; Wall/window air conditioning units
- Interior features: Granite counters; Open floorplan; Basement (common, unfinished)
- Laundry & utility: Washer/dryer info not provided
Neighborhood map
What this means for you Summary
Snapshot
- This is a 1-bed/1.0-bath condo listed at $259k.
Deal economics
- At list price, monthly cash flow is $414 ($5k/yr) — positive.
- The deal already cash-flows at list — no discount required.
- Meets the 1% rule at list price ($3k rent vs $259k).
- Recommended offer: $255k (1.5% below list) — sets the bar for market timing.
- Cap rate 8.2% vs local median 2.1% in Pleasantville — top-decile yield for the area; either an underpriced asset or a hidden risk that comps aren't pricing in. Stress-test before assuming the spread holds.
Location & tenants
- Location reads 77/100 on livability (#194 in NY, #2,992 nationally) — a middle-class / working-renter tenant base. Strengths: crime A+, employment A+, housing A+; Watch: amenities F, cost of living F.
- Pleasantville Union Free School District (suburban): math 71% / reading 83% proficiency, ranked #46 of 590 in NY (top 8%) — strong family-tenant draw, lease renewals of 3-5y typical; only 6% free/reduced lunch — higher-income household profile.
- Zoned schools: Bedford Road School (math 69% / reading 85%, grade A, #244 of 2,108 statewide, top 13%, 569 students, 11% FRL); Pleasantville Middle School (math 62% / reading 81%, grade A, #82 of 729 statewide, top 11%, 468 students, 13% FRL); Pleasantville High School (math 98% / reading 87%, grade A+, #158 of 1,100 statewide, top 15%, 593 students, 0% FRL) — zoned schools at 8% FRL track the district average.
- Market conditions: 42 active listings in the ZIP; 4 comparable units currently listed for rent nearby; rentals at typical pace (median 19d on market — plan ~3-4 weeks tenant-placement turnaround); high-income renter base; 954 units permitted in Westchester County in 2024 (649 in 5+ unit buildings).
Forward outlook
- Local home prices are declining (-3.0%/yr); year-one equity from $2k of loan paydown is wiped out by about $8k of value loss. Plan a longer hold.
- Westchester County population projected at +10% by 2050 — modest demand growth; plan on rents tracking national, not racing it.
Negotiation context
- It's been on market 16 days — a 2% lower offer ($255k) is reasonable based on typical stale-listing flexibility.
- 3 sale attempts since 14y ago with the ask held roughly flat each time — persistent listings suggest the price (not the market) is what's stuck; bring a comps-based counter.
Risks & watch-outs
- Watch-outs: built in 1958 — expect roof / HVAC / electrical / plumbing capex.
Questions for the listing agent
- Built in 1958 — when were the roof, HVAC, electrical panel, plumbing, and water heater last replaced?
- Any open or pending special assessments — roof, HVAC, plumbing, elevator, façade? What's the per-unit balance and payoff schedule, and is the seller paying it off at close or rolling it to the buyer?
- Is there a deadline driving the sale (1031 exchange, divorce, estate, relocation)? That informs how much negotiation room exists.
- Schools are A-rated — typically a magnet for longer-tenancy family renters. What's the average tenant stay here, and is there a school-zone premium baked into asking?
- What's the average days-on-market for RENTAL listings here right now (not sales)? A rising rental-DOM trend means longer vacancies and softer asking-rent achievability than the comps imply.
- What's the recent tenant-quality profile in this submarket — average credit score on applications, eviction rate, late-payment / NSF rate, and stable-employment percentage? A property-management company in the area should have these aggregated.
- How much new apartment / multifamily construction is in the pipeline within 1–3 miles? Heavy new supply (>2% of stock underway) typically softens rents 12–24 months out; light construction supports rent growth.
Investment metrics
- 1% rule
- 1.08% ✓
- Cap rate
- 8.21%
- Cash-on-cash
- 6.85%
- DSCR
- 1.30
- GRM
- 7.7
CMA / ARV
No comps found within radius.
Projected returns pro-forma
-3.0% appreciation · 3.0% rent growth · sell at horizon
- IRR
- -5.8%
- Equity multiple
- 0.79×
- Total profit
- $-15,575
- Equity at exit
- $38,618
- IRR
- 3.9%
- Equity multiple
- 1.28×
- Total profit
- $20,542
- Equity at exit
- $22,394
Cash invested: $72,520 (down + closing). Projections, not guarantees.
Landlord ↔ Tenant lean methodology
- Overall (STATE)
- 15 Strongly Tenant-Friendly
- State New York
- 15 Strongly Tenant-Friendly · D+10
- County
- — inherits STATE
- City
- — inherits STATE
ZIP-level market 10570
- Active inventory
- 42
- Price-to-rent
- 7.7×
Monthly cashflow live
- Estimated rent
- $2,789 medium interval (Pro) →
- Mortgage (P&I)
- −$1,358
- Tax est. 1.5%
- −$324 /mo · $3,885/yr
- Insurance
- −$108
- HOA
- −$0
- Vacancy / Maint / Mgmt
- −$586
- Net cashflow
- $414
Break-even live
UW: 25.0% down · 7.5% · 30yr · 1.5% tax · 5.0% vac · 8.0% maint · 8.0% mgmt
Financing live
Cash to close
- Down payment
- $64,750
- Closing costs
- $7,770
- Reserves months
- —
- Total cash needed
- —
Loan-product check · same deal, 3 products live
Conventional
25% down · 7.5% · 30yr
- Down + closing
- —
- Monthly P&I
- —
- Monthly cashflow
- —
- DSCR
- —
- Eligible?
- —
Personal DTI + credit; lowest rate.
DSCR
20% down · 8.5% · 30yr
- Down + closing
- —
- Monthly P&I
- —
- Monthly cashflow
- —
- DSCR
- —
- Eligible?
- —
No personal income docs; deal must DSCR.
Hard money
10% down · 12.0% · 12mo
- Down + closing
- —
- Monthly P&I
- —
- Monthly cashflow
- —
- DSCR
- —
- Eligible?
- —
Short-term bridge; refi at stabilization.
Rent comps 4 comps
| Address | Beds | Baths | Sqft | Rent | $/sqft | DOM | Units | Dist |
|---|---|---|---|---|---|---|---|---|
| 441 Manville Rd Unit 4 Pleasantville, NY | 2.0 | 1.0 | 650 | $3,550 | $5.46 | 1d | 1 | 0.80mi |
| 3 Maiden Ln #1 Pleasantville, NY | 1.0 | 1.0 | 500 | $2,300 | $4.60 | 17d | 1 | 0.97mi |
| 3 Maiden Ln #1 Pleasantville, NY | 1.0 | 1.0 | 500 | $2,300 | $4.60 | 19d | 1 | 0.97mi |
| 60 Kensico Rd #22 Thornwood, NY | 1.0 | 1.0 | 738 | $2,450 | $3.32 | 24d | 1 | 1.24mi |
HOA detail condo
- Monthly dues
- $0 · $0/yr
- Assessments
- None detected in remarks — confirm with the listing agent.
Listing history 10 events
-
2026-06-18days on market $259,000 Active 16 DOM
-
2026-06-17days on market $259,000 Active 15 DOM
-
2026-06-16days on market $259,000 Active 14 DOM
-
2026-06-15days on market $259,000 Active 13 DOM
-
2026-06-13days on market $259,000 Active 11 DOM
-
2026-06-09days on market $259,000 Active 7 DOM
-
2026-06-08days on market $259,000 Active 6 DOM
-
2026-06-07days on market $259,000 Active 5 DOM
-
2026-06-04remarks 699-char remark
-
2026-06-04$259,000 Active 2 DOM
ⓘ Source: listings_history table (triggers on properties + properties_extension) + one-shot
backfill from property_details.listing_events for pre-trigger history.
Nearby sold comps map
Loading sold comps map…
Walkable amenities ~0.75 mi
Loading nearby amenities…
Taxation est. · year 1
- Rental income
- $33,473
- − Mortgage interest
- −$14,508
- − Property taxes
- −$3,885
- − Insurance
- −$1,295
- − Repairs & maintenance
- −$2,678
- − Management
- −$2,678
- − Depreciation
- −$7,535
- Taxable income
- $895
- Est. tax owed @ 24.0%
- −$215
- After-tax cash flow
- $4,750/yr
For passive investors: Depreciation is non-cash, so a rental often shows a tax loss while cash-flowing — sheltering income. Rental losses are passive: they offset passive income freely, and up to $25,000/yr can offset ordinary (W-2) income if you actively participate and your MAGI is under $100k (phasing out to $0 by $150k); unused losses carry forward. On sale, claimed depreciation is recaptured at up to 25%, and gains may owe capital-gains tax (a 1031 exchange can defer both). Figures are a year-1 estimate at your 24.0% rate — not tax advice; consult a CPA.
Schools (NCES district)
- District
- Pleasantville Union Free School District
- NCES district ID
- 3623310
- Math proficiency
- 71% ▼ -6.00%
- Reading proficiency
- 83% ▲ 7.00%
- Median HH income
- $115,887
- Composite
- 71.43/100
- National rank
- #227
- State rank
- #46 of 590 in NY
Livability — Pleasantville
- Score
- 77/100
- State rank
- #194
- US rank
- #2992
Category grades
Schools grade is shown separately in the Schools card above.
Census & demographics
- Census place
- Pleasantville, NY
- County
- Westchester County · 709,332 people
- City population
- 13,289
- Metro
- New York-Newark-Jersey City, NY-NJ-PA
- Population (ZIP)
- 13,289
- Household income
- $183,833
- Rent vs Own
- Severe rent burden
- 281.0
Population outlook (Westchester County) Hauer SSP2
- Today (2025)
- 1,028,035 people
- By 2030
- 1,051,636 · +2.3%
- By 2040
- 1,098,520 · +6.9%
- By 2050
- 1,136,044 · +10.5%
- By 2075
- 1,196,925 · +16.4%
- By 2100
- 1,175,147 · +14.3%
Race, ethnicity, and origin ACS 2023
- Neighborhood character
- Predominantly White (77%)
- Race & ethnicity
- White 77% Hispanic / Latino 13% Two or more races 6% Black 4% Asian 3%
- Hispanic origin (detail)
- Puerto Rican 1%
- Common ancestry
- Romanian 4% Scotch-Irish 4% Italian 4%
- Foreign-born
- 13% · Canada, China, Jamaica
- Languages at home
- 85% English-only · Spanish 8% Other Indo-European 2% Chinese 1%
Political lean MEDSL · Westchester
- 2024 margin
- Strong D (+26.3) · D 63.1% · R 36.9%
- 2008→2024 swing
- -1.3pp toward R · 2008: 27.6pp · 2024: 26.3pp
- All cycles
- 2024: D+26.3 2020: D+36.3 2016: D+32.8 2012: D+22.2 2008: D+27.6
Not yet ingested
- Civics
- —
Market trends
- HPI YoY
- ▼ -695.32%
- Current HPI
- 277.2529
- Rent YoY
- —
- Metro
- New York-Newark-Jersey City, NY-NJ-PA
- State GDP YoY
- ▲ 2.60%
- F500 in state
- 92
Industry mix (Fortune 500 HQ in NY)
| Industry | F500 HQs | Revenue |
|---|---|---|
| Financial Services | 10 | $950B |
|
||
| Consumer Goods | 9 | $162B |
|
||
| Insurance | 4 | $225B |
|
||
| Telecommunications | 2 | $144B |
|
||
| Pharmaceuticals | 2 | $112B |
|
||
| Media / Entertainment | 2 | $69B |
|
||
Price history
+32.8% since first listed5 events — show timeline
- 2026-06-02 Listed $259,000 OneKey® MLS as Distributed by MLS Grid
- 2012-12-17 Delisted — HGMLS
- 2012-12-16 Listing Removed — OneKey® MLS as Distributed by MLS Grid
- 2012-06-16 Listed — HGMLS
- 2012-06-16 Listed $195,000 OneKey® MLS as Distributed by MLS Grid
Cash-flow waterfall
monthlySold comps — $/sqft
last 12 mo · ≤1 miLoading sold comps…