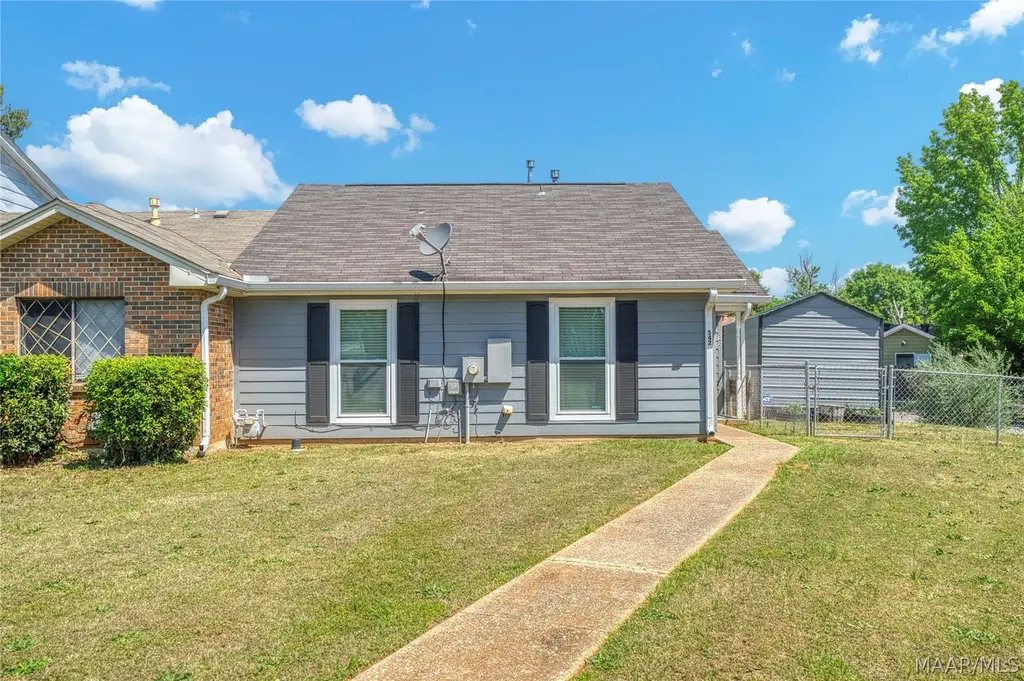
542 Saddlewood Ln · Montgomery, AL
Flood risk 1/10 · Minimal
- FEMA flood zone
- X (unshaded)
- Chance of flooding over 30 yrs
- 0.0%
- Est. flood insurance / yr
- $507 – $1,088
Fire risk 4/10 · Minor
- Est. fire insurance / yr
- $916 – $1,700
Heat risk 8/10 · Major
- Hot days now (above 107°F)
- 7 days/yr
- Hot days in 30 yrs
- 20 days/yr
Wind risk 8/10 · Major
- Chance of severe wind over 30 yrs
- 80.0%
Air-quality risk 4/10 · Minor
- Unhealthy air days now
- 4 days/yr
- Unhealthy air days in 30 yrs
- 5 days/yr
Risk factors via First Street. Map © Google.
Why this score? — see what drove the B- grade
The composite is a weighted blend of 9 inputs, each scored 0–100. Each bar is that input's sub-score; the figure is the points it added to the 100-point composite (weight × sub-score).
- Cash flow +28.3/30.0
- ARV discount +12.2/15.0
- DSCR +10.0/10.0
- 1% rule +6.7/10.0
- Rent growth +3.2/5.0
- Livability +3.2/5.0
- Condition / age +2.5/5.0
- Schools +1.7/10.0
- Appreciation +0.0/10.0
$94,000
🖨 Deal sheet (PDF) 📄 Offer letter ✓ Due diligence
Listing remarks MLS
THIS UPDATED HOME IS READY TO MOVE IN AND ON A QUIET LOOP IS A MUST SEE - OPEN FLOOR PLAN - GREAT CENTRAL LOCATION IN MONTGOMERY - PLENTY OF ROOM AND NOTHING NEEDS TO BE DONE
Key facts
- Covered porch
- Updates completed
- Corner lot
Tags
Property features AI
Exterior
- Parking: Parking pad for 2 vehicles
- Security: Security system; Fire alarm
- Utilities: Cable available; Electricity available; Natural gas available; Public water; Public sewer
- Home design: Single-story; Corner lot; City lot; Located in a subdivision
- Construction: Vinyl siding; Vented roof; Slab foundation; Built (year per public records)
- Exterior features: Patio; Outdoor storage
Interior
- Kitchen: Electric range; Microwave
- Bedrooms: Bedroom on the first level
- Flooring: Carpet; Laminate; Tile
- Bathrooms: 1 full bathroom
- Heating & cooling: Central heating (gas); Central air; Ceiling fan(s); Electric cooling
- Interior features: Blinds and window treatments; Double-pane windows; Walk-in closet(s); Satellite dish
- Laundry & utility: Washer hookup; Dryer hookup; Gas water heater
Neighborhood map
What this means for you Summary
Snapshot
- This is a 2-bed/2.0-bath townhouse listed at $94k.
Deal economics
- At list price, monthly cash flow is $303 ($4k/yr) — positive.
- The deal already cash-flows at list — no discount required.
- Meets the 1% rule at list price ($1k rent vs $94k).
- Recommended offer: $91k (3.0% below list) — sets the bar for market timing.
- Cap rate 10.2% vs local median 6.0% in Montgomery — top-decile yield for the area; either an underpriced asset or a hidden risk that comps aren't pricing in. Stress-test before assuming the spread holds.
Location & tenants
- Location reads 65/100 on livability (#138 in AL) — a middle-class / working-renter tenant base. Strengths: cost of living A+, housing A+; Watch: employment D, crime F, amenities D-.
- Montgomery County (urban): math 9% / reading 31% proficiency, ranked #106 of 129 in AL (top 82%) — low school quality limits family demand, transient renter base, plan for 1-2y turnover; 70% free/reduced lunch — lower-income household profile, screen leases tightly.
- Zoned schools: Dalraida Elementary School (math 5% / reading 34%, grade F, #467 of 627 statewide, top 76%, 627 students, 63% FRL); Goodwyn Middle School (math 0% / reading 16%, grade F, #239 of 257 statewide, top 93%, 808 students, 84% FRL); Lee High School (math 2% / reading 8%, grade F, #276 of 305 statewide, top 95%, 1,374 students, 86% FRL).
- Market conditions: Rents rising (+2.6%/yr); 209 active listings in the ZIP; 11 comparable units currently listed for rent nearby; rentals at typical pace (median 23d on market — plan ~3-4 weeks tenant-placement turnaround); 45% of comp listings sitting > 30 days — soft ceiling on asking rent; 460 units permitted in Montgomery County in 2024 (37 in 5+ unit buildings).
Forward outlook
- Local home prices are declining (-3.0%/yr); year-one equity from $650 of loan paydown is wiped out by about $3k of value loss. Plan a longer hold.
- Montgomery County population projected to shrink 8% by 2050 — rents likely to lag national; underwrite the cash flow, not the appreciation.
- At projected returns (-3.0% appreciation + 2.6% rent growth), your $26k cash investment doubles in ~9 years — after that, you're playing with house money.
Negotiation context
- It's been on market 34 days — a 3% lower offer ($91k) is reasonable based on typical stale-listing flexibility.
- 5 sale attempts since 21y ago with the ask held roughly flat each time — persistent listings suggest the price (not the market) is what's stuck; bring a comps-based counter.
Risks & watch-outs
- Climate carrying-cost: severe wind risk, 80% chance of damaging wind over 30y; extreme-heat days projected 7→20/yr by 2055 (HVAC capex compounding) — expect insurance premiums to compound above CPI over the hold.
Questions for the listing agent
- It's been on market 34 days. Have you received any prior offers? Is the seller open to a 3% concession, seller financing, or rate buy-down credit?
- Is there a deadline driving the sale (1031 exchange, divorce, estate, relocation)? That informs how much negotiation room exists.
- Crime grade is F in this area — have there been break-ins, vandalism, or insurance claims at this property in the last 3 years? What carrier currently insures it and at what premium?
- What's the average days-on-market for RENTAL listings here right now (not sales)? A rising rental-DOM trend means longer vacancies and softer asking-rent achievability than the comps imply.
- What's the recent tenant-quality profile in this submarket — average credit score on applications, eviction rate, late-payment / NSF rate, and stable-employment percentage? A property-management company in the area should have these aggregated.
- How much new for-sale + rental construction is in the pipeline within 1–3 miles? Heavy new supply typically softens prices + rents 12–24 months out; constrained supply supports both.
Investment metrics
- 1% rule
- 1.17% ✓
- Cap rate
- 10.16%
- Cash-on-cash
- 13.80%
- DSCR
- 1.61
- GRM
- 7.1
CMA / ARV
- ARV (median comp)
- $105,000
- List price
- $94,000
- Delta
- -10.48%
- Verdict
- UNDERPRICED
- Comps
- 7 within 1.0 mi
Show comp detail 1 sale within ~0.75 mi
| Address | Dist | Beds/Ba | Sqft | Sold | Price | $/sf | Match |
|---|---|---|---|---|---|---|---|
| 4720 Retreat Rd | 0.06mi | 2/2.0 | 1,001 (+14%) | 1mo | $105,000 | $105 | 74 |
Match score weights: distance 35% · size 25% · config 20% · recency 20%. Top-matched comps best support the ARV.
Projected returns pro-forma
-3.0% appreciation · 2.65% rent growth · sell at horizon
- IRR
- 3.6%
- Equity multiple
- 1.14×
- Total profit
- $3,623
- Equity at exit
- $14,016
- IRR
- 12.8%
- Equity multiple
- 2.00×
- Total profit
- $26,262
- Equity at exit
- $8,127
Cash invested: $26,320 (down + closing). Projections, not guarantees.
Landlord ↔ Tenant lean methodology
- Overall (STATE)
- 90 Strongly Landlord-Friendly
- State Alabama
- 90 Strongly Landlord-Friendly · R+15
- County
- — inherits STATE
- City
- — inherits STATE
ZIP-level market 36109
- Home prices YoY
- -20.1%
- Rents YoY
- 2.6%
- Active inventory
- 209
- Price-to-rent
- 7.1×
Monthly cashflow live
- Estimated rent
- $1,100 high interval (Pro) →
- Mortgage (P&I)
- −$493
- Tax from tax record
- −$35 /mo · $415/yr
- Insurance
- −$39
- HOA
- −$0
- Vacancy / Maint / Mgmt
- −$231
- Net cashflow
- $303
Break-even live
Sensitivity live
| Price | -10% $356 | -5% $329 | +0% $303 | +5% $276 | +10% $249 |
|---|---|---|---|---|---|
| Rent | -10% $216 | -5% $259 | +0% $303 | +5% $346 | +10% $390 |
| Rate | -1.0pp $350 | -0.5pp $327 | base $303 | +0.5pp $278 | +1.0pp $254 |
UW: 25.0% down · 7.5% · 30yr · 1.5% tax · 5.0% vac · 8.0% maint · 8.0% mgmt
Financing live
Cash to close
- Down payment
- $23,500
- Closing costs
- $2,820
- Reserves months
- —
- Total cash needed
- —
Loan-product check · same deal, 3 products live
Conventional
25% down · 7.5% · 30yr
- Down + closing
- —
- Monthly P&I
- —
- Monthly cashflow
- —
- DSCR
- —
- Eligible?
- —
Personal DTI + credit; lowest rate.
DSCR
20% down · 8.5% · 30yr
- Down + closing
- —
- Monthly P&I
- —
- Monthly cashflow
- —
- DSCR
- —
- Eligible?
- —
No personal income docs; deal must DSCR.
Hard money
10% down · 12.0% · 12mo
- Down + closing
- —
- Monthly P&I
- —
- Monthly cashflow
- —
- DSCR
- —
- Eligible?
- —
Short-term bridge; refi at stabilization.
Rent comps 11 comps
| Address | Beds | Baths | Sqft | Rent | $/sqft | DOM | Units | Dist |
|---|---|---|---|---|---|---|---|---|
| 4732 Retreat Rd Montgomery, AL | 2.0 | 2.0 | 1034 | $995 | $0.96 | 23d | 1 | 0.08mi |
| 538 Hollow Wood Rd Montgomery, AL | 2.0 | 2.0 | 1053 | $1,100 | $1.04 | 45d | 1 | 0.09mi |
| 516 Lawndale Ln Montgomery, AL | 3.0 | 1.0 | 1125 | $1,150 | $1.02 | 45d | 1 | 0.56mi |
| 185 Eastdale Rd S Montgomery, AL | 1.0–2.0 | 1.0–2.0 | 846 | $1,100 | $1.30 | 23d | 4 | 1.07mi |
| 203 Eastdale Rd S Montgomery, AL | 1.0–3.0 | 1.0–2.0 | 931 | $1,082 | $1.16 | 15d | 13 | 1.13mi |
| 760 N Burbank Dr Montgomery, AL | 3.0 | 2.0 | 1102 | $1,400 | $1.27 | 45d | 1 | 1.23mi |
| 5918 Carmel Dr Montgomery, AL | 2.0 | 2.0 | 1026 | $1,100 | $1.07 | 45d | 1 | 1.27mi |
| 455 Eastdale Rd S Montgomery, AL | 1.0–2.0 | 1.0 | 950 | $850 | $0.89 | 15d | 6 | 1.39mi |
| 101 S Burbank Dr Montgomery, AL | 1.0–2.0 | 1.0–1.5 | 850 | $997 | $1.17 | 15d | 5 | 1.42mi |
| 500 Eastdale Rd S Montgomery, AL | 1.0–3.0 | 1.0–2.5 | 1042 | $772 | $0.74 | 23d | 20 | 1.43mi |
| 547 Eastdale Rd S Unit 547 Montgomery, AL | 2.0 | 2.0 | 900 | $900 | $1.00 | 45d | 1 | 1.49mi |
Listing history 10 events
-
2026-04-23$94,000 Active 623-char remark
-
2022-09-22$82,500
-
2018-11-07soldstatus $56,500
-
2018-11-01soldstatus $56,000
Show marketing remark (176 chars)
THIS UPDATED HOME IS READY TO MOVE IN AND ON A QUIET LOOP IS A MUST SEE - OPEN FLOOR PLAN - GREAT CENTRAL LOCATION IN MONTGOMERY - PLENTY OF ROOM AND NOTHING NEEDS TO BE DONE
-
2018-07-29$64,900
Show marketing remark (176 chars)
THIS UPDATED HOME IS READY TO MOVE IN AND ON A QUIET LOOP IS A MUST SEE - OPEN FLOOR PLAN - GREAT CENTRAL LOCATION IN MONTGOMERY - PLENTY OF ROOM AND NOTHING NEEDS TO BE DONE
-
2013-01-28soldstatus $52,900
-
2008-10-06$73,900
-
2006-01-09soldstatus $60,000
-
2006-01-05soldstatus $60,000
-
2005-11-05$62,500
ⓘ Source: listings_history table (triggers on properties + properties_extension) + one-shot
backfill from property_details.listing_events for pre-trigger history.
Tax reassessment forecast AL · Resets to sale price
- Current annual tax
- $415 · $35/mo
- Projected year-2 tax
- $415 · $35/mo
- Expected delta
- $0/yr ($0/mo · -0.0%)
ⓘ Screening estimate from a state-policy table — verify with the county assessor before closing.
Climate risk First Street
- Flood 1/10 Low FEMA zone X (unshaded) · 0% chance over 30 yrs
- Wildfire 4/10 Moderate
- Heat 8/10 Severe 7 d/yr ≥107°F today · 20 d/yr by 30 yrs out
- Wind 8/10 Severe 80% chance of damaging wind over 30 yrs
- Air quality 4/10 Moderate 4 unhealthy d/yr today · 5 by 30 yrs out
Nearby sold comps map
Loading sold comps map…
Walkable amenities ~0.75 mi
Loading nearby amenities…
Taxation est. · year 1
- Rental income
- $13,205
- − Mortgage interest
- −$5,265
- − Property taxes
- −$415
- − Insurance
- −$470
- − Repairs & maintenance
- −$1,056
- − Management
- −$1,056
- − Depreciation
- −$2,735
- Taxable income
- $2,207
- Est. tax owed @ 24.0%
- −$530
- After-tax cash flow
- $3,102/yr
For passive investors: Depreciation is non-cash, so a rental often shows a tax loss while cash-flowing — sheltering income. Rental losses are passive: they offset passive income freely, and up to $25,000/yr can offset ordinary (W-2) income if you actively participate and your MAGI is under $100k (phasing out to $0 by $150k); unused losses carry forward. On sale, claimed depreciation is recaptured at up to 25%, and gains may owe capital-gains tax (a 1031 exchange can defer both). Figures are a year-1 estimate at your 24.0% rate — not tax advice; consult a CPA.
Schools (NCES district)
- District
- Montgomery County
- NCES district ID
- 0102430
- Math proficiency
- 9% ▼ -21.00%
- Reading proficiency
- 31% ▼ -1.00%
- Median HH income
- $43,902
- Composite
- 17.24/100
- National rank
- #9093
- State rank
- #106 of 129 in AL
Livability — Montgomery
- Score
- 65/100
- State rank
- #138
- US rank
- #13416
Category grades
Schools grade is shown separately in the Schools card above.
Census & demographics
- Census place
- Montgomery, AL
- County
- Montgomery County · 190,016 people
- City population
- 175,913
- Metro
- Montgomery, AL
- Population (ZIP)
- 23,581
- Household income
- $59,193
- Rent vs Own
- Severe rent burden
- 1039.0
Population outlook (Montgomery County) Hauer SSP2
- Today (2025)
- 224,008 people
- By 2030
- 221,460 · -1.1%
- By 2040
- 214,179 · -4.4%
- By 2050
- 204,912 · -8.5%
- By 2075
- 177,821 · -20.6%
- By 2100
- 145,134 · -35.2%
Race, ethnicity, and origin ACS 2023
- Neighborhood character
- Diverse neighborhood (Simpson 0.60)
- Race & ethnicity
- White 49% Black 39% Hispanic / Latino 8% Two or more races 4%
- Hispanic origin (detail)
- Mexican 4%
- Common ancestry
- Slovak 2% Lithuanian 1% Serbian 1%
- Foreign-born
- 4% · Canada, South Korea
- Languages at home
- 94% English-only · Spanish 5%
Political lean MEDSL · Montgomery
- 2024 margin
- Solid D (+30.7) · D 64.8% · R 34.1% · Other 1.1%
- 2008→2024 swing
- +11.5pp toward D · 2008: 19.2pp · 2024: 30.7pp
- All cycles
- 2024: D+30.7 2020: D+31.5 2016: D+26.2 2012: D+24.3 2008: D+19.2
Not yet ingested
- Civics
- —
Market trends
- HPI YoY
- ▼ -37.64%
- Current HPI
- 149.3867
- Rent YoY
- ▲ 2.65%
- Metro
- Montgomery, AL
- State GDP YoY
- ▲ 2.94%
- F500 in state
- 4
Industry mix (Fortune 500 HQ in AL)
| Industry | F500 HQs | Revenue |
|---|---|---|
| Financial Services | 1 | $8B |
|
||
| Healthcare | 1 | $5B |
|
||
Price history
+44.0% since first listed13 events — show timeline
- 2026-06-01 Sold (MLS) $90,000 MAAR
- 2026-05-27 Pending — MAAR
- 2026-05-21 Contingent — MAAR
- 2026-04-23 Listed $94,000 MAAR
- 2022-09-22 Listed $82,500 MAAR
- 2018-11-07 Sold (Public Records) $56,500 Public Records
- 2018-11-01 Sold (MLS) $56,000 MAAR
- 2018-07-29 Listed $64,900 MAAR
- 2013-01-28 Sold (Public Records) $52,900 Public Records
- 2008-10-06 Listed $73,900 MAAR
- 2006-01-09 Sold (Public Records) $60,000 Public Records
- 2006-01-05 Sold (MLS) $60,000 MAAR
- 2005-11-05 Listed $62,500 MAAR
Property tax history
+0.0%/yrLatest (2019): $415 · +1.1% YoY. Source: county tax records.
Cash-flow waterfall
monthlySold comps — $/sqft
last 12 mo · ≤1 miLoading sold comps…