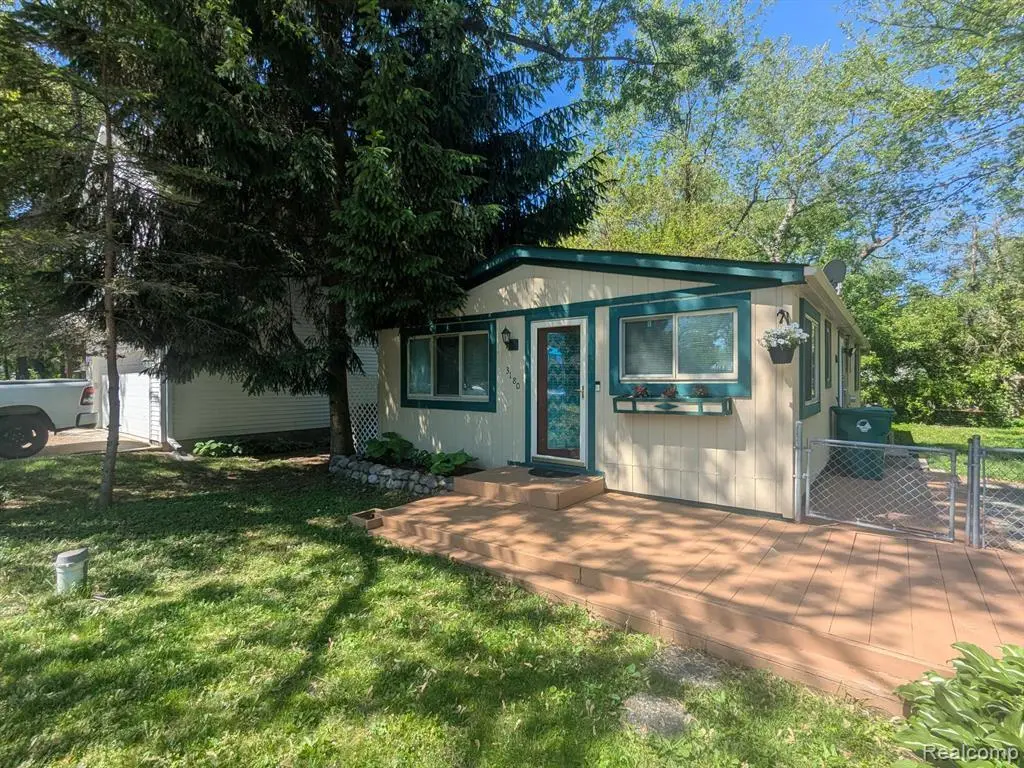
3180 Mapledale St · Wolverine Lake, MI
Flood risk 1/10 · Minimal
- FEMA flood zone
- X (unshaded)
- Chance of flooding over 30 yrs
- 0.0%
- Est. flood insurance / yr
- $473 – $860
Fire risk 1/10 · Minimal
- Est. fire insurance / yr
- $784 – $1,456
Heat risk 2/10 · Minimal
- Hot days now (above 96°F)
- 7 days/yr
- Hot days in 30 yrs
- 14 days/yr
Wind risk 2/10 · Minimal
- Chance of severe wind over 30 yrs
- —
Air-quality risk 3/10 · Minor
- Unhealthy air days now
- 2 days/yr
- Unhealthy air days in 30 yrs
- 4 days/yr
Risk factors via First Street. Map © Google.
Why this score? — see what drove the D+ grade
The composite is a weighted blend of 9 inputs, each scored 0–100. Each bar is that input's sub-score; the figure is the points it added to the 100-point composite (weight × sub-score).
- ARV discount +15.0/15.0
- Cash flow +12.8/30.0
- Schools +5.0/10.0
- DSCR +3.8/10.0
- Livability +3.7/5.0
- 1% rule +3.4/10.0
- Rent growth +2.5/5.0
- Condition / age +2.5/5.0
- Appreciation +0.0/10.0
$195,000
🖨 Deal sheet 📄 Offer letter ✓ Due diligence
Listing remarks MLS
Available to show Tuesday 5/26/26 Brand New Central Air, Walk this beautiful area with 3 lake access site near. Short walk to LK PRIVILEGES ON LOWER STRAITS LK, Award Winning Walled Lake Schools. 3bd 1 Bath Kitchen and Bath recently remodeled. Mature corner lot with Privacy. Shows like new you must get inside. Don't Miss out Call
Key facts
- Lake access
- Central air
- 4,792 sq ft lot
Tags
Property features AI
Exterior
- Parking: No garage
- Utilities: Private well water; Shared septic system
- Home design: Single-family residence; One level; Ground-level entry with steps
- Construction: Wood siding; Built with crawl space foundation
- Exterior features: Lake privileges; Paved road access; Lot dimensions approximately 50 x 100 (0.11 acres); Water body: Lower straits
Interior
- Kitchen: Free-standing gas oven; Free-standing refrigerator; Disposal
- Bathrooms: 1 full bathroom
- Heating & cooling: Forced air heating (natural gas); Central air; Ceiling fan(s)
- Interior features: Disposal; Crawl space basement
- Laundry & utility: Washer; Dryer
Neighborhood map
What this means for you Summary
Snapshot
- This is a 3-bed/1.0-bath single-family listed at $195k.
Deal economics
- At list price, monthly cash flow is $-18 ($-212/yr) — negative.
- To cash-flow at today's rent, offer at most $192k (1.6% below list).
- To meet the 1% rule (rent ≥ 1% of price), the offer needs to be $163k (16.4% below list).
- Recommended offer: $163k (16.4% below list) — sets the bar for 1% rule.
- Cap rate 6.2% vs local median 3.7% in Wolverine Lake — top-decile yield for the area; either an underpriced asset or a hidden risk that comps aren't pricing in. Stress-test before assuming the spread holds.
Location & tenants
- Location reads 73/100 on livability (#204 in MI) — a middle-class / working-renter tenant base. Strengths: crime A+, employment A+, cost of living A+; Watch: schools D, amenities F, commute F.
- Walled Lake Consolidated Schools (suburban): math 52% / reading 60% proficiency, ranked #58 of 540 in MI (top 11%) — acceptable for families but not a draw, mixed tenant base, ~2y average lease; only 20% free/reduced lunch — higher-income household profile.
- Market conditions: 173 active listings in the ZIP; 3 comparable units currently listed for rent nearby; rentals at typical pace (median 25d on market — plan ~3-4 weeks tenant-placement turnaround); 2,614 units permitted in Oakland County in 2024 (721 in 5+ unit buildings).
Forward outlook
- Local home prices are declining (-3.0%/yr); year-one equity from $1k of loan paydown is wiped out by about $6k of value loss. Plan a longer hold.
- Oakland County population projected at +10% by 2050 — modest demand growth; plan on rents tracking national, not racing it.
Negotiation context
- Only 13 days on market — expect competitive offers; lowballing is unlikely to land.
- 4 sale attempts since 29y ago with the ask held roughly flat each time — persistent listings suggest the price (not the market) is what's stuck; bring a comps-based counter.
- Current owner paid $126k; list at $195k implies a 55% gain — meaningful room to come down on a strong offer.
Questions for the listing agent
- What do current leases actually rent for vs. the listed asking? Can we see a recent rent roll and the last 12 months of T-12 income?
- Built in 1970 — when were the roof, HVAC, electrical panel, plumbing, and water heater last replaced?
- Is there a deadline driving the sale (1031 exchange, divorce, estate, relocation)? That informs how much negotiation room exists.
- Schools are D-rated, which usually means shorter tenancies and higher turnover. Who's the typical renter profile here, and what's been the actual vacancy rate?
- The area grade is low — what's the realistic commute time and amenity access for the typical tenant pool here? Any planned neighborhood developments (good or bad) we should know about?
- What's the average days-on-market for RENTAL listings here right now (not sales)? A rising rental-DOM trend means longer vacancies and softer asking-rent achievability than the comps imply.
- What's the recent tenant-quality profile in this submarket — average credit score on applications, eviction rate, late-payment / NSF rate, and stable-employment percentage? A property-management company in the area should have these aggregated.
- How much new for-sale + rental construction is in the pipeline within 1–3 miles? Heavy new supply typically softens prices + rents 12–24 months out; constrained supply supports both.
Investment metrics
- 1% rule
- 0.84% ✗
- Cap rate
- 6.18%
- Cash-on-cash
- -0.39%
- DSCR
- 0.98
- GRM
- 10.0
CMA / ARV
- ARV (on-the-fly)
- $245,760
- Comps found
- 7
Show comp detail 7 sales within ~0.75 mi
| Address | Dist | Beds/Ba | Sqft | Sold | Price | $/sf | Match |
|---|---|---|---|---|---|---|---|
| 9325 Commerce Rd | 0.22mi | 3/1.0 | 972 (+1%) | 6mo | $230,000 | $237 | 83 |
| 3346 Royal Blvd | 0.17mi | 3/1.5 | 1,017 (+6%) | 1mo | $260,000 | $256 | 79 |
| 3235 Royal Blvd | 0.07mi | 3/1.0 | 912 (-5%) | 19mo | $179,900 | $197 | 73 |
| 3114 mapledale St | 0.07mi | 2/1.0 (-1) | 912 (-5%) | 16mo | $238,000 | $261 | 70 |
| 3114 Mapledale St | 0.07mi | 2/1.0 (-1) | 912 (-5%) | 16mo | $238,000 | $261 | 70 |
| 9526 Garden Terrace Ter | 0.38mi | 3/1.0 | 988 (+3%) | 10mo | $289,000 | $293 | 69 |
| 3243 Chenoa St | 0.39mi | 3/2.0 | 1,008 (+5%) | 23mo | $240,000 | $238 | 50 |
Match score weights: distance 35% · size 25% · config 20% · recency 20%. Top-matched comps best support the ARV.
Projected returns pro-forma
-3.0% appreciation · 3.0% rent growth · sell at horizon
- IRR
- -16.9%
- Equity multiple
- 0.40×
- Total profit
- $-32,725
- Equity at exit
- $29,075
- IRR
- -8.8%
- Equity multiple
- 0.45×
- Total profit
- $-29,951
- Equity at exit
- $16,860
Cash invested: $54,600 (down + closing). Projections, not guarantees.
Landlord ↔ Tenant lean methodology
- Overall (STATE)
- 62 Landlord-Friendly
- State Michigan
- 62 Landlord-Friendly · EVEN
- County
- — inherits STATE
- City
- — inherits STATE
ZIP-level market 48382
- Active inventory
- 173
- Price-to-rent
- 10.0×
Monthly cashflow live
- Estimated rent
- $1,629 medium interval (Pro) →
- Mortgage (P&I)
- −$1,023
- Tax from tax record
- −$201 /mo · $2,413/yr
- Insurance
- −$81
- HOA
- −$0
- Vacancy / Maint / Mgmt
- −$342
- Net cashflow
- $-18
Break-even live
UW: 25.0% down · 7.5% · 30yr · 1.5% tax · 5.0% vac · 8.0% maint · 8.0% mgmt
Financing live
Cash to close
- Down payment
- $48,750
- Closing costs
- $5,850
- Reserves months
- —
- Total cash needed
- —
Loan-product check · same deal, 3 products live
Conventional
25% down · 7.5% · 30yr
- Down + closing
- —
- Monthly P&I
- —
- Monthly cashflow
- —
- DSCR
- —
- Eligible?
- —
Personal DTI + credit; lowest rate.
DSCR
20% down · 8.5% · 30yr
- Down + closing
- —
- Monthly P&I
- —
- Monthly cashflow
- —
- DSCR
- —
- Eligible?
- —
No personal income docs; deal must DSCR.
Hard money
10% down · 12.0% · 12mo
- Down + closing
- —
- Monthly P&I
- —
- Monthly cashflow
- —
- DSCR
- —
- Eligible?
- —
Short-term bridge; refi at stabilization.
Rent comps 3 comps
| Address | Beds | Baths | Sqft | Rent | $/sqft | DOM | Units | Dist |
|---|---|---|---|---|---|---|---|---|
| 3280 Brookneal St Commerce Township, MI | 2.0 | 1.0 | 730 | $1,650 | $2.26 | 44d | 1 | 0.19mi |
| 3280 Brookneal St Unit NA Commerce Township, MI | 2.0 | 1.0 | 730 | $1,650 | $2.26 | 24d | 1 | 0.19mi |
| 617 W Commerce Rd Commerce Township, MI | 2.0 | 1.0 | 580 | $1,300 | $2.24 | 24d | 1 | 1.20mi |
Listing history 16 events
-
2026-06-04statusdays on market $195,000 Pending 13 DOM
-
2026-06-03$195,000 Active 12 DOM
-
2026-06-02days on market $195,000 Active 12 DOM
-
2026-06-01days on market $195,000 Active 11 DOM
-
2026-05-31days on market $195,000 Active 10 DOM
-
2026-05-21$195,000 Active
Show marketing remark (331 chars)
Available to show Tuesday 5/26/26 Brand New Central Air, Walk this beautiful area with 3 lake access site near. Short walk to LK PRIVILEGES ON LOWER STRAITS LK, Award Winning Walled Lake Schools. 3bd 1 Bath Kitchen and Bath recently remodeled. Mature corner lot with Privacy. Shows like new you must get inside. Don't Miss out Call
-
2026-05-21$195,000 Active 331-char remark
Show marketing remark (331 chars)
Available to show Tuesday 5/26/26 Brand New Central Air, Walk this beautiful area with 3 lake access site near. Short walk to LK PRIVILEGES ON LOWER STRAITS LK, Award Winning Walled Lake Schools. 3bd 1 Bath Kitchen and Bath recently remodeled. Mature corner lot with Privacy. Shows like new you must get inside. Don't Miss out Call
-
2004-01-20soldstatus $126,000
-
2003-12-04soldstatus $126,000
-
2003-09-09$134,900
-
1997-04-28soldstatus $95,500
-
1997-04-01soldstatus $95,500
-
1997-01-29$94,900
-
1994-08-25soldstatus $78,500
-
1992-08-03soldstatus $57,000
-
1985-09-06soldstatus $20,000
ⓘ Source: listings_history table (triggers on properties + properties_extension) + one-shot
backfill from property_details.listing_events for pre-trigger history.
Tax reassessment forecast MI · Partial reset (capped growth)
- Current annual tax
- $2,413 · $201/mo
- Projected year-2 tax
- $2,708 · $226/mo
- Expected delta
- +$295/yr (+$25/mo · 12.2%)
ⓘ Screening estimate from a state-policy table — verify with the county assessor before closing.
Climate risk First Street
- Flood 1/10 Low FEMA zone X (unshaded) · 0% chance over 30 yrs
- Wildfire 1/10 Low
- Heat 2/10 Low 7 d/yr ≥96°F today · 14 d/yr by 30 yrs out
- Wind 2/10 Low
- Air quality 3/10 Moderate 2 unhealthy d/yr today · 4 by 30 yrs out
Nearby sold comps map
Loading sold comps map…
Walkable amenities ~0.75 mi
Loading nearby amenities…
Taxation est. · year 1
- Rental income
- $19,554
- − Mortgage interest
- −$10,923
- − Property taxes
- −$2,413
- − Insurance
- −$975
- − Repairs & maintenance
- −$1,564
- − Management
- −$1,564
- − Depreciation
- −$5,673
- Taxable loss
- −$3,559
- Est. tax savings @ 24.0%
- +$854
- After-tax cash flow
- $642/yr
For passive investors: Depreciation is non-cash, so a rental often shows a tax loss while cash-flowing — sheltering income. Rental losses are passive: they offset passive income freely, and up to $25,000/yr can offset ordinary (W-2) income if you actively participate and your MAGI is under $100k (phasing out to $0 by $150k); unused losses carry forward. On sale, claimed depreciation is recaptured at up to 25%, and gains may owe capital-gains tax (a 1031 exchange can defer both). Figures are a year-1 estimate at your 24.0% rate — not tax advice; consult a CPA.
Schools (NCES district)
- District
- Walled Lake Consolidated Schools
- NCES district ID
- 2635160
- Math proficiency
- 52% ▼ -4.00%
- Reading proficiency
- 60% ▼ -1.00%
- Median HH income
- $69,184
- Composite
- 49.57/100
- National rank
- #1987
- State rank
- #58 of 540 in MI
Livability — Wolverine Lake
- Score
- 73/100
- State rank
- #204
- US rank
- #5186
Category grades
Schools grade is shown separately in the Schools card above.
Census & demographics
- Population (ZIP)
- 23,550
Population outlook (Oakland County) Hauer SSP2
- Today (2025)
- 1,335,747 people
- By 2030
- 1,375,100 · +2.9%
- By 2040
- 1,435,385 · +7.5%
- By 2050
- 1,469,250 · +10.0%
- By 2075
- 1,531,946 · +14.7%
- By 2100
- 1,450,485 · +8.6%
Race, ethnicity, and origin ACS 2023
- Neighborhood character
- Predominantly White (86%)
- Race & ethnicity
- White 86% Two or more races 5% Hispanic / Latino 4% Asian 3% Black 3%
- Common ancestry
- Romanian 11% Lithuanian 3% Slovak 3%
- Foreign-born
- 9% · Canada, China, South Korea
- Languages at home
- 90% English-only · Other Indo-European 2% Russian/Polish/Slavic 2% Arabic 1%
Political lean MEDSL · Oakland
- 2024 margin
- D (+10.6) · D 54.4% · R 43.8% · Other 1.9%
- 2008→2024 swing
- -3.9pp toward R · 2008: 14.5pp · 2024: 10.6pp
- All cycles
- 2024: D+10.6 2020: D+14.1 2016: D+8.1 2012: D+8.1 2008: D+14.5
Not yet ingested
- Civics
- —
Market trends
- HPI YoY
- ▼ -265.18%
- Current HPI
- 202.3058
- Rent YoY
- —
- Metro
- —
- State GDP YoY
- ▲ 1.37%
- F500 in state
- 28
Industry mix (Fortune 500 HQ in MI)
| Industry | F500 HQs | Revenue |
|---|---|---|
| Automotive Parts | 3 | $48B |
|
||
| Automotive | 2 | $372B |
|
||
| Chemicals | 1 | $45B |
|
||
| Automotive Retail | 1 | $29B |
|
||
| Healthcare / Medical Devices | 1 | $23B |
|
||
| Automotive Technology | 1 | $20B |
|
||
Price history
+875.0% since first listed11 events — show timeline
- 2026-05-21 Listed $195,000 MiRealSource-MiMLS
- 2026-05-21 Listed $195,000 REALCOMP
- 2004-01-20 Sold (Public Records) $126,000 Public Records
- 2003-12-04 Sold (MLS) $126,000 REALCOMP
- 2003-09-09 Listed $134,900 REALCOMP
- 1997-04-28 Sold (Public Records) $95,500 Public Records
- 1997-04-01 Sold (MLS) $95,500 REALCOMP
- 1997-01-29 Listed $94,900 REALCOMP
- 1994-08-25 Sold (Public Records) $78,500 Public Records
- 1992-08-03 Sold (Public Records) $57,000 Public Records
- 1985-09-06 Sold (Public Records) $20,000 Public Records
Property tax history
+2.6%/yrLatest (2025): $2,413 · +3.5% YoY. Source: county tax records.
Cash-flow waterfall
monthlySold comps — $/sqft
last 12 mo · ≤1 miLoading sold comps…