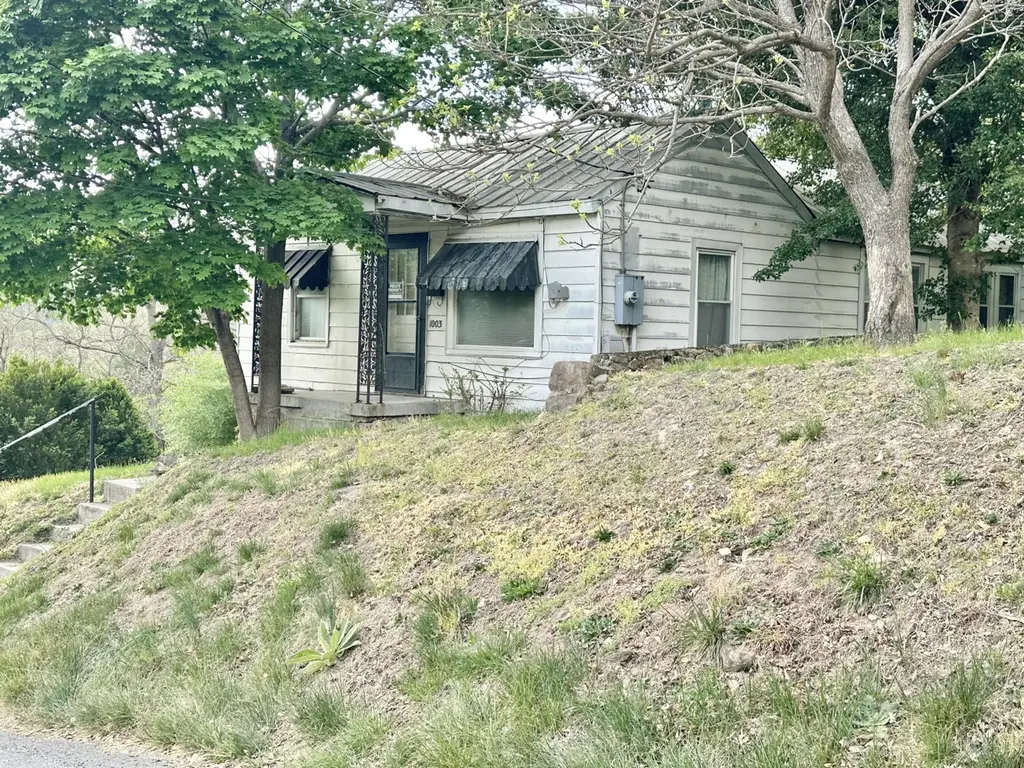
1003 College St · Narrows, VA
Flood risk 1/10 · Minimal
- FEMA flood zone
- X (unshaded)
- Chance of flooding over 30 yrs
- 0.0%
- Est. flood insurance / yr
- $473 – $860
Fire risk 3/10 · Minor
- Est. fire insurance / yr
- $666 – $1,236
Heat risk 4/10 · Minor
- Hot days now (above 91°F)
- 9 days/yr
- Hot days in 30 yrs
- 27 days/yr
Wind risk 2/10 · Minimal
- Chance of severe wind over 30 yrs
- 0.0%
Air-quality risk 1/10 · Minimal
- Unhealthy air days now
- 0 days/yr
- Unhealthy air days in 30 yrs
- 0 days/yr
Risk factors via First Street. Map © Google.
Why this score? — see what drove the C- grade
The composite is a weighted blend of 9 inputs, each scored 0–100. Each bar is that input's sub-score; the figure is the points it added to the 100-point composite (weight × sub-score).
- Cash flow +18.4/30.0
- Appreciation +8.0/10.0
- DSCR +5.8/10.0
- Schools +5.2/10.0
- 1% rule +3.7/10.0
- Livability +3.6/5.0
- Rent growth +2.5/5.0
- Condition / age +2.5/5.0
- ARV discount +2.0/15.0
$99,400
🖨 Deal sheet (PDF) 📄 Offer letter ✓ Due diligence
Listing remarks
Discover the opportunity to make this 1,364 sq ft, 2-bedroom, 1-bath home truly your own. Situated on a rare double lot in Narrows, this property offers space, privacy, and plenty of potential for customization. Inside, the home provides a solid layout and great potential for updates, making it an excellent opportunity for buyers looking to add their own style and build equity. One of the standout features is the rooftop patio--ready to be reimagined into a peaceful retreat or entertaining space with the right vision. Priced with improvements in mind, this property is ideal for investors, first-time buyers, or anyone looking for a home they can customize over time. Don't miss the chance to
Key facts
- Double lot
- Rooftop patio
- Solid layout
Tags
Property features AI
Exterior
- Utilities: Public water; Public sewer; Natural gas available
- Home design: Residential property; One-story
- Construction: Aluminum siding; Stone foundation; Built with metal roof
- Exterior features: Metal roof; Has a view
Interior
- Kitchen: Oven
- Flooring: Hardwood; Vinyl; Laminate
- Bathrooms: 1 full bathroom
- Heating & cooling: Floor furnace heating; No central cooling
- Interior features: Laminate counters; Wood-burning stove fireplace
Neighborhood map
What this means for you Summary
Snapshot
- This is a 2-bed/1.0-bath single-family listed at $99k.
Deal economics
- At list price, monthly cash flow is $92 ($1k/yr) — positive.
- The deal already cash-flows at list — no discount required.
- To meet the 1% rule (rent ≥ 1% of price), the offer needs to be $86k (13.5% below list).
- Recommended offer: $86k (13.5% below list) — sets the bar for 1% rule.
Location & tenants
- Location reads 72/100 on livability (#204 in VA) — a middle-class / working-renter tenant base. Strengths: crime A+, cost of living A+, housing A+; Watch: amenities F, commute F, health & safety F.
- Giles County Public School District (rural): math 56% / reading 68% proficiency, ranked #54 of 131 in VA (top 41%) — acceptable for families but not a draw, mixed tenant base, ~2y average lease.
- Market conditions: 41 active listings in the ZIP; 25 units permitted in Giles County in 2024 (0 in 5+ unit buildings).
Forward outlook
- In year one you build about $7k of equity ($687 loan paydown + $6k appreciation (6.0% local appreciation)).
- Giles County population projected at -18% by 2050 — secular population decline; favor cash flow + early exit over multi-decade hold.
- At projected returns (6.0% appreciation + 3.0% rent growth), your $28k cash investment doubles in ~4 years — after that, you're playing with house money.
- By year 6, paydown + projected appreciation supports a ~$36k cash-out refi (75% LTV) — recoverable capital for the next deal without selling this one.
Negotiation context
- It's been on market 50 days — a 3% lower offer ($96k) is reasonable based on typical stale-listing flexibility.
- Current owner paid $32k; list at $99k implies a 211% gain — meaningful room to come down on a strong offer.
Risks & watch-outs
- Watch-outs: built in 1940 — expect roof / HVAC / electrical / plumbing capex.
Questions for the listing agent
- It's been on market 50 days. Have you received any prior offers? Is the seller open to a 13% concession, seller financing, or rate buy-down credit?
- Built in 1940 — when were the roof, HVAC, electrical panel, plumbing, and water heater last replaced?
- Is there a deadline driving the sale (1031 exchange, divorce, estate, relocation)? That informs how much negotiation room exists.
- Schools are B-rated — typically a magnet for longer-tenancy family renters. What's the average tenant stay here, and is there a school-zone premium baked into asking?
- What's the average days-on-market for RENTAL listings here right now (not sales)? A rising rental-DOM trend means longer vacancies and softer asking-rent achievability than the comps imply.
- What's the recent tenant-quality profile in this submarket — average credit score on applications, eviction rate, late-payment / NSF rate, and stable-employment percentage? A property-management company in the area should have these aggregated.
- How much new for-sale + rental construction is in the pipeline within 1–3 miles? Heavy new supply typically softens prices + rents 12–24 months out; constrained supply supports both.
Investment metrics
- 1% rule
- 0.87% ✗
- Cap rate
- 7.41%
- Cash-on-cash
- 3.98%
- DSCR
- 1.18
- GRM
- 9.6
CMA / ARV
- ARV (median comp)
- $88,576
- List price
- $99,400
- Delta
- 12.22%
- Verdict
- OVERPRICED
- Comps
- 20 within 1.0 mi
Show comp detail 2 sales within ~0.75 mi
| Address | Dist | Beds/Ba | Sqft | Sold | Price | $/sf | Match |
|---|---|---|---|---|---|---|---|
| 512 Northview St | 0.13mi | 3/1.0 (+1) | 896 (+4%) | 1mo | $57,000 | $64 | 82 |
| 573 Poplar St | 0.60mi | 3/1.0 (+1) | 936 (+8%) | 14mo | $89,000 | $95 | 42 |
Match score weights: distance 35% · size 25% · config 20% · recency 20%. Top-matched comps best support the ARV.
Projected returns pro-forma
6.04% appreciation · 3.0% rent growth · sell at horizon
- IRR
- 18.7%
- Equity multiple
- 2.25×
- Total profit
- $34,736
- Equity at exit
- $62,706
- IRR
- 18.2%
- Equity multiple
- 4.50×
- Total profit
- $97,417
- Equity at exit
- $113,905
Cash invested: $27,832 (down + closing). Projections, not guarantees.
Landlord ↔ Tenant lean methodology
- Overall (STATE)
- 55 Moderately Landlord-Leaning
- State Virginia
- 55 Moderately Landlord-Leaning · D+2
- County
- — inherits STATE
- City
- — inherits STATE
ZIP-level market 24124
- Home prices YoY
- 3.1%
- Active inventory
- 41
- Price-to-rent
- 9.6×
Monthly cashflow live
- Estimated rent
- $860 medium interval (Pro) →
- Mortgage (P&I)
- −$521
- Tax from tax record
- −$24 /mo · $292/yr
- Insurance
- −$41
- HOA
- −$0
- Vacancy / Maint / Mgmt
- −$181
- Net cashflow
- $92
Break-even live
Sensitivity live
| Price | -10% $149 | -5% $120 | +0% $92 | +5% $64 | +10% $36 |
|---|---|---|---|---|---|
| Rent | -10% $24 | -5% $58 | +0% $92 | +5% $126 | +10% $160 |
| Rate | -1.0pp $142 | -0.5pp $118 | base $92 | +0.5pp $67 | +1.0pp $40 |
UW: 25.0% down · 7.5% · 30yr · 1.5% tax · 5.0% vac · 8.0% maint · 8.0% mgmt
Financing live
Cash to close
- Down payment
- $24,850
- Closing costs
- $2,982
- Reserves months
- —
- Total cash needed
- —
Loan-product check · same deal, 3 products live
Conventional
25% down · 7.5% · 30yr
- Down + closing
- —
- Monthly P&I
- —
- Monthly cashflow
- —
- DSCR
- —
- Eligible?
- —
Personal DTI + credit; lowest rate.
DSCR
20% down · 8.5% · 30yr
- Down + closing
- —
- Monthly P&I
- —
- Monthly cashflow
- —
- DSCR
- —
- Eligible?
- —
No personal income docs; deal must DSCR.
Hard money
10% down · 12.0% · 12mo
- Down + closing
- —
- Monthly P&I
- —
- Monthly cashflow
- —
- DSCR
- —
- Eligible?
- —
Short-term bridge; refi at stabilization.
Listing history 18 events
-
2026-06-19days on market $99,400 Active 50 DOM
-
2026-06-18days on market $99,400 Active 49 DOM
-
2026-06-17days on market $99,400 Active 48 DOM
-
2026-06-16days on market $99,400 Active 47 DOM
-
2026-06-15days on market $99,400 Active 46 DOM
-
2026-06-14days on market $99,400 Active 44 DOM
-
2026-06-13days on market $99,400 Active 43 DOM
-
2026-06-10days on market $99,400 Active 41 DOM
-
2026-06-09days on market $99,400 Active 40 DOM
-
2026-06-08days on market $99,400 Active 39 DOM
-
2026-06-07days on market $99,400 Active 38 DOM
-
2026-06-03days on market $99,400 Active 34 DOM
-
2026-06-02days on market $99,400 Active 33 DOM
-
2026-06-01days on market $99,400 Active 32 DOM
-
2026-05-31days on market $99,400 Active 31 DOM
-
2026-05-30days on market $99,400 Active 30 DOM
-
2026-04-30$99,400 Active 747-char remark
-
2002-08-23soldstatus $32,000
ⓘ Source: listings_history table (triggers on properties + properties_extension) + one-shot
backfill from property_details.listing_events for pre-trigger history.
Tax reassessment forecast VA · Resets to sale price
- Current annual tax
- $292 · $24/mo
- Projected year-2 tax
- $815 · $68/mo
- Expected delta
- +$523/yr (+$44/mo · 178.8%)
ⓘ Screening estimate from a state-policy table — verify with the county assessor before closing.
Climate risk First Street
- Flood 1/10 Low FEMA zone X (unshaded) · 0% chance over 30 yrs
- Wildfire 3/10 Moderate
- Heat 4/10 Moderate 9 d/yr ≥91°F today · 27 d/yr by 30 yrs out
- Wind 2/10 Low 0% chance of damaging wind over 30 yrs
- Air quality 1/10 Low 0 unhealthy d/yr today · 0 by 30 yrs out
Nearby sold comps map
Loading sold comps map…
Walkable amenities ~0.75 mi
Loading nearby amenities…
Taxation est. · year 1
- Rental income
- $10,319
- − Mortgage interest
- −$5,568
- − Property taxes
- −$292
- − Insurance
- −$497
- − Repairs & maintenance
- −$826
- − Management
- −$826
- − Depreciation
- −$2,892
- Taxable loss
- −$581
- Est. tax savings @ 24.0%
- +$139
- After-tax cash flow
- $1,247/yr
For passive investors: Depreciation is non-cash, so a rental often shows a tax loss while cash-flowing — sheltering income. Rental losses are passive: they offset passive income freely, and up to $25,000/yr can offset ordinary (W-2) income if you actively participate and your MAGI is under $100k (phasing out to $0 by $150k); unused losses carry forward. On sale, claimed depreciation is recaptured at up to 25%, and gains may owe capital-gains tax (a 1031 exchange can defer both). Figures are a year-1 estimate at your 24.0% rate — not tax advice; consult a CPA.
Schools (NCES district)
- District
- Giles County Public School District
- NCES district ID
- 5101590
- Math proficiency
- 56% ▼ -26.00%
- Reading proficiency
- 68% ▼ -8.00%
- Median HH income
- $45,394
- Composite
- 52.25/100
- National rank
- #1600
- State rank
- #54 of 131 in VA
Livability — Narrows
- Score
- 72/100
- State rank
- #204
- US rank
- #6289
Category grades
Schools grade is shown separately in the Schools card above.
Census & demographics
- Census place
- Narrows, VA
- Population (ZIP)
- 4,177
Population outlook (Giles County) Hauer SSP2
- Today (2025)
- 15,868 people
- By 2030
- 15,306 · -3.5%
- By 2040
- 14,149 · -10.8%
- By 2050
- 13,059 · -17.7%
- By 2075
- 10,837 · -31.7%
- By 2100
- 8,648 · -45.5%
Race, ethnicity, and origin ACS 2023
- Neighborhood character
- Predominantly White (94%)
- Race & ethnicity
- White 94% Two or more races 4% Hispanic / Latino 4%
- Common ancestry
- Slovak 2% Serbian 1% Iranian 1%
- Foreign-born
- 1% · Canada
- Languages at home
- 97% English-only · Spanish 3%
Political lean MEDSL · Giles
- 2024 margin
- Solid R (+54.5) · D 22.4% · R 76.9%
- 2008→2024 swing
- -38.2pp toward R · 2008: -16.3pp · 2024: -54.5pp
- All cycles
- 2024: R+54.5 2020: R+51.4 2016: R+48.6 2012: R+25.6 2008: R+16.3
Not yet ingested
- Civics
- —
Market trends
- HPI YoY
- ▲ 6.04%
- Current HPI
- 201.2028
- Rent YoY
- —
- Metro
- —
- State GDP YoY
- ▲ 2.40%
- F500 in state
- 50
Industry mix (Fortune 500 HQ in VA)
| Industry | F500 HQs | Revenue |
|---|---|---|
| Aerospace / Defense | 4 | $236B |
|
||
| Technology / Defense | 3 | $32B |
|
||
| Financial Services | 2 | $176B |
|
||
| Utilities | 2 | $27B |
|
||
| Insurance | 2 | $25B |
|
||
| Technology | 2 | $15B |
|
||
Price history
+210.6% since first listed2 events — show timeline
- 2026-04-30 Listed $99,400 GVBOR
- 2002-08-23 Sold (Public Records) $32,000 Public Records
Property tax history
+2.3%/yrLatest (2025): $292 · +0.0% YoY. Source: county tax records.
Cash-flow waterfall
monthlySold comps — $/sqft
last 12 mo · ≤1 miLoading sold comps…