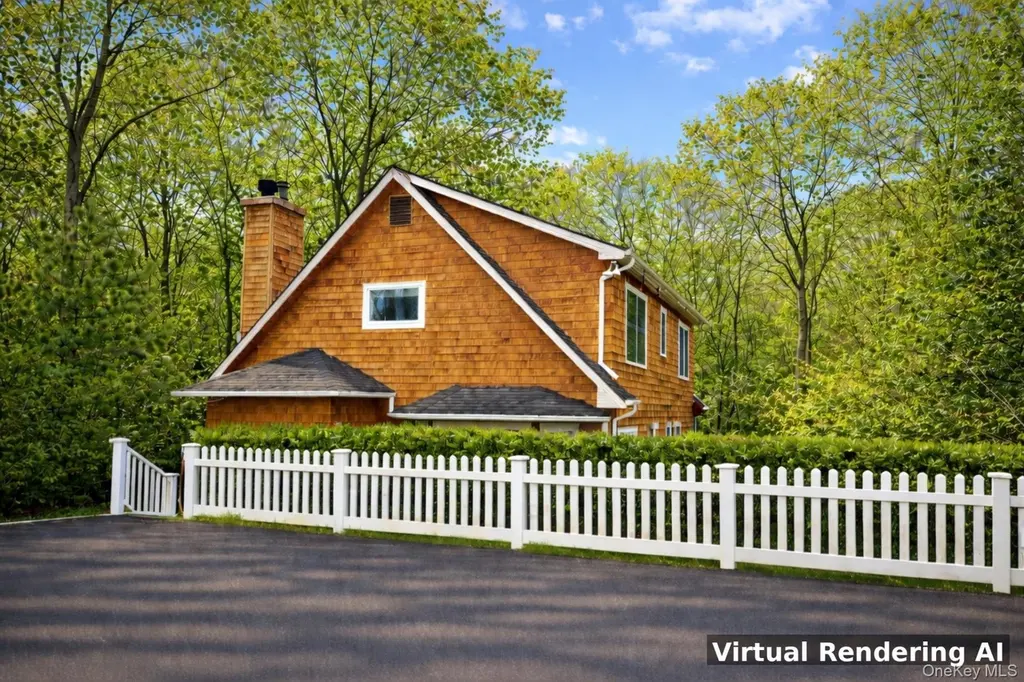
11 Valley St · Northwest Harbor, NY
Flood risk 1/10 · Minimal
- FEMA flood zone
- X (unshaded)
- Chance of flooding over 30 yrs
- 0.0%
- Est. flood insurance / yr
- $473 – $860
Fire risk 3/10 · Minor
- Est. fire insurance / yr
- $691 – $1,283
Heat risk 4/10 · Minor
- Hot days now (above 90°F)
- 7 days/yr
- Hot days in 30 yrs
- 19 days/yr
Wind risk 8/10 · Major
- Chance of severe wind over 30 yrs
- 80.0%
Air-quality risk 3/10 · Minor
- Unhealthy air days now
- 2 days/yr
- Unhealthy air days in 30 yrs
- 3 days/yr
Risk factors via First Street. Map © Google.
Why this score? — see what drove the C+ grade
The composite is a weighted blend of 9 inputs, each scored 0–100. Each bar is that input's sub-score; the figure is the points it added to the 100-point composite (weight × sub-score).
- Cash flow +28.5/30.0
- DSCR +10.0/10.0
- 1% rule +6.6/10.0
- Schools +5.8/10.0
- Rent growth +5.0/5.0
- Livability +3.0/5.0
- Condition / age +2.5/5.0
- ARV discount +0.0/15.0
- Appreciation +0.0/10.0
$1,998,000
🖨 Deal sheet (PDF) 📄 Offer letter ✓ Due diligence
Listing remarks MLS
Valley Street Sanctuary Situated on a shy half-acre in a desirable East Hampton setting, this four-bedroom, three-bath two-story residence offers privacy, comfort, and exceptional outdoor living. Light-filled interiors provide a thoughtful layout suited for both relaxed summer living and year-round enjoyment. The finished lower level features a private sauna, creating a spa-like retreat within the home. Outdoors, beautifully landscaped grounds surround a sparkling gunite in-ground heated pool and stone patio, complemented by an expansive lawn ideal for entertaining or quiet afternoons. The spacious backyard offers both openness and seclusion - a rare balance in today's market. Conveniently located near East Hampton Village, ocean beaches, dining, and shops.
Key facts
- Private sauna
- Spacious backyard
- Expansive lawn
Tags
Neighborhood map
What this means for you Summary
Snapshot
- This is a 4-bed/3.0-bath single-family listed at $2.00M.
Deal economics
- At list price, monthly cash flow is $7k ($78k/yr) — positive.
- The deal already cash-flows at list — no discount required.
- Meets the 1% rule at list price ($23k rent vs $2.00M).
- Recommended offer: $1.82M (9.0% below list) — sets the bar for market timing.
- Cap rate 10.2% vs local median 7.8% in Northwest Harbor — top-decile yield for the area; either an underpriced asset or a hidden risk that comps aren't pricing in. Stress-test before assuming the spread holds.
Location & tenants
- Location reads 60/100 on livability (#1,007 in NY) — a middle-class / working-renter tenant base. Strengths: crime A+, employment A+; Watch: schools D+, amenities F, commute F.
- East Hampton Union Free School District (town): math 62% / reading 66% proficiency, ranked #159 of 590 in NY (top 27%) — acceptable for families but not a draw, mixed tenant base, ~2y average lease.
- Market conditions: Rents rising fast (+12.3%/yr); 135 active listings in the ZIP; 10 comparable units currently listed for rent nearby; rentals lingering (median 45d on market — plan ~5-8 weeks vacancy on turnover, expect pricing pressure); 50% of comp listings sitting > 30 days — soft ceiling on asking rent; high-income renter base; 1,366 units permitted in Suffolk County in 2024 (216 in 5+ unit buildings).
- At $23,237/mo this rent would consume 215% of the median local household income ($130k/yr) (locally 896% of renters already pay >50% of income on rent) — very limited rent-growth headroom before tenants either downsize or default.
Forward outlook
- Local home prices are declining (-3.0%/yr); year-one equity from $14k of loan paydown is wiped out by about $60k of value loss. Plan a longer hold.
- Suffolk County population projected to shrink 5% by 2050 — rents likely to lag national; underwrite the cash flow, not the appreciation.
- At projected returns (-3.0% appreciation + 8.0% rent growth), your $559k cash investment doubles in ~7 years — after that, you're playing with house money.
Negotiation context
- It's been on market 110 days — a 9% lower offer ($1.82M) is reasonable based on typical stale-listing flexibility.
- 6 sale attempts since 14y ago with the ask held roughly flat each time — persistent listings suggest the price (not the market) is what's stuck; bring a comps-based counter.
- Current owner paid $515k; list at $2.00M implies a 288% gain — meaningful room to come down on a strong offer.
Risks & watch-outs
- Climate carrying-cost: severe wind risk, 80% chance of damaging wind over 30y — expect insurance premiums to compound above CPI over the hold.
Questions for the listing agent
- It's been on market 110 days. Have you received any prior offers? Is the seller open to a 9% concession, seller financing, or rate buy-down credit?
- Why hasn't it sold? Are there any deal-killer items the seller is aware of (foundation, flood, title, zoning, code violations)?
- Is there a deadline driving the sale (1031 exchange, divorce, estate, relocation)? That informs how much negotiation room exists.
- Schools are D-rated, which usually means shorter tenancies and higher turnover. Who's the typical renter profile here, and what's been the actual vacancy rate?
- What's the average days-on-market for RENTAL listings here right now (not sales)? A rising rental-DOM trend means longer vacancies and softer asking-rent achievability than the comps imply.
- What's the recent tenant-quality profile in this submarket — average credit score on applications, eviction rate, late-payment / NSF rate, and stable-employment percentage? A property-management company in the area should have these aggregated.
- How much new for-sale + rental construction is in the pipeline within 1–3 miles? Heavy new supply typically softens prices + rents 12–24 months out; constrained supply supports both.
Investment metrics
- 1% rule
- 1.16% ✓
- Cap rate
- 10.21%
- Cash-on-cash
- 13.98%
- DSCR
- 1.62
- GRM
- 7.2
CMA / ARV
- ARV (median comp)
- $1,630,010
- List price
- $1,998,000
- Delta
- 22.58%
- Verdict
- OVERPRICED
- Comps
- 8 within 1.0 mi
Projected returns pro-forma
-3.0% appreciation · 8.0% rent growth · sell at horizon
- IRR
- 9.2%
- Equity multiple
- 1.38×
- Total profit
- $213,309
- Equity at exit
- $297,908
- IRR
- 21.9%
- Equity multiple
- 3.28×
- Total profit
- $1,275,715
- Equity at exit
- $172,751
Cash invested: $559,440 (down + closing). Projections, not guarantees.
Landlord ↔ Tenant lean methodology
- Overall (STATE)
- 15 Strongly Tenant-Friendly
- State New York
- 15 Strongly Tenant-Friendly · D+10
- County
- — inherits STATE
- City
- — inherits STATE
ZIP-level market 11937
- Rents YoY
- 12.3%
- Active inventory
- 135
- Price-to-rent
- 7.2×
Monthly cashflow live
- Estimated rent
- $23,237 medium interval (Pro) →
- Mortgage (P&I)
- −$10,478
- Tax from tax record
- −$529 /mo · $6,346/yr
- Insurance
- −$832
- HOA
- −$0
- Vacancy / Maint / Mgmt
- −$4,880
- Net cashflow
- $6,518
Break-even live
Sensitivity live
| Price | -10% $7,649 | -5% $7,083 | +0% $6,518 | +5% $5,952 | +10% $5,387 |
|---|---|---|---|---|---|
| Rent | -10% $4,682 | -5% $5,600 | +0% $6,518 | +5% $7,436 | +10% $8,354 |
| Rate | -1.0pp $7,524 | -0.5pp $7,026 | base $6,518 | +0.5pp $6,000 | +1.0pp $5,473 |
UW: 25.0% down · 7.5% · 30yr · 1.5% tax · 5.0% vac · 8.0% maint · 8.0% mgmt
Financing live
Cash to close
- Down payment
- $499,500
- Closing costs
- $59,940
- Reserves months
- —
- Total cash needed
- —
Loan-product check · same deal, 3 products live
Conventional
25% down · 7.5% · 30yr
- Down + closing
- —
- Monthly P&I
- —
- Monthly cashflow
- —
- DSCR
- —
- Eligible?
- —
Personal DTI + credit; lowest rate.
DSCR
20% down · 8.5% · 30yr
- Down + closing
- —
- Monthly P&I
- —
- Monthly cashflow
- —
- DSCR
- —
- Eligible?
- —
No personal income docs; deal must DSCR.
Hard money
10% down · 12.0% · 12mo
- Down + closing
- —
- Monthly P&I
- —
- Monthly cashflow
- —
- DSCR
- —
- Eligible?
- —
Short-term bridge; refi at stabilization.
Rent comps 10 comps
| Address | Beds | Baths | Sqft | Rent | $/sqft | DOM | Units | Dist |
|---|---|---|---|---|---|---|---|---|
| 36 Barnes Ave East Hampton, NY | 4.0 | 3.0 | 2346 | $55,000 | $23.44 | 25d | 1 | 0.47mi |
| 23 Wooded Oak Ln East Hampton, NY | 3.0 | 2.0 | 1560 | $25,000 | $16.03 | 45d | 1 | 0.55mi |
| 202 Treescape Dr Unit 10B East Hampton, NY | 4.0 | 3.0 | 2200 | $50,000 | $22.73 | 25d | 1 | 0.77mi |
| 15 Rivers Rd East Hampton, NY | 3.0 | 4.0 | 2400 | $45,000 | $18.75 | 45d | 1 | 0.88mi |
| 210 Treescape Dr East Hampton, NY | 3.0 | 2.0 | 2400 | $25,000 | $10.42 | 45d | 1 | 0.88mi |
| 17 Joshua Edwards Ct East Hampton, NY | 3.0 | 2.0 | 1800 | $40,000 | $22.22 | 45d | 1 | 1.06mi |
| 3 Forest Ct East Hampton, NY | 3.0 | 2.0 | 1750 | $50,000 | $28.57 | 25d | 1 | 1.09mi |
| 10 Villa Ave East Hampton, NY | 3.0 | 4.0 | 2200 | $35,000 | $15.91 | 25d | 1 | 1.12mi |
| 72 Long Ln East Hampton, NY | 3.0 | 2.5 | 2000 | $5,000 | $2.50 | 20d | 1 | 1.23mi |
| 3 Oak Hill Ln East Hampton, NY | 4.0 | 3.5 | 2000 | $90,000 | $45.00 | 45d | 1 | 1.50mi |
Listing history 30 events
-
2026-06-21days on market $1,998,000 Active 110 DOM
-
2026-06-18days on market $1,998,000 Active 107 DOM
-
2026-06-17days on market $1,998,000 Active 106 DOM
-
2026-06-16days on market $1,998,000 Active 105 DOM
-
2026-06-15days on market $1,998,000 Active 104 DOM
-
2026-06-13days on market $1,998,000 Active 102 DOM
-
2026-06-13days on market $1,998,000 Active 101 DOM
-
2026-06-09days on market $1,998,000 Active 98 DOM
-
2026-06-08days on market $1,998,000 Active 97 DOM
-
2026-06-07days on market $1,998,000 Active 96 DOM
-
2026-06-04days on market $1,998,000 Active 93 DOM
-
2026-06-03days on market $1,998,000 Active 92 DOM
-
2026-06-02days on market $1,998,000 Active 91 DOM
-
2026-06-01days on market $1,998,000 Active 90 DOM
-
2026-05-31days on market $1,998,000 Active 89 DOM
-
2026-03-03$1,998,000 Active 767-char remark
Show marketing remark (767 chars)
Valley Street Sanctuary Situated on a shy half-acre in a desirable East Hampton setting, this four-bedroom, three-bath two-story residence offers privacy, comfort, and exceptional outdoor living. Light-filled interiors provide a thoughtful layout suited for both relaxed summer living and year-round enjoyment. The finished lower level features a private sauna, creating a spa-like retreat within the home. Outdoors, beautifully landscaped grounds surround a sparkling gunite in-ground heated pool and stone patio, complemented by an expansive lawn ideal for entertaining or quiet afternoons. The spacious backyard offers both openness and seclusion - a rare balance in today's market. Conveniently located near East Hampton Village, ocean beaches, dining, and shops.
-
2014-05-21soldstatus $515,000
-
2014-04-11soldstatus $515,000 Closed 204-char remark
Show marketing remark (204 chars)
Move In Condition 4 Bedroom, 2 Bathroom House In A Quiet Area Of East Hampton North West. House Boasts All Amenities You Need Plus The Privacy Of The Area. Great Bargain Which Wont Last Long, So Act Fast.
-
2014-04-11soldstatus $515,000
Show marketing remark (204 chars)
Move In Condition 4 Bedroom, 2 Bathroom House In A Quiet Area Of East Hampton North West. House Boasts All Amenities You Need Plus The Privacy Of The Area. Great Bargain Which Wont Last Long, So Act Fast.
-
2014-01-15status Listing Extended 204-char remark
Show marketing remark (204 chars)
Move In Condition 4 Bedroom, 2 Bathroom House In A Quiet Area Of East Hampton North West. House Boasts All Amenities You Need Plus The Privacy Of The Area. Great Bargain Which Wont Last Long, So Act Fast.
-
2014-01-15historical 204-char remark
Show marketing remark (204 chars)
Move In Condition 4 Bedroom, 2 Bathroom House In A Quiet Area Of East Hampton North West. House Boasts All Amenities You Need Plus The Privacy Of The Area. Great Bargain Which Wont Last Long, So Act Fast.
-
2013-11-27price $575,000 Price Change 204-char remark
Show marketing remark (204 chars)
Move In Condition 4 Bedroom, 2 Bathroom House In A Quiet Area Of East Hampton North West. House Boasts All Amenities You Need Plus The Privacy Of The Area. Great Bargain Which Wont Last Long, So Act Fast.
-
2013-09-06$599,000 New 204-char remark
Show marketing remark (204 chars)
Move In Condition 4 Bedroom, 2 Bathroom House In A Quiet Area Of East Hampton North West. House Boasts All Amenities You Need Plus The Privacy Of The Area. Great Bargain Which Wont Last Long, So Act Fast.
-
2013-07-14historical
-
2013-01-14$575,000
-
2013-01-14$599,000
-
2012-12-17historical
-
2012-10-04$525,000
-
2004-09-24soldstatus $250,000
-
2004-01-15soldstatus $185,000
ⓘ Source: listings_history table (triggers on properties + properties_extension) + one-shot
backfill from property_details.listing_events for pre-trigger history.
Tax reassessment forecast NY · Partial reset (capped growth)
- Current annual tax
- $6,346 · $529/mo
- Projected year-2 tax
- $20,056 · $1,671/mo
- Expected delta
- +$13,710/yr (+$1,143/mo · 216.1%)
ⓘ Screening estimate from a state-policy table — verify with the county assessor before closing.
Climate risk First Street
- Flood 1/10 Low FEMA zone X (unshaded) · 0% chance over 30 yrs
- Wildfire 3/10 Moderate
- Heat 4/10 Moderate 7 d/yr ≥90°F today · 19 d/yr by 30 yrs out
- Wind 8/10 Severe 80% chance of damaging wind over 30 yrs
- Air quality 3/10 Moderate 2 unhealthy d/yr today · 3 by 30 yrs out
Nearby sold comps map
Loading sold comps map…
Walkable amenities ~0.75 mi
Loading nearby amenities…
Taxation est. · year 1
- Rental income
- $278,840
- − Mortgage interest
- −$111,919
- − Property taxes
- −$6,346
- − Insurance
- −$9,990
- − Repairs & maintenance
- −$22,307
- − Management
- −$22,307
- − Depreciation
- −$58,124
- Taxable income
- $47,847
- Est. tax owed @ 24.0%
- −$11,483
- After-tax cash flow
- $66,732/yr
For passive investors: Depreciation is non-cash, so a rental often shows a tax loss while cash-flowing — sheltering income. Rental losses are passive: they offset passive income freely, and up to $25,000/yr can offset ordinary (W-2) income if you actively participate and your MAGI is under $100k (phasing out to $0 by $150k); unused losses carry forward. On sale, claimed depreciation is recaptured at up to 25%, and gains may owe capital-gains tax (a 1031 exchange can defer both). Figures are a year-1 estimate at your 24.0% rate — not tax advice; consult a CPA.
Schools (NCES district)
- District
- East Hampton Union Free School District
- NCES district ID
- 3609660
- Math proficiency
- 62% ▼ -5.00%
- Reading proficiency
- 66% ▲ 2.00%
- Median HH income
- $86,309
- Composite
- 57.85/100
- National rank
- #1046
- State rank
- #159 of 590 in NY
Livability — Northwest Harbor
- Score
- 60/100
- State rank
- #1007
- US rank
- #19577
Category grades
Schools grade is shown separately in the Schools card above.
Census & demographics
- Census place
- Northwest Harbor, NY
- County
- Suffolk County · 679,920 people
- City population
- 21,806
- Metro
- New York-Newark-Jersey City, NY-NJ-PA
- Population (ZIP)
- 21,882
- Household income
- $129,883
- Rent vs Own
- Severe rent burden
- 896.0
Population outlook (Suffolk County) Hauer SSP2
- Today (2025)
- 1,505,262 people
- By 2030
- 1,498,318 · -0.5%
- By 2040
- 1,471,101 · -2.3%
- By 2050
- 1,424,848 · -5.3%
- By 2075
- 1,337,157 · -11.2%
- By 2100
- 1,217,720 · -19.1%
Race, ethnicity, and origin ACS 2023
- Neighborhood character
- Majority White (61%)
- Race & ethnicity
- White 61% Hispanic / Latino 32% Two or more races 23% Black 2% Asian 2%
- Hispanic origin (detail)
- Mexican 2% Puerto Rican 1%
- Common ancestry
- Romanian 5% Scotch-Irish 4% Italian 2%
- Foreign-born
- 25% · Canada, Guatemala, Jamaica
- Languages at home
- 68% English-only · Spanish 28% Other Indo-European 1% Russian/Polish/Slavic 1%
Political lean MEDSL · Suffolk
- 2024 margin
- Lean R (+10.0) · D 45.0% · R 55.0%
- 2008→2024 swing
- -16.0pp toward R · 2008: 6.0pp · 2024: -10.0pp
- All cycles
- 2024: R+10.0 2020: R+0.0 2016: R+8.2 2012: D+2.9 2008: D+6.0
Not yet ingested
- Civics
- —
Market trends
- HPI YoY
- ▼ -285.21%
- Current HPI
- 444.1499
- Rent YoY
- ▲ 12.28%
- Metro
- New York-Newark-Jersey City, NY-NJ-PA
- State GDP YoY
- ▲ 2.60%
- F500 in state
- 92
Industry mix (Fortune 500 HQ in NY)
| Industry | F500 HQs | Revenue |
|---|---|---|
| Financial Services | 10 | $950B |
|
||
| Consumer Goods | 9 | $162B |
|
||
| Insurance | 4 | $225B |
|
||
| Telecommunications | 2 | $144B |
|
||
| Pharmaceuticals | 2 | $112B |
|
||
| Media / Entertainment | 2 | $69B |
|
||
Price history
+980.0% since first listed15 events — show timeline
- 2026-03-03 Listed $1,998,000 OneKey® MLS as Distributed by MLS Grid
- 2014-05-21 Sold (Public Records) $515,000 Public Records
- 2014-04-11 Sold (MLS) $515,000 OneKey® MLS as Distributed by MLS Grid
- 2014-04-11 Sold (MLS) $515,000 MLSLI
- 2014-01-15 Relisted — MLSLI
- 2014-01-15 Delisted — MLSLI
- 2013-11-27 Price Changed $575,000 MLSLI
- 2013-09-06 Listed $599,000 MLSLI
- 2013-07-14 Listing Removed — OneKey® MLS as Distributed by MLS Grid
- 2013-01-14 Listed $599,000 OneKey® MLS as Distributed by MLS Grid
- 2013-01-14 Listed $575,000 OneKey® MLS as Distributed by MLS Grid
- 2012-12-17 Listing Removed — OneKey® MLS as Distributed by MLS Grid
- 2012-10-04 Listed $525,000 OneKey® MLS as Distributed by MLS Grid
- 2004-09-24 Sold (Public Records) $250,000 Public Records
- 2004-01-15 Sold (Public Records) $185,000 Public Records
Property tax history
+0.8%/yrLatest (2025): $6,346 · +0.0% YoY. Source: county tax records.
Cash-flow waterfall
monthlySold comps — $/sqft
last 12 mo · ≤1 miLoading sold comps…