 Duplex
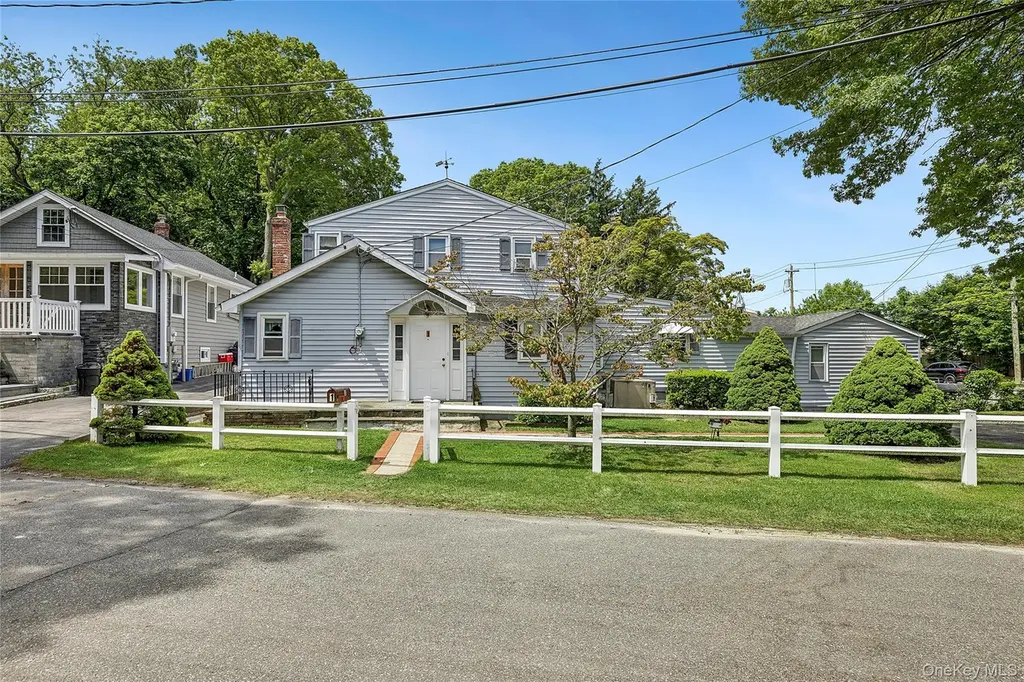
1 Beverly Rd · Glen Cove, NY
Flood risk 8/10 · Major
- FEMA flood zone
- X (unshaded)
- Chance of flooding over 30 yrs
- 0.99%
- Est. flood insurance / yr
- $473 – $860
Fire risk 1/10 · Minimal
- Est. fire insurance / yr
- $691 – $1,283
Heat risk 6/10 · Moderate
- Hot days now (above 97°F)
- 7 days/yr
- Hot days in 30 yrs
- 16 days/yr
Wind risk 6/10 · Moderate
- Chance of severe wind over 30 yrs
- 64.0%
Air-quality risk 5/10 · Moderate
- Unhealthy air days now
- 6 days/yr
- Unhealthy air days in 30 yrs
- 8 days/yr
Risk factors via First Street. Map © Google.
Why this score? — see what drove the C+ grade
The composite is a weighted blend of 9 inputs, each scored 0–100. Each bar is that input's sub-score; the figure is the points it added to the 100-point composite (weight × sub-score).
- Cash flow +23.0/30.0
- ARV discount +10.3/15.0
- DSCR +7.4/10.0
- 1% rule +4.9/10.0
- Schools +4.7/10.0
- Rent growth +4.1/5.0
- Livability +3.2/5.0
- Condition / age +2.5/5.0
- Appreciation +0.0/10.0
$799,000
🖨 Deal sheet (PDF) 📄 Offer letter ✓ Due diligence
Multi-family units
County records classify this as Multi-Family (2-4 Unit). Listing-text estimate: 2 units. confirmed
Listing remarks
Two-Family Double treat! Ideal property for investors or buyers looking to offset their mortgage with rental income . Main house feature 1st floor bedroom with 2 additional 2nd floor bedrooms & 1.5 baths. The 2nd unit offers ground level entry with no steps leading into an open spacious living room with galley kitchen, full bath and bedroom. 1 Beverly Rd is the perfect match between home ownership & and an income producing asset. Plenty of parking for both units with 2 large parking pads.
Key facts
- Large parking pads
- Galley kitchen
- Ground level entry
Tags
Property features AI
Exterior
- Parking: Driveway parking; On-street parking; Total of 7 parking spaces; Detached 2-car garage
- Utilities: Public sewer; Natural gas available and connected; Water connected; Sewer connected; Public trash collection
- Home design: Duplex
- Construction: Vinyl siding; Block foundation
- Exterior features: Back yard; Front yard; Corner lot; Cul-de-sac lot; Near golf course; Near shops; Porch
Interior
- Bedrooms: One 1-bedroom unit; One 3-bedroom unit
- Flooring: Carpet; Hardwood
- Bathrooms: Three full bathrooms
- Heating & cooling: Baseboard heating; Hot water heating; Natural gas heating; Wall/window air conditioning units
- Interior features: First-floor full bathroom; Full unfinished walk-out basement with Bilco doors; Full attic
- Laundry & utility: Laundry area (other)
Neighborhood map
What this means for you Summary
Snapshot
- This is a 2 × 2-bed/1.5-bath units multifamily listed at $799k.
Deal economics
- At list price, monthly cash flow is $1k ($16k/yr) — positive. Per door: $681/mo.
- The deal already cash-flows at list — no discount required.
- To meet the 1% rule (rent ≥ 1% of price), the offer needs to be $788k (1.4% below list).
- Recommended offer: $787k (1.5% below list) — sets the bar for market timing.
- Cap rate 8.4% vs local median 3.7% in Glen Cove — top-decile yield for the area; either an underpriced asset or a hidden risk that comps aren't pricing in. Stress-test before assuming the spread holds.
Location & tenants
- Location reads 65/100 on livability (#685 in NY) — a middle-class / working-renter tenant base. Strengths: crime A+, employment A+; Watch: housing C-, amenities F, commute F.
- Glen Cove City School District (suburban): math 50% / reading 55% proficiency, ranked #312 of 590 in NY (top 53%) — acceptable for families but not a draw, mixed tenant base, ~2y average lease.
- Zoned schools: Gribbin School (341 students, 54% FRL); Robert M Finley Middle School (math 43% / reading 47%, grade D, #342 of 729 statewide, top 48%, 710 students, 70% FRL); Glen Cove High School (math 85% / reading 87%, grade A, #347 of 1,100 statewide, top 32%, 1,050 students, 55% FRL).
- Zoned-school proficiency averages 66% at this address vs 52% district-wide (+13 pts) — the actual schools serving this property are materially stronger than the Glen Cove City School District average implies; a family-tenant draw the district grade alone would hide.
- Market conditions: Rents rising fast (+6.4%/yr); 144 active listings in the ZIP; 13 comparable units currently listed for rent nearby; rentals at typical pace (median 19d on market — plan ~3-4 weeks tenant-placement turnaround); solid renter incomes; 824 units permitted in Nassau County in 2024 (153 in 5+ unit buildings).
- At $7,881/mo this rent would consume 101% of the median local household income ($93k/yr) (locally 1667% of renters already pay >50% of income on rent) — very limited rent-growth headroom before tenants either downsize or default.
Forward outlook
- Local home prices are declining (-3.0%/yr); year-one equity from $6k of loan paydown is wiped out by about $24k of value loss. Plan a longer hold.
- Nassau County population projected at +7% by 2050 — modest demand growth; plan on rents tracking national, not racing it.
- At projected returns (-3.0% appreciation + 6.4% rent growth), your $224k cash investment doubles in ~10 years — after that, you're playing with house money.
Negotiation context
- It's been on market 18 days — a 2% lower offer ($787k) is reasonable based on typical stale-listing flexibility.
Risks & watch-outs
- Watch-outs: flood insurance adds $56/mo; built in 1928 — expect roof / HVAC / electrical / plumbing capex.
- Climate carrying-cost: severe flood risk; major wind risk, 64% chance of damaging wind over 30y; extreme-heat days projected 7→16/yr by 2055 (HVAC capex compounding) — expect insurance premiums to compound above CPI over the hold.
Questions for the listing agent
- Can we see the unit-by-unit rent roll, current vacancy, and any below-market leases? What's the average tenancy length?
- What capital expenditures (roof, boiler, parking lot, exteriors) have been made in the last 5 years, and what's planned in the next 2?
- Built in 1928 — when were the roof, HVAC, electrical panel, plumbing, and water heater last replaced?
- What's the actual annual flood-insurance premium (NFIP or private), and is the property in a SFHA with mandatory coverage?
- Is there a deadline driving the sale (1031 exchange, divorce, estate, relocation)? That informs how much negotiation room exists.
- What's the average days-on-market for RENTAL listings here right now (not sales)? A rising rental-DOM trend means longer vacancies and softer asking-rent achievability than the comps imply.
- What's the recent tenant-quality profile in this submarket — average credit score on applications, eviction rate, late-payment / NSF rate, and stable-employment percentage? A property-management company in the area should have these aggregated.
- How much new apartment / multifamily construction is in the pipeline within 1–3 miles? Heavy new supply (>2% of stock underway) typically softens rents 12–24 months out; light construction supports rent growth.
Investment metrics
- 1% rule
- 0.99% ✗
- Cap rate
- 8.42%
- Cash-on-cash
- 7.60%
- DSCR
- 1.34
- GRM
- 8.4
CMA / ARV
- ARV (on-the-fly)
- $851,902
- Comps found
- 1
Show comp detail 1 sale within ~0.75 mi
| Address | Dist | Beds/Ba | Sqft | Sold | Price | $/sf | Match |
|---|---|---|---|---|---|---|---|
| 226 Glen Cove Ave | 0.66mi | 5/2.0 (+1) | 2,148 (-3%) | 2mo | $830,000 | $386 | 56 |
Match score weights: distance 35% · size 25% · config 20% · recency 20%. Top-matched comps best support the ARV.
Projected returns pro-forma
-3.0% appreciation · 6.43% rent growth · sell at horizon
- IRR
- -1.7%
- Equity multiple
- 0.93×
- Total profit
- $-14,937
- Equity at exit
- $119,133
- IRR
- 11.1%
- Equity multiple
- 1.99×
- Total profit
- $221,350
- Equity at exit
- $69,083
Cash invested: $223,720 (down + closing). Projections, not guarantees.
Landlord ↔ Tenant lean methodology
- Overall (STATE)
- 15 Strongly Tenant-Friendly
- State New York
- 15 Strongly Tenant-Friendly · D+10
- County
- — inherits STATE
- City
- — inherits STATE
ZIP-level market 11542
- Rents YoY
- 6.4%
- Active inventory
- 144
- Price-to-rent
- 16.9×
Monthly cashflow live
- Estimated rent
- $7,881 high interval (Pro) →
- Mortgage (P&I)
- −$4,190
- Tax from tax record
- −$286 /mo · $3,437/yr
- Insurance
- −$333
- Flood insurance flood zone
- −$56 /mo · $666/yr
- HOA
- −$0
- Vacancy / Maint / Mgmt
- −$1,655
- Net cashflow
- $1,361
Break-even live
Sensitivity live
| Price | -10% $1,813 | -5% $1,587 | +0% $1,361 | +5% $1,135 | +10% $909 |
|---|---|---|---|---|---|
| Rent | -10% $738 | -5% $1,050 | +0% $1,361 | +5% $1,672 | +10% $1,984 |
| Rate | -1.0pp $1,763 | -0.5pp $1,564 | base $1,361 | +0.5pp $1,154 | +1.0pp $943 |
2-unit breakdown (identical units grouped — click to expand)
| Units | Beds | Baths | Est. rent |
|---|---|---|---|
| 2× units | 2 | 1.5 | $7,882 |
| #1 | 2 | 1.5 | $3,941 |
| #2 | 2 | 1.5 | $3,941 |
| Total (2 units) | $7,881 | ||
UW: 25.0% down · 7.5% · 30yr · 1.5% tax · 5.0% vac · 8.0% maint · 8.0% mgmt
Financing live
Cash to close
- Down payment
- $199,750
- Closing costs
- $23,970
- Reserves months
- —
- Total cash needed
- —
Loan-product check · same deal, 3 products live
Conventional
25% down · 7.5% · 30yr
- Down + closing
- —
- Monthly P&I
- —
- Monthly cashflow
- —
- DSCR
- —
- Eligible?
- —
Personal DTI + credit; lowest rate.
DSCR
20% down · 8.5% · 30yr
- Down + closing
- —
- Monthly P&I
- —
- Monthly cashflow
- —
- DSCR
- —
- Eligible?
- —
No personal income docs; deal must DSCR.
Hard money
10% down · 12.0% · 12mo
- Down + closing
- —
- Monthly P&I
- —
- Monthly cashflow
- —
- DSCR
- —
- Eligible?
- —
Short-term bridge; refi at stabilization.
Rent comps 13 comps
| Address | Beds | Baths | Sqft | Rent | $/sqft | DOM | Units | Dist |
|---|---|---|---|---|---|---|---|---|
| 11 Park Manor Ct #11 Glen Cove, NY | 3.0 | 1.5 | 2560 | $3,950 | $1.54 | 44d | 1 | 0.61mi |
| 88 Coles St Glen Cove, NY | 3.0 | 2.0 | 2218 | $5,500 | $2.48 | 19d | 1 | 0.75mi |
| 20 Alex Ln Unit 2 Glen Cove, NY | 3.0 | 2.0 | 1407 | $4,000 | $2.84 | 44d | 1 | 0.77mi |
| 8 Jackson St Unit 1 Glen Cove, NY | 3.0 | 1.0 | 1900 | $3,700 | $1.95 | 8d | 1 | 0.82mi |
| 8 Jackson St Glen Cove, NY | 3.0 | 1.0 | 1400 | $3,750 | $2.68 | 8d | 1 | 0.82mi |
| 8 Jackson St Unit 1 Glen Cove, NY | 3.0 | 1.0 | 1900 | $3,700 | $1.95 | 25d | 1 | 0.82mi |
| 21 Continental Pl Unit B Glen Cove, NY | 4.0 | 2.0 | 2819 | $4,950 | $1.76 | 11d | 1 | 0.84mi |
| 8 Locust St Glen Cove, NY | 3.0 | 1.5 | 1500 | $4,100 | $2.73 | 7d | 1 | 0.87mi |
| 8 Lee Gray Ct Glen Cove, NY | 4.0 | 2.5 | 1900 | $4,800 | $2.53 | 2d | 1 | 0.90mi |
| 29 Hendrick Ave Unit B Glen Cove, NY | 3.0 | 1.0 | 1546 | $3,200 | $2.07 | 25d | 1 | 0.98mi |
| 18 Park Ave Glen Cove, NY | 3.0 | 2.0 | 1600 | $3,995 | $2.50 | 25d | 1 | 1.28mi |
| 21 Franklin Ave Glen Cove, NY | 4.0 | 2.0 | 1467 | $5,400 | $3.68 | 12d | 1 | 1.37mi |
| 63 Franklin Ave Glen Cove, NY | 3.0 | 1.0 | 1817 | $3,400 | $1.87 | 44d | 1 | 1.49mi |
Listing history 11 events
-
2026-06-15days on market $799,000 Active 18 DOM
-
2026-06-13days on market $799,000 Active 16 DOM
-
2026-06-13days on market $799,000 Active 15 DOM
-
2026-06-09days on market $799,000 Active 12 DOM
-
2026-06-08days on market $799,000 Active 11 DOM
-
2026-06-07days on market $799,000 Active 10 DOM
-
2026-06-04days on market $799,000 Active 7 DOM
-
2026-06-03days on market $799,000 Active 6 DOM
-
2026-06-02days on market $799,000 Active 5 DOM
-
2026-06-01days on market $799,000 Active 4 DOM
-
2026-05-31days on market $799,000 Active 3 DOM
ⓘ Source: listings_history table (triggers on properties + properties_extension) + one-shot
backfill from property_details.listing_events for pre-trigger history.
Tax reassessment forecast NY · Partial reset (capped growth)
- Current annual tax
- $3,437 · $286/mo
- Projected year-2 tax
- $8,470 · $706/mo
- Expected delta
- +$5,033/yr (+$419/mo · 146.4%)
ⓘ Screening estimate from a state-policy table — verify with the county assessor before closing.
Climate risk First Street
- Flood 8/10 Severe FEMA zone X (unshaded) · 99% chance over 30 yrs
- Wildfire 1/10 Low
- Heat 6/10 Major 7 d/yr ≥97°F today · 16 d/yr by 30 yrs out
- Wind 6/10 Major 64% chance of damaging wind over 30 yrs
- Air quality 5/10 Major 6 unhealthy d/yr today · 8 by 30 yrs out
Nearby sold comps map
Loading sold comps map…
Walkable amenities ~0.75 mi
Loading nearby amenities…
Taxation est. · year 1
- Rental income
- $94,572
- − Mortgage interest
- −$44,756
- − Property taxes
- −$3,437
- − Insurance
- −$4,662
- − Repairs & maintenance
- −$7,566
- − Management
- −$7,566
- − Depreciation
- −$23,244
- Taxable income
- $3,342
- Est. tax owed @ 24.0%
- −$802
- After-tax cash flow
- $15,531/yr
For passive investors: Depreciation is non-cash, so a rental often shows a tax loss while cash-flowing — sheltering income. Rental losses are passive: they offset passive income freely, and up to $25,000/yr can offset ordinary (W-2) income if you actively participate and your MAGI is under $100k (phasing out to $0 by $150k); unused losses carry forward. On sale, claimed depreciation is recaptured at up to 25%, and gains may owe capital-gains tax (a 1031 exchange can defer both). Figures are a year-1 estimate at your 24.0% rate — not tax advice; consult a CPA.
Schools (NCES district)
- District
- Glen Cove City School District
- NCES district ID
- 3612180
- Math proficiency
- 50% ▼ -5.00%
- Reading proficiency
- 55% ▲ 6.00%
- Median HH income
- $70,021
- Composite
- 46.76/100
- National rank
- #2391
- State rank
- #312 of 590 in NY
Livability — Glen Cove
- Score
- 65/100
- State rank
- #685
- US rank
- #12441
Category grades
Schools grade is shown separately in the Schools card above.
Census & demographics
- Census place
- Glen Cove, NY
- County
- Nassau County · 653,051 people
- City population
- 28,965
- Metro
- New York-Newark-Jersey City, NY-NJ-PA
- Population (ZIP)
- 28,965
- Household income
- $93,242
- Rent vs Own
- Severe rent burden
- 1667.0
Population outlook (Nassau County) Hauer SSP2
- Today (2025)
- 1,409,302 people
- By 2030
- 1,431,482 · +1.6%
- By 2040
- 1,471,607 · +4.4%
- By 2050
- 1,502,845 · +6.6%
- By 2075
- 1,575,403 · +11.8%
- By 2100
- 1,554,356 · +10.3%
Race, ethnicity, and origin ACS 2023
- Neighborhood character
- Diverse neighborhood (Simpson 0.57)
- Race & ethnicity
- White 56% Hispanic / Latino 32% Two or more races 14% Asian 5% Black 4%
- Hispanic origin (detail)
- Mexican 2% Puerto Rican 4% Dominican 3%
- Common ancestry
- Romanian 5% Scotch-Irish 2% Italian 1%
- Foreign-born
- 28% · Canada, China, Jamaica
- Languages at home
- 60% English-only · Spanish 27% Other Indo-European 9% Chinese 1%
Political lean MEDSL · Nassau
- 2024 margin
- Toss-up / Even · D 47.9% · R 52.1%
- 2008→2024 swing
- -12.6pp toward R · 2008: 8.4pp · 2024: -4.2pp
- All cycles
- 2024: R+4.2 2020: D+9.5 2016: D+5.3 2012: D+6.7 2008: D+8.4
Not yet ingested
- Civics
- —
Market trends
- HPI YoY
- ▼ -377.99%
- Current HPI
- 275.1903
- Rent YoY
- ▲ 6.43%
- Metro
- New York-Newark-Jersey City, NY-NJ-PA
- State GDP YoY
- ▲ 2.60%
- F500 in state
- 92
Industry mix (Fortune 500 HQ in NY)
| Industry | F500 HQs | Revenue |
|---|---|---|
| Financial Services | 10 | $950B |
|
||
| Consumer Goods | 9 | $162B |
|
||
| Insurance | 4 | $225B |
|
||
| Telecommunications | 2 | $144B |
|
||
| Pharmaceuticals | 2 | $112B |
|
||
| Media / Entertainment | 2 | $69B |
|
||
Price history
1 event — show timeline
- 2026-05-27 Listed $799,000 OneKey® MLS as Distributed by MLS Grid
Property tax history
+1.1%/yrLatest (2024): $3,437 · +7.8% YoY. Source: county tax records.
Cash-flow waterfall
monthlySold comps — $/sqft
last 12 mo · ≤1 miLoading sold comps…