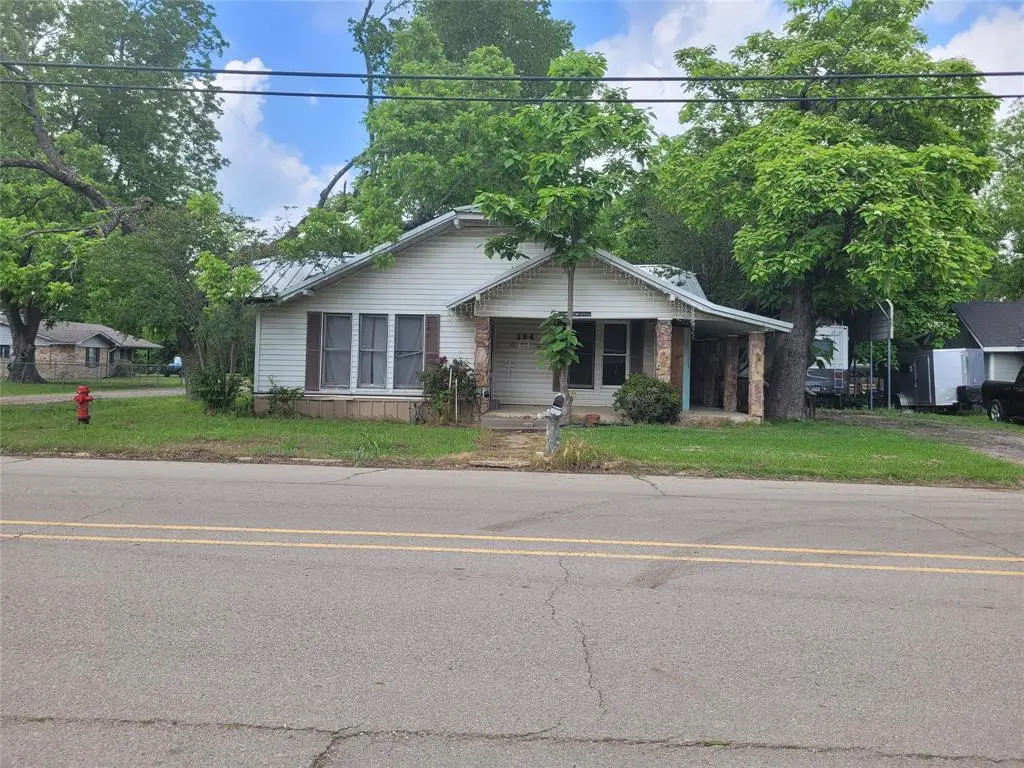
384 Monroe · Deport, TX
Flood risk No data
- FEMA flood zone
- —
- Chance of flooding over 30 yrs
- —
- Est. flood insurance / yr
- —
Fire risk No data
- Est. fire insurance / yr
- —
Heat risk No data
- Hot days now (above threshold)
- —
- Hot days in 30 yrs
- —
Wind risk No data
- Chance of severe wind over 30 yrs
- —
Air-quality risk No data
- Unhealthy air days now
- —
- Unhealthy air days in 30 yrs
- —
Risk factors via First Street. Map © Google.
Why this score? — see what drove the B+ grade
The composite is a weighted blend of 9 inputs, each scored 0–100. Each bar is that input's sub-score; the figure is the points it added to the 100-point composite (weight × sub-score).
- Cash flow +30.0/30.0
- 1% rule +10.0/10.0
- DSCR +10.0/10.0
- Appreciation +9.3/10.0
- ARV discount +7.5/15.0
- Schools +4.3/10.0
- Livability +2.6/5.0
- Rent growth +2.5/5.0
- Condition / age +2.5/5.0
$40,000
🖨 Deal sheet 📄 Offer letter ✓ Due diligence
Listing remarks
Opportunity for investors! Extra large corner lot with chain link backyard, with storage building, and several shade trees. Wrap around concrete front and side porch. Home is in need of repairs but has potential. Home is located close to Deport Elementary and not far from downtown Deport. Paris is 17 miles from Deport. Come take a look and make offer!
Key facts
- Storage building
- Chain link backyard
- 0.32 acre lot
Tags
Property features AI
Finance
- Other: Exclusions: pot belly wood stove and RV cover; Special listing conditions: Standard; Possession at closing/funding
- Financial info: Listing terms: Cash or Conventional
- HOA & community: No homeowners association
Exterior
- Parking: Driveway; On-street parking; No garage or carport spaces
- Utilities: City water; City sewer; Electricity available and connected; Cable available; Phone available; Asphalt access; Overhead utilities
- Home design: Single-family residence; Residential property; Entry and living all on one level; Property attached: Yes
- Construction: Metal roof; Frame and siding construction; Block foundation; Year built listed as preowned
- Exterior features: Covered porches (front, side, wrap-around); Covered porch(es); Chain-link fencing in back yard; Outbuilding on the property; Corner lot with few trees; Lot dimensions approximately 200' x 70'
Interior
- Kitchen: Dishwasher; Refrigerator; Breakfast bar; Built-in cabinets; Dual sinks
- Bedrooms: 3 bedrooms (all on the main level); Primary bedroom with ensuite bath
- Flooring: Carpet; Hardwood
- Bathrooms: 2 full bathrooms
- Heating & cooling: Ceiling fans; No central heating
- Interior features: Cable TV available; High-speed internet available; Accessible approach with ramp; 10 total rooms; Two living areas; One dining area; One-level layout
- Laundry & utility: Full-size washer/dryer area; Washer hookup; Electric dryer hookup; Separate utility room with space for a freezer
Neighborhood map
What this means for you Summary
Snapshot
- This is a 3-bed/1.0-bath single-family listed at $40k.
Deal economics
- At list price, monthly cash flow is $701 ($8k/yr) — positive.
- The deal already cash-flows at list — no discount required.
- Meets the 1% rule at list price ($1k rent vs $40k).
- Recommended offer: $39k (3.0% below list) — sets the bar for market timing.
Location & tenants
- Location reads 51/100 on livability (#1,482 in TX) — a working-class tenant base; expect higher turnover. Strengths: cost of living A+, health & safety A+; Watch: crime F, amenities F, commute F.
- Prairiland ISD (rural): math 52% / reading 51% proficiency, ranked #167 of 826 in TX (top 20%) — acceptable for families but not a draw, mixed tenant base, ~2y average lease.
- Zoned schools: Deport El (math 37% / reading 37%, grade F, #1,769 of 4,322 statewide, top 44%, 141 students, 77% FRL) — zoned schools average 77% FRL vs 50% district-wide (27 pts higher); higher-poverty schools than district average — tighter screening recommended.
- Zoned-school proficiency averages 37% at this address vs 52% district-wide (-14 pts) — the specific schools serving this property underperform the Prairiland ISD average; the district grade overstates school quality for this exact location.
- Market conditions: 20 active listings in the ZIP; 119 units permitted in Lamar County in 2024 (71 in 5+ unit buildings).
Forward outlook
- In year one you build about $4k of equity ($277 loan paydown + $3k appreciation (8.7% local appreciation)).
- Lamar County population projected at -13% by 2050 — secular population decline; favor cash flow + early exit over multi-decade hold.
- At projected returns (8.7% appreciation + 3.0% rent growth), your $11k cash investment doubles in ~1 year — after that, you're playing with house money.
- By year 8, paydown + projected appreciation supports a ~$31k cash-out refi (75% LTV) — recoverable capital for the next deal without selling this one.
Negotiation context
- It's been on market 41 days — a 3% lower offer ($39k) is reasonable based on typical stale-listing flexibility.
- 2 sale attempts with the ask held roughly flat each time — persistent listings suggest the price (not the market) is what's stuck; bring a comps-based counter.
Questions for the listing agent
- It's been on market 41 days. Have you received any prior offers? Is the seller open to a 3% concession, seller financing, or rate buy-down credit?
- Is there a deadline driving the sale (1031 exchange, divorce, estate, relocation)? That informs how much negotiation room exists.
- Schools are F-rated, which usually means shorter tenancies and higher turnover. Who's the typical renter profile here, and what's been the actual vacancy rate?
- Crime grade is F in this area — have there been break-ins, vandalism, or insurance claims at this property in the last 3 years? What carrier currently insures it and at what premium?
- What's the average days-on-market for RENTAL listings here right now (not sales)? A rising rental-DOM trend means longer vacancies and softer asking-rent achievability than the comps imply.
- What's the recent tenant-quality profile in this submarket — average credit score on applications, eviction rate, late-payment / NSF rate, and stable-employment percentage? A property-management company in the area should have these aggregated.
- How much new for-sale + rental construction is in the pipeline within 1–3 miles? Heavy new supply typically softens prices + rents 12–24 months out; constrained supply supports both.
Investment metrics
- 1% rule
- 3.14% ✓
- Cap rate
- 27.31%
- Cash-on-cash
- 75.06%
- DSCR
- 4.34
- GRM
- 2.7
CMA / ARV
- ARV (median comp)
- $137,353
- List price
- $40,000
- Delta
- -70.88%
- Verdict
- UNDERPRICED
- Comps
- 13 within 1.0 mi
Show comp detail 3 sales within ~0.75 mi
| Address | Dist | Beds/Ba | Sqft | Sold | Price | $/sf | Match |
|---|---|---|---|---|---|---|---|
| 303 Monroe St | 0.09mi | 3/2.0 | 1,818 (+1%) | 19mo | $34,000 | $19 | 74 |
| 193 Church St | 0.28mi | 4/2.0 (+1) | 1,851 (+3%) | 8mo | $139,900 | $76 | 67 |
| 565 Monroe St | 0.18mi | 3/2.0 | 1,552 (-14%) | 13mo | $135,000 | $87 | 54 |
Match score weights: distance 35% · size 25% · config 20% · recency 20%. Top-matched comps best support the ARV.
Projected returns pro-forma
8.69% appreciation · 3.0% rent growth · sell at horizon
- IRR
- 84.4%
- Equity multiple
- 6.62×
- Total profit
- $62,918
- Equity at exit
- $32,294
- IRR
- 79.8%
- Equity multiple
- 14.36×
- Total profit
- $149,607
- Equity at exit
- $66,012
Cash invested: $11,200 (down + closing). Projections, not guarantees.
Landlord ↔ Tenant lean methodology
- Overall (STATE)
- 87 Strongly Landlord-Friendly
- State Texas
- 87 Strongly Landlord-Friendly · R+5
- County
- — inherits STATE
- City
- — inherits STATE
ZIP-level market 75435
- Home prices YoY
- 4.4%
- Active inventory
- 20
- Price-to-rent
- 2.7×
Monthly cashflow live
- Estimated rent
- $1,255 medium interval (Pro) →
- Mortgage (P&I)
- −$210
- Tax from tax record
- −$64 /mo · $774/yr
- Insurance
- −$17
- HOA
- −$0
- Vacancy / Maint / Mgmt
- −$264
- Net cashflow
- $701
Break-even live
UW: 25.0% down · 7.5% · 30yr · 1.5% tax · 5.0% vac · 8.0% maint · 8.0% mgmt
Financing live
Cash to close
- Down payment
- $10,000
- Closing costs
- $1,200
- Reserves months
- —
- Total cash needed
- —
Loan-product check · same deal, 3 products live
Conventional
25% down · 7.5% · 30yr
- Down + closing
- —
- Monthly P&I
- —
- Monthly cashflow
- —
- DSCR
- —
- Eligible?
- —
Personal DTI + credit; lowest rate.
DSCR
20% down · 8.5% · 30yr
- Down + closing
- —
- Monthly P&I
- —
- Monthly cashflow
- —
- DSCR
- —
- Eligible?
- —
No personal income docs; deal must DSCR.
Hard money
10% down · 12.0% · 12mo
- Down + closing
- —
- Monthly P&I
- —
- Monthly cashflow
- —
- DSCR
- —
- Eligible?
- —
Short-term bridge; refi at stabilization.
Listing history 12 events
-
2026-06-15statusdays on market $40,000 Pending 41 DOM
-
2026-06-13days on market $40,000 Active 40 DOM
-
2026-06-12days on market $40,000 Active 39 DOM
-
2026-06-09days on market $40,000 Active 36 DOM
-
2026-06-08days on market $40,000 Active 35 DOM
-
2026-06-08days on market $40,000 Active 34 DOM
-
2026-06-07days on market $40,000 Active 33 DOM
-
2026-06-03days on market $40,000 Active 30 DOM
-
2026-06-02days on market $40,000 Active 29 DOM
-
2026-06-02status $40,000 Active 28 DOM
-
2026-04-27$40,000 Active 359-char remark
-
2010-03-29soldstatus
ⓘ Source: listings_history table (triggers on properties + properties_extension) + one-shot
backfill from property_details.listing_events for pre-trigger history.
Tax reassessment forecast TX · Resets to sale price
- Current annual tax
- $774 · $64/mo
- Projected year-2 tax
- $774 · $64/mo
- Expected delta
- $0/yr ($0/mo · 0.0%)
ⓘ Screening estimate from a state-policy table — verify with the county assessor before closing.
Nearby sold comps map
Loading sold comps map…
Walkable amenities ~0.75 mi
Loading nearby amenities…
Taxation est. · year 1
- Rental income
- $15,061
- − Mortgage interest
- −$2,241
- − Property taxes
- −$774
- − Insurance
- −$200
- − Repairs & maintenance
- −$1,205
- − Management
- −$1,205
- − Depreciation
- −$1,164
- Taxable income
- $8,273
- Est. tax owed @ 24.0%
- −$1,986
- After-tax cash flow
- $6,422/yr
For passive investors: Depreciation is non-cash, so a rental often shows a tax loss while cash-flowing — sheltering income. Rental losses are passive: they offset passive income freely, and up to $25,000/yr can offset ordinary (W-2) income if you actively participate and your MAGI is under $100k (phasing out to $0 by $150k); unused losses carry forward. On sale, claimed depreciation is recaptured at up to 25%, and gains may owe capital-gains tax (a 1031 exchange can defer both). Figures are a year-1 estimate at your 24.0% rate — not tax advice; consult a CPA.
Schools (NCES district)
- District
- Prairiland ISD
- NCES district ID
- 4835740
- Math proficiency
- 52% ▲ 5.00%
- Reading proficiency
- 51% ▲ 7.00%
- Median HH income
- $43,652
- Composite
- 43.44/100
- National rank
- #3010
- State rank
- #167 of 826 in TX
Livability — Deport
- Score
- 51/100
- State rank
- #1482
- US rank
- #25402
Category grades
Schools grade is shown separately in the Schools card above.
Census & demographics
- Census place
- Deport, TX
- Population (ZIP)
- 1,056
Population outlook (Lamar County) Hauer SSP2
- Today (2025)
- 48,319 people
- By 2030
- 47,160 · -2.4%
- By 2040
- 44,621 · -7.7%
- By 2050
- 42,024 · -13.0%
- By 2075
- 36,577 · -24.3%
- By 2100
- 30,580 · -36.7%
Race, ethnicity, and origin ACS 2023
- Neighborhood character
- Predominantly White (91%)
- Race & ethnicity
- White 91% Black 3% Hispanic / Latino 3% Two or more races 2%
- Common ancestry
- Lithuanian 2% Serbian 1%
- Foreign-born
- 2% · Canada
- Languages at home
- 99% English-only · Spanish 1%
Political lean MEDSL · Lamar
- 2024 margin
- Solid R (+61.0) · D 19.2% · R 80.3%
- 2008→2024 swing
- -19.1pp toward R · 2008: -42.0pp · 2024: -61.0pp
- All cycles
- 2024: R+61.0 2020: R+57.4 2016: R+59.2 2012: R+50.3 2008: R+42.0
Not yet ingested
- Civics
- —
Market trends
- HPI YoY
- ▲ 8.69%
- Current HPI
- 208.2269
- Rent YoY
- —
- Metro
- —
- State GDP YoY
- ▲ 3.95%
- F500 in state
- 110
Industry mix (Fortune 500 HQ in TX)
| Industry | F500 HQs | Revenue |
|---|---|---|
| Energy | 16 | $1,198B |
|
||
| Technology | 5 | $198B |
|
||
| Engineering / Construction | 4 | $72B |
|
||
| Energy Services | 3 | $60B |
|
||
| Utilities | 3 | $41B |
|
||
| Healthcare | 2 | $330B |
|
||
Price history
5 events — show timeline
- 2026-06-15 Pending — NTREIS
- 2026-06-01 Relisted — NTREIS
- 2026-05-27 Pending — NTREIS
- 2026-04-27 Listed $40,000 NTREIS
- 2010-03-29 Sold (Public Records) — Public Records
Property tax history
-2.9%/yrLatest (2025): $774 · -65.8% YoY. Source: county tax records.
Cash-flow waterfall
monthlySold comps — $/sqft
last 12 mo · ≤1 miLoading sold comps…