 🏗️ New Construction
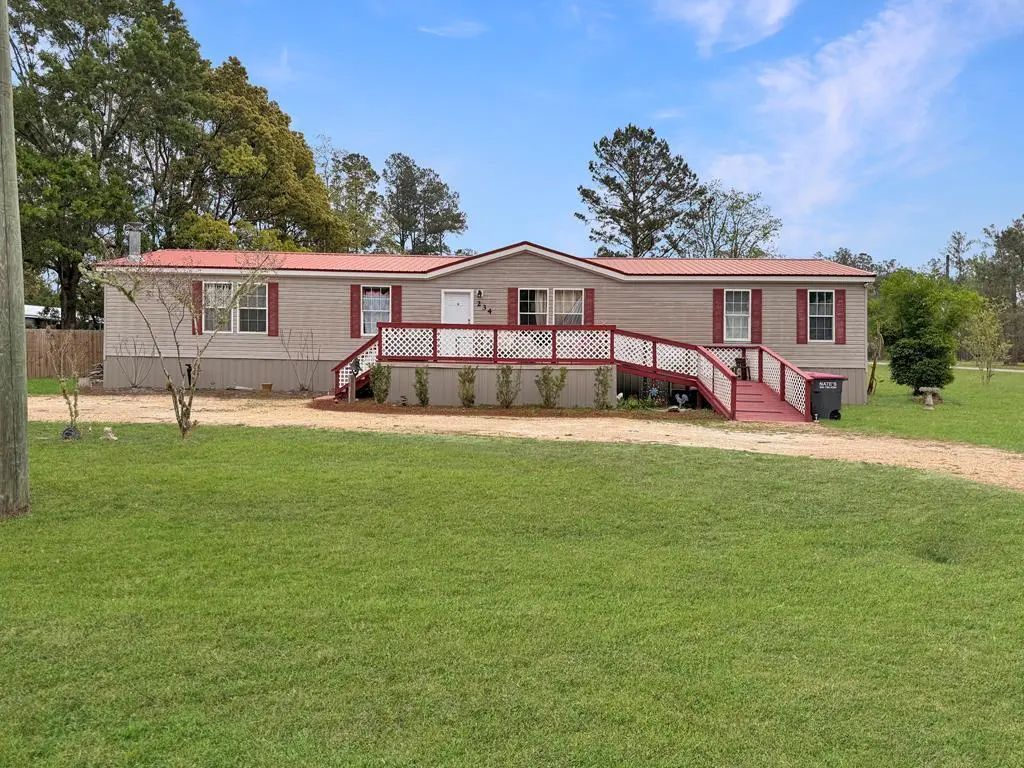
234 Sesame St · Wewahitchka, FL
Flood risk 1/10 · Minimal
- FEMA flood zone
- X (unshaded)
- Chance of flooding over 30 yrs
- 0.0%
- Est. flood insurance / yr
- $507 – $1,088
Fire risk 4/10 · Minor
- Est. fire insurance / yr
- $947 – $1,759
Heat risk 9/10 · Severe
- Hot days now (above 106°F)
- 7 days/yr
- Hot days in 30 yrs
- 20 days/yr
Wind risk 9/10 · Severe
- Chance of severe wind over 30 yrs
- 99.0%
Air-quality risk 1/10 · Minimal
- Unhealthy air days now
- 0 days/yr
- Unhealthy air days in 30 yrs
- 0 days/yr
Risk factors via First Street. Map © Google.
Why this score? — see what drove the D grade
The composite is a weighted blend of 9 inputs, each scored 0–100. Each bar is that input's sub-score; the figure is the points it added to the 100-point composite (weight × sub-score).
- Appreciation +10.0/10.0
- ARV discount +7.5/15.0
- Cash flow +7.3/30.0
- Schools +3.9/10.0
- Livability +3.6/5.0
- Rent growth +2.5/5.0
- Condition / age +2.5/5.0
- 1% rule +1.8/10.0
- DSCR +1.5/10.0
$210,000
🖨 Deal sheet 📄 Offer letter ✓ Due diligence
Listing remarks MLS
HIGH AND DRY - X FLOOD ZONE!!! Price to sell nearly one acre lot inside City limits. Grab your fishing poles and enjoy the laid back atmosphere of Wewahitchka! Public utilities available, property will accommodate mobile homes and custom builds. (RV with City approval) Make this spot your full time residence or weekend get-a-way. Also available as individual parcels, see MLS 260458,260459,260460.
Key facts
- Split floor plan
- Formal dining area
- Updated kitchen
Tags
Property features AI
Exterior
- Parking: Circular driveway; 6 parking spaces
- Utilities: Public water; Public sewer; Electricity connected; Water connected; Cable available; Phone available; Sewer available
- Home design: Residential manufactured home; New construction
- Construction: Vinyl siding; Metal roof
- Exterior features: Deck; Partial backyard fencing; Corner lot; City street frontage
Interior
- Kitchen: Dishwasher; Microwave; Refrigerator
- Flooring: Carpet; Vinyl
- Bathrooms: 2 full bathrooms
- Heating & cooling: Central heating (electric); Central air conditioning
- Interior features: Kitchen island; Walk-in closet(s); Fireplace
Neighborhood map
What this means for you Summary
Snapshot
- This is a 3-bed/2.0-bath manufactured listed at $210k.
Deal economics
- At list price, monthly cash flow is $-278 ($-3k/yr) — negative.
- To cash-flow at today's rent, offer at most $161k (23.4% below list).
- To meet the 1% rule (rent ≥ 1% of price), the offer needs to be $143k (31.7% below list).
- Recommended offer: $143k (31.7% below list) — sets the bar for 1% rule.
- Cap rate 4.7% vs local median 3.5% in Wewahitchka — top-decile yield for the area; either an underpriced asset or a hidden risk that comps aren't pricing in. Stress-test before assuming the spread holds.
Location & tenants
- Location reads 71/100 on livability (#386 in FL) — a middle-class / working-renter tenant base. Strengths: crime A+, cost of living A+, housing A+; Watch: schools D-, amenities F, commute F.
- Gulf (rural): math 47% / reading 45% proficiency, ranked #49 of 73 in FL (top 67%) — families likely to look elsewhere, expect single-tenant / working-renter base with shorter leases.
- Market conditions: 167 active listings in the ZIP; 302 units permitted in Gulf County in 2024 (0 in 5+ unit buildings).
Forward outlook
- In year one you build about $22k of equity ($1k loan paydown + $21k appreciation (10.0% local appreciation)).
- Gulf County population projected to shrink 4% by 2050 — rents likely to lag national; underwrite the cash flow, not the appreciation.
- By year 2, paydown + projected appreciation supports a ~$36k cash-out refi (75% LTV) — recoverable capital for the next deal without selling this one.
Negotiation context
- It's been on market 84 days — a 6% lower offer ($197k) is reasonable based on typical stale-listing flexibility.
- 2 sale attempts since 9y ago with the ask held roughly flat each time — persistent listings suggest the price (not the market) is what's stuck; bring a comps-based counter.
- Current owner paid $13k; list at $210k implies a 1515% gain — meaningful room to come down on a strong offer.
Risks & watch-outs
- Climate carrying-cost: severe wind risk, 99% chance of damaging wind over 30y; extreme-heat days projected 7→20/yr by 2055 (HVAC capex compounding) — expect insurance premiums to compound above CPI over the hold.
Questions for the listing agent
- What do current leases actually rent for vs. the listed asking? Can we see a recent rent roll and the last 12 months of T-12 income?
- It's been on market 84 days. Have you received any prior offers? Is the seller open to a 32% concession, seller financing, or rate buy-down credit?
- Why hasn't it sold? Are there any deal-killer items the seller is aware of (foundation, flood, title, zoning, code violations)?
- Is there a deadline driving the sale (1031 exchange, divorce, estate, relocation)? That informs how much negotiation room exists.
- Schools are D-rated, which usually means shorter tenancies and higher turnover. Who's the typical renter profile here, and what's been the actual vacancy rate?
- The area grade is low — what's the realistic commute time and amenity access for the typical tenant pool here? Any planned neighborhood developments (good or bad) we should know about?
- What's the average days-on-market for RENTAL listings here right now (not sales)? A rising rental-DOM trend means longer vacancies and softer asking-rent achievability than the comps imply.
- What's the recent tenant-quality profile in this submarket — average credit score on applications, eviction rate, late-payment / NSF rate, and stable-employment percentage? A property-management company in the area should have these aggregated.
- How much new for-sale + rental construction is in the pipeline within 1–3 miles? Heavy new supply typically softens prices + rents 12–24 months out; constrained supply supports both.
Investment metrics
- 1% rule
- 0.68% ✗
- Cap rate
- 4.70%
- Cash-on-cash
- -5.68%
- DSCR
- 0.75
- GRM
- 12.2
CMA / ARV
No comps found within radius.
Projected returns pro-forma
10.0% appreciation · 3.0% rent growth · sell at horizon
- IRR
- 20.3%
- Equity multiple
- 2.64×
- Total profit
- $96,652
- Equity at exit
- $189,185
- IRR
- 18.5%
- Equity multiple
- 6.08×
- Total profit
- $298,550
- Equity at exit
- $407,984
Cash invested: $58,800 (down + closing). Projections, not guarantees.
Landlord ↔ Tenant lean methodology
- Overall (STATE)
- 87 Strongly Landlord-Friendly
- State Florida
- 87 Strongly Landlord-Friendly · R+3
- County
- — inherits STATE
- City
- — inherits STATE
ZIP-level market 32465
- Home prices YoY
- 25.5%
- Active inventory
- 167
- Price-to-rent
- 12.2×
Monthly cashflow live
- Estimated rent
- $1,434 medium interval (Pro) →
- Mortgage (P&I)
- −$1,101
- Tax from tax record
- −$222 /mo · $2,664/yr
- Insurance
- −$88
- HOA
- −$0
- Vacancy / Maint / Mgmt
- −$301
- Net cashflow
- $-278
Break-even live
UW: 25.0% down · 7.5% · 30yr · 1.5% tax · 5.0% vac · 8.0% maint · 8.0% mgmt
Financing live
Cash to close
- Down payment
- $52,500
- Closing costs
- $6,300
- Reserves months
- —
- Total cash needed
- —
Loan-product check · same deal, 3 products live
Conventional
25% down · 7.5% · 30yr
- Down + closing
- —
- Monthly P&I
- —
- Monthly cashflow
- —
- DSCR
- —
- Eligible?
- —
Personal DTI + credit; lowest rate.
DSCR
20% down · 8.5% · 30yr
- Down + closing
- —
- Monthly P&I
- —
- Monthly cashflow
- —
- DSCR
- —
- Eligible?
- —
No personal income docs; deal must DSCR.
Hard money
10% down · 12.0% · 12mo
- Down + closing
- —
- Monthly P&I
- —
- Monthly cashflow
- —
- DSCR
- —
- Eligible?
- —
Short-term bridge; refi at stabilization.
Listing history 20 events
-
2026-06-19days on market $210,000 Active 84 DOM
-
2026-06-18days on market $210,000 Active 83 DOM
-
2026-06-17days on market $210,000 Active 82 DOM
-
2026-06-16days on market $210,000 Active 81 DOM
-
2026-06-15days on market $210,000 Active 80 DOM
-
2026-06-14days on market $210,000 Active 78 DOM
-
2026-06-13days on market $210,000 Active 77 DOM
-
2026-06-10days on market $210,000 Active 75 DOM
-
2026-06-09days on market $210,000 Active 74 DOM
-
2026-06-08days on market $210,000 Active 73 DOM
-
2026-06-07days on market $210,000 Active 72 DOM
-
2026-06-05days on market $210,000 Active 69 DOM
-
2026-06-02days on market $210,000 Active 67 DOM
-
2026-06-01days on market $210,000 Active 66 DOM
-
2026-05-31days on market $210,000 Active 65 DOM
-
2026-05-30days on market $210,000 Active 64 DOM
-
2026-03-27$210,000 Active
-
2025-05-01price $210,000
-
2018-01-23soldstatus $13,000 401-char remark
Show marketing remark (401 chars)
HIGH AND DRY - X FLOOD ZONE!!! Price to sell nearly one acre lot inside City limits. Grab your fishing poles and enjoy the laid back atmosphere of Wewahitchka! Public utilities available, property will accommodate mobile homes and custom builds. (RV with City approval) Make this spot your full time residence or weekend get-a-way. Also available as individual parcels, see MLS 260458,260459,260460.
-
2017-10-25$16,000 401-char remark
Show marketing remark (401 chars)
HIGH AND DRY - X FLOOD ZONE!!! Price to sell nearly one acre lot inside City limits. Grab your fishing poles and enjoy the laid back atmosphere of Wewahitchka! Public utilities available, property will accommodate mobile homes and custom builds. (RV with City approval) Make this spot your full time residence or weekend get-a-way. Also available as individual parcels, see MLS 260458,260459,260460.
ⓘ Source: listings_history table (triggers on properties + properties_extension) + one-shot
backfill from property_details.listing_events for pre-trigger history.
Tax reassessment forecast FL · Resets to sale price
- Current annual tax
- $2,664 · $222/mo
- Projected year-2 tax
- $2,664 · $222/mo
- Expected delta
- $0/yr ($0/mo · 0.0%)
ⓘ Screening estimate from a state-policy table — verify with the county assessor before closing.
Climate risk First Street
- Flood 1/10 Low FEMA zone X (unshaded) · 0% chance over 30 yrs
- Wildfire 4/10 Moderate
- Heat 9/10 Extreme 7 d/yr ≥106°F today · 20 d/yr by 30 yrs out
- Wind 9/10 Extreme 99% chance of damaging wind over 30 yrs
- Air quality 1/10 Low 0 unhealthy d/yr today · 0 by 30 yrs out
Nearby sold comps map
Loading sold comps map…
Walkable amenities ~0.75 mi
Loading nearby amenities…
Taxation est. · year 1
- Rental income
- $17,203
- − Mortgage interest
- −$11,763
- − Property taxes
- −$2,664
- − Insurance
- −$1,050
- − Repairs & maintenance
- −$1,376
- − Management
- −$1,376
- − Depreciation
- −$6,109
- Taxable loss
- −$7,135
- Est. tax savings @ 24.0%
- +$1,712
- After-tax cash flow
- $-1,626/yr
For passive investors: Depreciation is non-cash, so a rental often shows a tax loss while cash-flowing — sheltering income. Rental losses are passive: they offset passive income freely, and up to $25,000/yr can offset ordinary (W-2) income if you actively participate and your MAGI is under $100k (phasing out to $0 by $150k); unused losses carry forward. On sale, claimed depreciation is recaptured at up to 25%, and gains may owe capital-gains tax (a 1031 exchange can defer both). Figures are a year-1 estimate at your 24.0% rate — not tax advice; consult a CPA.
Schools (NCES district)
- District
- Gulf
- NCES district ID
- 1200690
- Math proficiency
- 47% ▼ -5.00%
- Reading proficiency
- 45% ▼ -5.00%
- Median HH income
- $41,047
- Composite
- 38.63/100
- National rank
- #4154
- State rank
- #49 of 73 in FL
Livability — Wewahitchka
- Score
- 71/100
- State rank
- #386
- US rank
- #6847
Category grades
Schools grade is shown separately in the Schools card above.
Census & demographics
- Census place
- Wewahitchka, FL
- Population (ZIP)
- 7,940
Population outlook (Gulf County) Hauer SSP2
- Today (2025)
- 15,677 people
- By 2030
- 15,538 · -0.9%
- By 2040
- 15,386 · -1.9%
- By 2050
- 15,043 · -4.0%
- By 2075
- 13,793 · -12.0%
- By 2100
- 10,793 · -31.2%
Race, ethnicity, and origin ACS 2023
- Neighborhood character
- Predominantly White (69%)
- Race & ethnicity
- White 69% Black 21% Hispanic / Latino 6% Two or more races 5% Native American 1%
- Hispanic origin (detail)
- Mexican 2% Puerto Rican 1% Cuban 1%
- Common ancestry
- Lithuanian 2% Hispanic 1% Italian 1%
- Foreign-born
- 3% · Canada
- Languages at home
- 92% English-only · Spanish 6% French/Haitian/Cajun 1%
Political lean MEDSL · Gulf
- 2024 margin
- Solid R (+54.2) · D 22.6% · R 76.8%
- 2008→2024 swing
- -14.9pp toward R · 2008: -39.3pp · 2024: -54.2pp
- All cycles
- 2024: R+54.2 2020: R+50.6 2016: R+49.5 2012: R+42.0 2008: R+39.3
Not yet ingested
- Civics
- —
Market trends
- HPI YoY
- ▲ 85.74%
- Current HPI
- 421.7879
- Rent YoY
- —
- Metro
- —
- State GDP YoY
- ▲ 3.28%
- F500 in state
- 36
Industry mix (Fortune 500 HQ in FL)
| Industry | F500 HQs | Revenue |
|---|---|---|
| Industrial Technology | 2 | $29B |
|
||
| Insurance | 2 | $17B |
|
||
| Retail | 1 | $60B |
|
||
| Technology Distribution | 1 | $58B |
|
||
| Homebuilding | 1 | $35B |
|
||
| Technology Manufacturing | 1 | $35B |
|
||
Price history
+1212.5% since first listed4 events — show timeline
- 2026-03-27 Listed $210,000 RAFGC
- 2025-05-01 Price Changed $210,000 RAFGC
- 2018-01-23 Sold (MLS) $13,000 RAFGC
- 2017-10-25 Listed $16,000 RAFGC
Property tax history
+15.4%/yrLatest (2025): $2,664 · +473.3% YoY. Source: county tax records.
Cash-flow waterfall
monthlySold comps — $/sqft
last 12 mo · ≤1 miLoading sold comps…