305 Water Ave S · St. Hilaire, MN
Flood risk No data
- FEMA flood zone
- —
- Chance of flooding over 30 yrs
- —
- Est. flood insurance / yr
- —
Fire risk No data
- Est. fire insurance / yr
- —
Heat risk No data
- Hot days now (above threshold)
- —
- Hot days in 30 yrs
- —
Wind risk No data
- Chance of severe wind over 30 yrs
- —
Air-quality risk No data
- Unhealthy air days now
- —
- Unhealthy air days in 30 yrs
- —
Risk factors via First Street. Map © Google.
Why this score? — see what drove the D grade
The composite is a weighted blend of 9 inputs, each scored 0–100. Each bar is that input's sub-score; the figure is the points it added to the 100-point composite (weight × sub-score).
- Cash flow +11.6/30.0
- ARV discount +7.5/15.0
- Appreciation +5.0/10.0
- Schools +3.7/10.0
- DSCR +3.4/10.0
- 1% rule +2.8/10.0
- Rent growth +2.5/5.0
- Livability +2.5/5.0
- Condition / age +2.5/5.0
$174,900
🖨 Deal sheet (PDF) 📄 Offer letter ✓ Due diligence
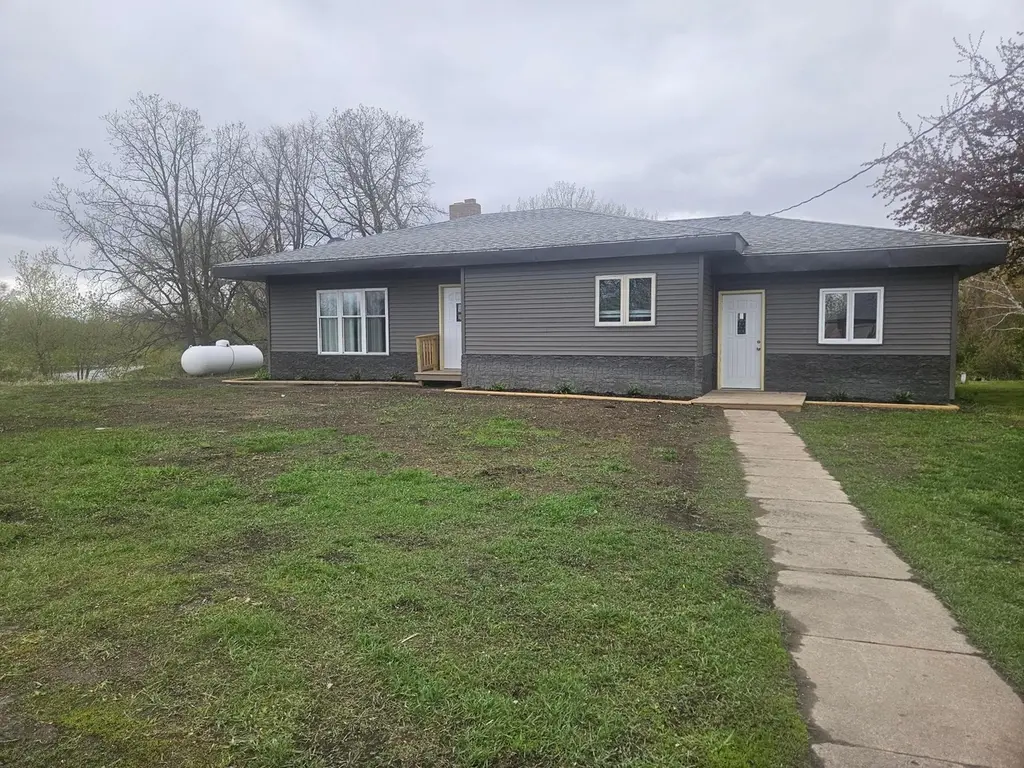
Listing remarks
Nicely rejuvenated home located on 2.6 acres on the river in St. Hilaire. The family room has been used as a bedroom but can easily become a family room again. There are two other bedrooms plus a nice sized living room. Call for your showing today as you don't find homes like this on the river very often.
Key facts
- On the river
- 2.6 acres
- 2.6 acre lot
Tags
Property features AI
Finance
- Other: Lot size approximately 2.6 acres; Private and public maintained road access
Exterior
- Parking: Gravel parking; 3-car detached garage
- Utilities: Drilled private water well; Mound septic system; Electric service with circuit breakers; Fuel: Electric and propane
- Home design: Residential property; One story
- Construction: Asphalt roof; Block and wood foundation; Built with vinyl exterior
- Exterior features: Vinyl siding; Riverfront property (no road between home and water); Chicken coop/barn on the property
Interior
- Kitchen: Range; Dishwasher; Refrigerator
- Bedrooms: 3 bedrooms on the main level
- Bathrooms: One full bathroom on the main level; One half bathroom on the main level
- Heating & cooling: Forced air heating; Central air conditioning
- Interior features: Wood-burning fireplace in the living room; Full basement
- Laundry & utility: Washer and dryer; Laundry located in the basement
Neighborhood map
What this means for you Summary
Snapshot
- This is a 3-bed/2.0-bath single-family listed at $175k.
Deal economics
- At list price, monthly cash flow is $-54 ($-646/yr) — negative.
- To cash-flow at today's rent, offer at most $165k (5.4% below list).
- To meet the 1% rule (rent ≥ 1% of price), the offer needs to be $137k (21.9% below list).
- Recommended offer: $137k (21.9% below list) — sets the bar for 1% rule.
Location & tenants
- Location reads: area grade D — affects rentability + tenant quality, not the cash-flow math above.
- Thief River Falls School District (town): math 39% / reading 47% proficiency, ranked #201 of 301 in MN (top 67%) — families likely to look elsewhere, expect single-tenant / working-renter base with shorter leases.
- Market conditions: 2 active listings in the ZIP; 11 units permitted in Pennington County in 2024 (0 in 5+ unit buildings).
Forward outlook
- In year one you build about $6k of equity ($1k loan paydown + $5k appreciation (3.0% local appreciation)).
- Pennington County population projected at +5% by 2050 — modest demand growth; plan on rents tracking national, not racing it.
- At projected returns (3.0% appreciation + 3.0% rent growth), your $49k cash investment doubles in ~7 years — after that, you're playing with house money.
- By year 6, paydown + projected appreciation supports a ~$34k cash-out refi (75% LTV) — recoverable capital for the next deal without selling this one.
Negotiation context
- It's been on market 32 days — a 3% lower offer ($170k) is reasonable based on typical stale-listing flexibility.
Risks & watch-outs
- Watch-outs: built in 1948 — expect roof / HVAC / electrical / plumbing capex.
Questions for the listing agent
- What do current leases actually rent for vs. the listed asking? Can we see a recent rent roll and the last 12 months of T-12 income?
- It's been on market 32 days. Have you received any prior offers? Is the seller open to a 22% concession, seller financing, or rate buy-down credit?
- Built in 1948 — when were the roof, HVAC, electrical panel, plumbing, and water heater last replaced?
- Is there a deadline driving the sale (1031 exchange, divorce, estate, relocation)? That informs how much negotiation room exists.
- The area grade is low — what's the realistic commute time and amenity access for the typical tenant pool here? Any planned neighborhood developments (good or bad) we should know about?
- What's the average days-on-market for RENTAL listings here right now (not sales)? A rising rental-DOM trend means longer vacancies and softer asking-rent achievability than the comps imply.
- What's the recent tenant-quality profile in this submarket — average credit score on applications, eviction rate, late-payment / NSF rate, and stable-employment percentage? A property-management company in the area should have these aggregated.
- How much new for-sale + rental construction is in the pipeline within 1–3 miles? Heavy new supply typically softens prices + rents 12–24 months out; constrained supply supports both.
Investment metrics
- 1% rule
- 0.78% ✗
- Cap rate
- 5.92%
- Cash-on-cash
- -1.32%
- DSCR
- 0.94
- GRM
- 10.7
CMA / ARV
No comps found within radius.
Projected returns pro-forma
3.0% appreciation · 3.0% rent growth · sell at horizon
- IRR
- 6.3%
- Equity multiple
- 1.36×
- Total profit
- $17,614
- Equity at exit
- $78,643
- IRR
- 9.1%
- Equity multiple
- 2.38×
- Total profit
- $67,502
- Equity at exit
- $121,198
Cash invested: $48,972 (down + closing). Projections, not guarantees.
Landlord ↔ Tenant lean methodology
- Overall (STATE)
- 46 Balanced
- State Minnesota
- 46 Balanced · D+2
- County
- — inherits STATE
- City
- — inherits STATE
ZIP-level market 56754
- Active inventory
- 2
- Price-to-rent
- 10.7×
Monthly cashflow live
- Estimated rent
- $1,365 medium interval (Pro) →
- Mortgage (P&I)
- −$917
- Tax from tax record
- −$142 /mo · $1,710/yr
- Insurance
- −$73
- HOA
- −$0
- Vacancy / Maint / Mgmt
- −$287
- Net cashflow
- $-54
Break-even live
Sensitivity live
| Price | -10% $45 | -5% $-4 | +0% $-54 | +5% $-103 | +10% $-153 |
|---|---|---|---|---|---|
| Rent | -10% $-162 | -5% $-108 | +0% $-54 | +5% $0 | +10% $54 |
| Rate | -1.0pp $34 | -0.5pp $-9 | base $-54 | +0.5pp $-99 | +1.0pp $-145 |
UW: 25.0% down · 7.5% · 30yr · 1.5% tax · 5.0% vac · 8.0% maint · 8.0% mgmt
Financing live
Cash to close
- Down payment
- $43,725
- Closing costs
- $5,247
- Reserves months
- —
- Total cash needed
- —
Loan-product check · same deal, 3 products live
Conventional
25% down · 7.5% · 30yr
- Down + closing
- —
- Monthly P&I
- —
- Monthly cashflow
- —
- DSCR
- —
- Eligible?
- —
Personal DTI + credit; lowest rate.
DSCR
20% down · 8.5% · 30yr
- Down + closing
- —
- Monthly P&I
- —
- Monthly cashflow
- —
- DSCR
- —
- Eligible?
- —
No personal income docs; deal must DSCR.
Hard money
10% down · 12.0% · 12mo
- Down + closing
- —
- Monthly P&I
- —
- Monthly cashflow
- —
- DSCR
- —
- Eligible?
- —
Short-term bridge; refi at stabilization.
Listing history 17 events
-
2026-06-21days on market $174,900 Active 32 DOM
-
2026-06-18days on market $174,900 Active 30 DOM
-
2026-06-17days on market $174,900 Active 29 DOM
-
2026-06-16days on market $174,900 Active 28 DOM
-
2026-06-15days on market $174,900 Active 27 DOM
-
2026-06-13days on market $174,900 Active 25 DOM
-
2026-06-12days on market $174,900 Active 24 DOM
-
2026-06-09days on market $174,900 Active 21 DOM
-
2026-06-08days on market $174,900 Active 20 DOM
-
2026-06-07days on market $174,900 Active 19 DOM
-
2026-06-07days on market $174,900 Active 18 DOM
-
2026-06-04days on market $174,900 Active 15 DOM
-
2026-06-02days on market $174,900 Active 14 DOM
-
2026-06-01days on market $174,900 Active 13 DOM
-
2026-05-31days on market $174,900 Active 12 DOM
-
2026-05-31days on market $174,900 Active 11 DOM
-
2026-05-19$174,900 Active
ⓘ Source: listings_history table (triggers on properties + properties_extension) + one-shot
backfill from property_details.listing_events for pre-trigger history.
Tax reassessment forecast MN · Partial reset (capped growth)
- Current annual tax
- $1,710 · $142/mo
- Projected year-2 tax
- $1,834 · $153/mo
- Expected delta
- +$124/yr (+$10/mo · 7.3%)
ⓘ Screening estimate from a state-policy table — verify with the county assessor before closing.
Nearby sold comps map
Loading sold comps map…
Walkable amenities ~0.75 mi
Loading nearby amenities…
Taxation est. · year 1
- Rental income
- $16,386
- − Mortgage interest
- −$9,797
- − Property taxes
- −$1,710
- − Insurance
- −$874
- − Repairs & maintenance
- −$1,311
- − Management
- −$1,311
- − Depreciation
- −$5,088
- Taxable loss
- −$3,705
- Est. tax savings @ 24.0%
- +$889
- After-tax cash flow
- $243/yr
For passive investors: Depreciation is non-cash, so a rental often shows a tax loss while cash-flowing — sheltering income. Rental losses are passive: they offset passive income freely, and up to $25,000/yr can offset ordinary (W-2) income if you actively participate and your MAGI is under $100k (phasing out to $0 by $150k); unused losses carry forward. On sale, claimed depreciation is recaptured at up to 25%, and gains may owe capital-gains tax (a 1031 exchange can defer both). Figures are a year-1 estimate at your 24.0% rate — not tax advice; consult a CPA.
Schools (NCES district)
- District
- Thief River Falls School District
- NCES district ID
- 2738850
- Math proficiency
- 39% ▼ -19.00%
- Reading proficiency
- 47% ▼ -13.00%
- Median HH income
- $49,239
- Composite
- 36.88/100
- National rank
- #4547
- State rank
- #201 of 301 in MN
Livability — St. Hilaire
No livability data for this city. (Only ~50 U.S. cities are tracked.)
Census & demographics
- Census place
- St. Hilaire, MN
- Population (ZIP)
- 495
Population outlook (Pennington County) Hauer SSP2
- Today (2025)
- 14,800 people
- By 2030
- 15,030 · +1.6%
- By 2040
- 15,402 · +4.1%
- By 2050
- 15,601 · +5.4%
- By 2075
- 15,659 · +5.8%
- By 2100
- 14,231 · -3.8%
Race, ethnicity, and origin ACS 2023
- Neighborhood character
- Predominantly White (90%)
- Race & ethnicity
- White 90% Two or more races 8% Hispanic / Latino 4%
- Common ancestry
- Portuguese 27% Lithuanian 16% Romanian 3%
- Foreign-born
- 4% · Canada, Guatemala
- Languages at home
- 95% English-only · Spanish 2% German/W. Germanic 2% French/Haitian/Cajun 1%
Political lean MEDSL · Pennington
- 2024 margin
- Solid R (+31.5) · D 33.1% · R 64.6% · Other 2.3%
- 2008→2024 swing
- -33.6pp toward R · 2008: 2.1pp · 2024: -31.5pp
- All cycles
- 2024: R+31.5 2020: R+27.0 2016: R+27.8 2012: R+4.3 2008: D+2.1
Not yet ingested
- Civics
- —
Market trends
- HPI YoY
- —
- Current HPI
- —
- Rent YoY
- —
- Metro
- —
- State GDP YoY
- ▲ 2.41%
- F500 in state
- 34
Industry mix (Fortune 500 HQ in MN)
| Industry | F500 HQs | Revenue |
|---|---|---|
| Healthcare | 2 | $407B |
|
||
| Retail | 2 | $150B |
|
||
| Consumer Goods | 2 | $32B |
|
||
| Industrial Machinery | 2 | $6B |
|
||
| Agriculture | 1 | $40B |
|
||
| Healthcare / Medical Devices | 1 | $32B |
|
||
Price history
1 event — show timeline
- 2026-05-19 Listed $174,900 NORTHSTARMLS as Distributed by MLS Grid
Property tax history
+7.9%/yrLatest (2025): $1,710 · +8.9% YoY. Source: county tax records.
Cash-flow waterfall
monthlySold comps — $/sqft
last 12 mo · ≤1 miLoading sold comps…