4301 Sunset St · Amarillo, TX
Flood risk No data
- FEMA flood zone
- —
- Chance of flooding over 30 yrs
- —
- Est. flood insurance / yr
- —
Fire risk No data
- Est. fire insurance / yr
- —
Heat risk No data
- Hot days now (above threshold)
- —
- Hot days in 30 yrs
- —
Wind risk No data
- Chance of severe wind over 30 yrs
- —
Air-quality risk No data
- Unhealthy air days now
- —
- Unhealthy air days in 30 yrs
- —
Risk factors via First Street. Map © Google.
Why this score? — see what drove the D+ grade
The composite is a weighted blend of 9 inputs, each scored 0–100. Each bar is that input's sub-score; the figure is the points it added to the 100-point composite (weight × sub-score).
- Cash flow +16.1/30.0
- ARV discount +7.5/15.0
- DSCR +5.0/10.0
- Schools +5.0/10.0
- 1% rule +4.4/10.0
- Condition / age +4.0/5.0
- Rent growth +3.9/5.0
- Livability +3.3/5.0
- Appreciation +0.0/10.0
$239,950
🖨 Deal sheet 📄 Offer letter ✓ Due diligence
Listing remarks
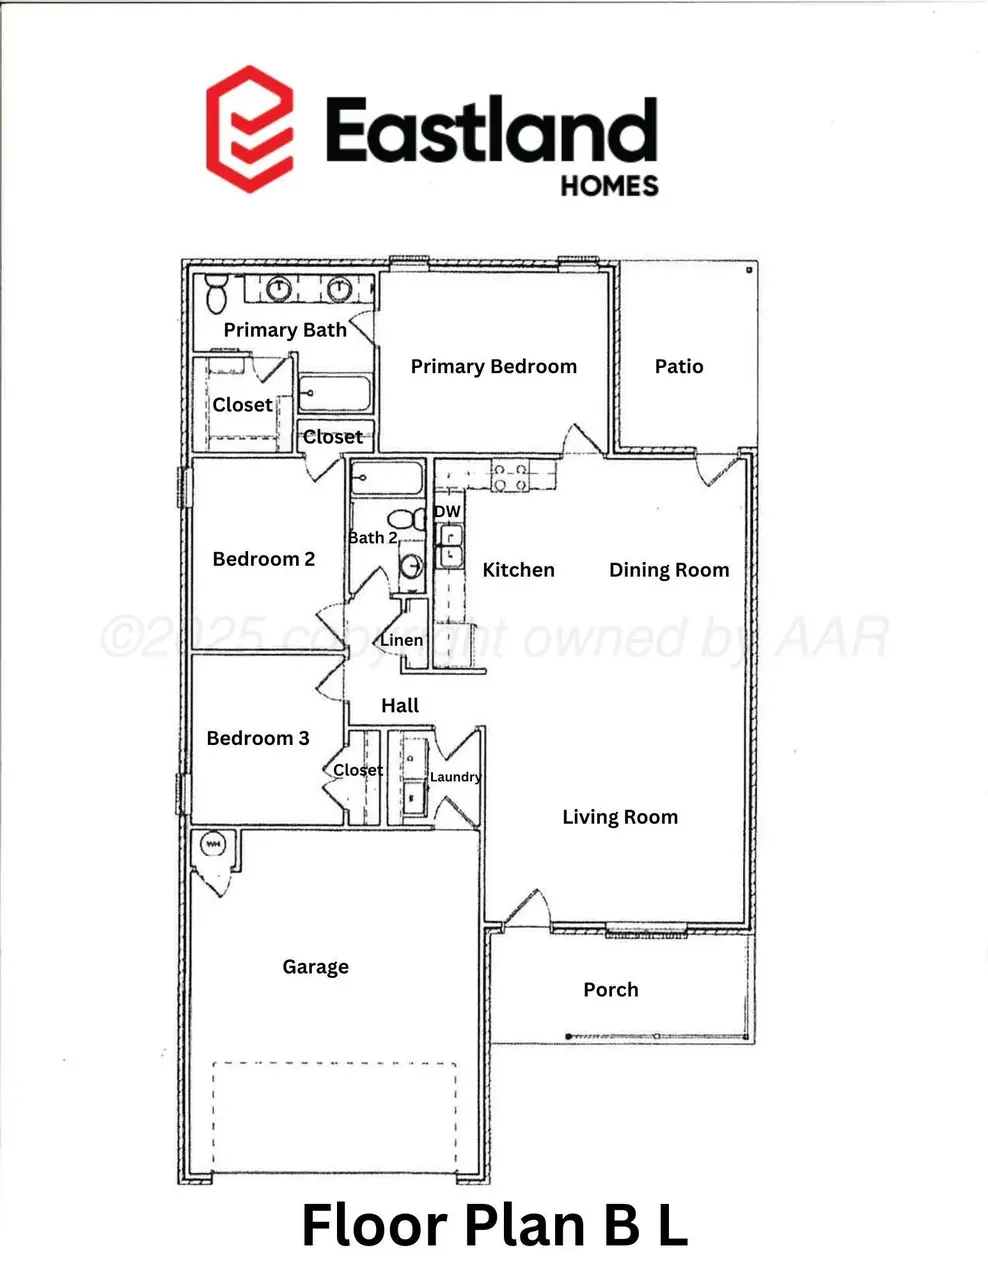
Eastland Homes' new construction is nestled in the charming neighborhood of Beacon Pointe within the Canyon Independent School District. This stylish home offers 3 bedrooms, 2 bathrooms, and a 2-car garage. The kitchen, featuring granite countertops. The open floor plan maximizes space and comfort, creating a welcoming living environment. With a sprinkler system and sod in the front and backyard, this home also boasts excellent curb appeal in this newer subdivision.
Key facts
- Open floor plan
- New construction
- Granite countertops
Tags
Property features AI
Finance
- Other: Zoning: 0400 - SE Amarillo in City Limits
- HOA & community: Homeowners association with $40 annual fee
Exterior
- Parking: Attached garage with 2 spaces; Garage faces front; Garage door opener
- Utilities: Public water; Public sewer
- Home design: Single-family residence; One story; Residential property; New construction
- Construction: Brick and frame construction; Composition roof; Slab foundation; Built recently (new construction)
- Exterior features: Wood fencing; North-facing
Interior
- Kitchen: Dishwasher; Range; Microwave; Garbage disposal
- Bathrooms: 2 full bathrooms
- Heating & cooling: Central electric heating; Central air conditioning; Ceiling fans
- Interior features: Disposal; Dishwasher; Range; Microwave; Electric water heater
- Laundry & utility: Electric water heater
Neighborhood map
What this means for you Summary
Snapshot
- This is a 3-bed/2.0-bath single-family listed at $240k. Condition is rated good.
Deal economics
- At list price, monthly cash flow is $123 ($1k/yr) — positive.
- The deal already cash-flows at list — no discount required.
- To meet the 1% rule (rent ≥ 1% of price), the offer needs to be $226k (5.9% below list).
- Recommended offer: $226k (5.9% below list) — sets the bar for 1% rule.
Location & tenants
- Location reads 66/100 on livability (#624 in TX) — a middle-class / working-renter tenant base. Strengths: cost of living A+, housing A+; Watch: amenities C-, crime F, commute F.
- Canyon ISD (town): math 60% / reading 54% proficiency, ranked #78 of 826 in TX (top 9%) — acceptable for families but not a draw, mixed tenant base, ~2y average lease.
- Zoned schools: Sundown Lane El (math 52% / reading 47%, grade D, #865 of 4,322 statewide, top 21%, 341 students, 52% FRL); Randall H S (math 43% / reading 64%, grade C-, #428 of 1,632 statewide, top 27%, 1,148 students, 35% FRL).
- Market conditions: Rents rising fast (+5.5%/yr); 276 active listings in the ZIP; 2 comparable units currently listed for rent nearby; solid renter incomes; 45 units permitted in Randall County in 2024 (0 in 5+ unit buildings).
- This rent runs 31% of the median local income ($88k/yr) — at the standard rent-burdened threshold; future hikes will face affordability resistance.
Forward outlook
- Local home prices are declining (-3.0%/yr); year-one equity from $2k of loan paydown is wiped out by about $7k of value loss. Plan a longer hold.
- Randall County population projected at +36% by 2050 — long-run rental-demand tailwind backs the buy-and-hold thesis.
Negotiation context
- It's been on market 32 days — a 3% lower offer ($233k) is reasonable based on typical stale-listing flexibility.
Questions for the listing agent
- It's been on market 32 days. Have you received any prior offers? Is the seller open to a 6% concession, seller financing, or rate buy-down credit?
- What does the HOA fee cover, when was the last increase, and are there any pending special assessments or reserve-fund shortfalls?
- Is there a deadline driving the sale (1031 exchange, divorce, estate, relocation)? That informs how much negotiation room exists.
- Schools are D-rated, which usually means shorter tenancies and higher turnover. Who's the typical renter profile here, and what's been the actual vacancy rate?
- Crime grade is F in this area — have there been break-ins, vandalism, or insurance claims at this property in the last 3 years? What carrier currently insures it and at what premium?
- The area grade is low — what's the realistic commute time and amenity access for the typical tenant pool here? Any planned neighborhood developments (good or bad) we should know about?
- What's the average days-on-market for RENTAL listings here right now (not sales)? A rising rental-DOM trend means longer vacancies and softer asking-rent achievability than the comps imply.
- What's the recent tenant-quality profile in this submarket — average credit score on applications, eviction rate, late-payment / NSF rate, and stable-employment percentage? A property-management company in the area should have these aggregated.
- How much new for-sale + rental construction is in the pipeline within 1–3 miles? Heavy new supply typically softens prices + rents 12–24 months out; constrained supply supports both.
Investment metrics
- 1% rule
- 0.94% ✗
- Cap rate
- 6.91%
- Cash-on-cash
- 2.19%
- DSCR
- 1.10
- GRM
- 8.9
CMA / ARV
No comps found within radius.
Projected returns pro-forma
-3.0% appreciation · 5.52% rent growth · sell at horizon
- IRR
- -10.0%
- Equity multiple
- 0.63×
- Total profit
- $-25,166
- Equity at exit
- $35,777
- IRR
- 2.5%
- Equity multiple
- 1.20×
- Total profit
- $13,652
- Equity at exit
- $20,746
Cash invested: $67,186 (down + closing). Projections, not guarantees.
Landlord ↔ Tenant lean methodology
- Overall (STATE)
- 87 Strongly Landlord-Friendly
- State Texas
- 87 Strongly Landlord-Friendly · R+5
- County
- — inherits STATE
- City
- — inherits STATE
ZIP-level market 79118
- Rents YoY
- 5.5%
- Active inventory
- 276
- Price-to-rent
- 8.9×
Monthly cashflow live
- Estimated rent
- $2,258 medium interval (Pro) →
- Mortgage (P&I)
- −$1,258
- Tax est. 1.5%
- −$300 /mo · $3,599/yr
- Insurance
- −$100
- HOA
- −$3
- Vacancy / Maint / Mgmt
- −$474
- Net cashflow
- $123
Break-even live
UW: 25.0% down · 7.5% · 30yr · 1.5% tax · 5.0% vac · 8.0% maint · 8.0% mgmt
Financing live
Cash to close
- Down payment
- $59,988
- Closing costs
- $7,198
- Reserves months
- —
- Total cash needed
- —
Loan-product check · same deal, 3 products live
Conventional
25% down · 7.5% · 30yr
- Down + closing
- —
- Monthly P&I
- —
- Monthly cashflow
- —
- DSCR
- —
- Eligible?
- —
Personal DTI + credit; lowest rate.
DSCR
20% down · 8.5% · 30yr
- Down + closing
- —
- Monthly P&I
- —
- Monthly cashflow
- —
- DSCR
- —
- Eligible?
- —
No personal income docs; deal must DSCR.
Hard money
10% down · 12.0% · 12mo
- Down + closing
- —
- Monthly P&I
- —
- Monthly cashflow
- —
- DSCR
- —
- Eligible?
- —
Short-term bridge; refi at stabilization.
Rent comps 2 comps
| Address | Beds | Baths | Sqft | Rent | $/sqft | DOM | Units | Dist |
|---|---|---|---|---|---|---|---|---|
| 4400 Sunset St Amarillo, TX | 3.0 | 2.0 | 1400 | $2,125 | $1.52 | 43d | 1 | 0.07mi |
| 10602 Stone Meadow Dr Amarillo, TX | 3.0 | 2.0 | 1575 | $2,200 | $1.40 | 43d | 1 | 0.29mi |
HOA detail
- Monthly dues
- $3 · $36/yr
Listing history 17 events
-
2026-06-18days on market $239,950 Active 32 DOM
-
2026-06-17days on market $239,950 Active 31 DOM
-
2026-06-16days on market $239,950 Active 30 DOM
-
2026-06-15days on market $239,950 Active 29 DOM
-
2026-06-14days on market $239,950 Active 27 DOM
-
2026-06-13days on market $239,950 Active 26 DOM
-
2026-06-10days on market $239,950 Active 24 DOM
-
2026-06-09days on market $239,950 Active 23 DOM
-
2026-06-08days on market $239,950 Active 22 DOM
-
2026-06-07days on market $239,950 Active 21 DOM
-
2026-06-05days on market $239,950 Active 18 DOM
-
2026-06-03days on market $239,950 Active 17 DOM
-
2026-06-02days on market $239,950 Active 16 DOM
-
2026-06-01days on market $239,950 Active 15 DOM
-
2026-05-31days on market $239,950 Active 14 DOM
-
2026-05-30days on market $239,950 Active 13 DOM
-
2026-05-17$239,950 Active
ⓘ Source: listings_history table (triggers on properties + properties_extension) + one-shot
backfill from property_details.listing_events for pre-trigger history.
Nearby sold comps map
Loading sold comps map…
Walkable amenities ~0.75 mi
Loading nearby amenities…
Taxation est. · year 1
- Rental income
- $27,097
- − Mortgage interest
- −$13,441
- − Property taxes
- −$3,599
- − Insurance
- −$1,200
- − Repairs & maintenance
- −$2,168
- − Management
- −$2,168
- − HOA
- −$36
- − Depreciation
- −$6,980
- Taxable loss
- −$2,495
- Est. tax savings @ 24.0%
- +$599
- After-tax cash flow
- $2,070/yr
For passive investors: Depreciation is non-cash, so a rental often shows a tax loss while cash-flowing — sheltering income. Rental losses are passive: they offset passive income freely, and up to $25,000/yr can offset ordinary (W-2) income if you actively participate and your MAGI is under $100k (phasing out to $0 by $150k); unused losses carry forward. On sale, claimed depreciation is recaptured at up to 25%, and gains may owe capital-gains tax (a 1031 exchange can defer both). Figures are a year-1 estimate at your 24.0% rate — not tax advice; consult a CPA.
Condition & rehab AI · 28 photos
This Eastland Homes new construction is in excellent condition with good curb appeal and a good layout. It is move-in ready and would benefit from some minor updates to increase its resale and rental value.
Value-add opportunities
- Resale Paint interior walls — Fresh paint can make a home more appealing
- Both Replace ceiling fans with energy-efficient models — Energy-efficient fans can save on energy costs and improve comfort
- Both Install smart home devices — Smart home devices can increase home value and appeal to tech-savvy buyers
Renovation cost estimate screening
Value-add ROI direction
- Resale Paint interior walls — Fresh paint can make a home more appealing ↑
- Both Replace ceiling fans with energy-efficient models — Energy-efficient fans can save on energy costs and improve comfort ↑
- Both Install smart home devices — Smart home devices can increase home value and appeal to tech-savvy buyers ↑
ⓘ Cost ranges are severity-bucket heuristics (US national rule-of-thumb). Get contractor quotes + a written scope before underwriting a rehab budget.
Schools (NCES district)
- District
- Canyon ISD
- NCES district ID
- 4812810
- Math proficiency
- 60% ▼ -1.00%
- Reading proficiency
- 54% ▼ -1.00%
- Median HH income
- $65,177
- Composite
- 50.07/100
- National rank
- #1912
- State rank
- #78 of 826 in TX
Livability — Amarillo
- Score
- 66/100
- State rank
- #624
- US rank
- #11876
Category grades
Schools grade is shown separately in the Schools card above.
Census & demographics
- Census place
- Amarillo, TX
- County
- Randall County · 137,351 people
- City population
- 185,802
- Metro
- Amarillo, TX
- Population (ZIP)
- 28,107
- Household income
- $87,810
- Rent vs Own
- Severe rent burden
- 367.0
Population outlook (Randall County) Hauer SSP2
- Today (2025)
- 152,140 people
- By 2030
- 163,107 · +7.2%
- By 2040
- 184,999 · +21.6%
- By 2050
- 206,948 · +36.0%
- By 2075
- 260,204 · +71.0%
- By 2100
- 294,980 · +93.9%
Race, ethnicity, and origin ACS 2023
- Neighborhood character
- Majority White (57%)
- Race & ethnicity
- White 57% Hispanic / Latino 35% Two or more races 18% Black 2% Asian 2% Native American 1%
- Hispanic origin (detail)
- Mexican 31%
- Common ancestry
- Lithuanian 2% Italian 2% Slovak 2%
- Foreign-born
- 6% · Canada, Vietnam
- Languages at home
- 84% English-only · Spanish 14% Vietnamese 1% French/Haitian/Cajun 1%
Political lean MEDSL · Randall
- 2024 margin
- Solid R (+60.4) · D 19.4% · R 79.8%
- 2008→2024 swing
- +2.3pp toward D · 2008: -62.7pp · 2024: -60.4pp
- All cycles
- 2024: R+60.4 2020: R+58.8 2016: R+65.1 2012: R+68.2 2008: R+62.7
Not yet ingested
- Civics
- —
Market trends
- HPI YoY
- ▼ -111.59%
- Current HPI
- 162.5206
- Rent YoY
- ▲ 5.52%
- Metro
- Amarillo, TX
- State GDP YoY
- ▲ 3.95%
- F500 in state
- 110
Industry mix (Fortune 500 HQ in TX)
| Industry | F500 HQs | Revenue |
|---|---|---|
| Energy | 16 | $1,198B |
|
||
| Technology | 5 | $198B |
|
||
| Engineering / Construction | 4 | $72B |
|
||
| Energy Services | 3 | $60B |
|
||
| Utilities | 3 | $41B |
|
||
| Healthcare | 2 | $330B |
|
||
Price history
1 event — show timeline
- 2026-05-17 Listed $239,950 AARMLS
Cash-flow waterfall
monthlySold comps — $/sqft
last 12 mo · ≤1 miLoading sold comps…