 🏗️ New Construction
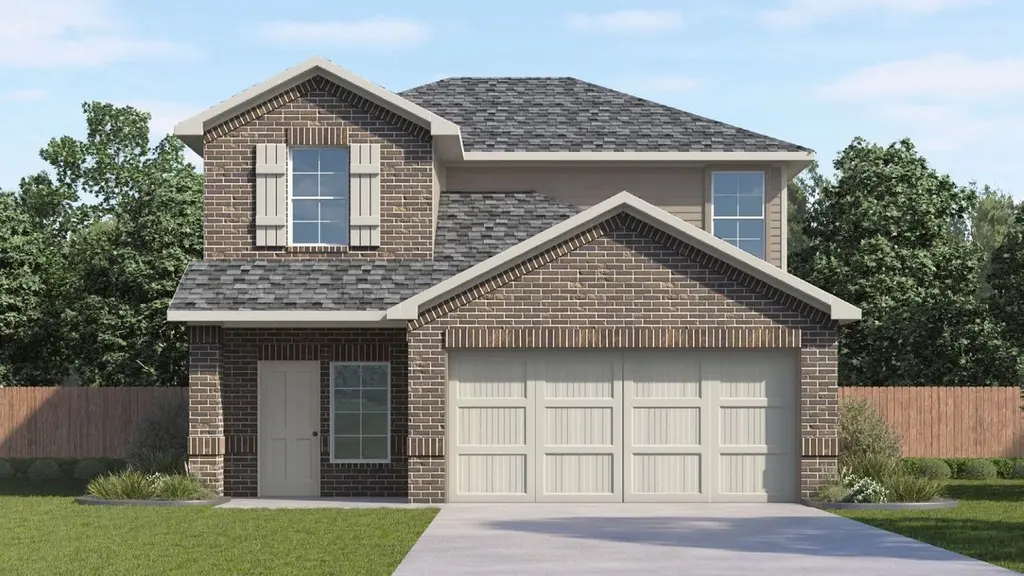
Jasmine Plan · Kendleton, TX
Flood risk No data
- FEMA flood zone
- —
- Chance of flooding over 30 yrs
- —
- Est. flood insurance / yr
- —
Fire risk No data
- Est. fire insurance / yr
- —
Heat risk No data
- Hot days now (above threshold)
- —
- Hot days in 30 yrs
- —
Wind risk No data
- Chance of severe wind over 30 yrs
- —
Air-quality risk No data
- Unhealthy air days now
- —
- Unhealthy air days in 30 yrs
- —
Risk factors via First Street. Map © Google.
Why this score? — see what drove the C grade
The composite is a weighted blend of 9 inputs, each scored 0–100. Each bar is that input's sub-score; the figure is the points it added to the 100-point composite (weight × sub-score).
- Cash flow +18.2/30.0
- ARV discount +7.5/15.0
- Appreciation +7.1/10.0
- DSCR +5.7/10.0
- 1% rule +4.9/10.0
- Schools +4.6/10.0
- Condition / age +4.0/5.0
- Livability +3.1/5.0
- Rent growth +2.5/5.0
$334,990
🖨 Deal sheet (PDF) 📄 Offer letter ✓ Due diligence
Listing remarks MLS
The Jasmine floor plan offers 2,236 sq. ft. of thoughtfully designed living space with a comfortable blend of open-concept areas and private retreats. The first floor features a welcoming foyer that leads into a spacious kitchen with a large island, pantry, and direct access to the dining and family rooms, creating an ideal layout for both everyday living and entertaining. A covered patio extends the living space outdoors, while a conveniently located powder room sits near the front of the home. The first-floor primary bedroom provides a private getaway with a well-appointed bath and a generous walk-in closet. The second floor includes three additional bedrooms and a full bath, along with a large game room that offers flexible space for recreation, relaxation, or gatherings. Located in Emberly, a master-planned community featuring The Haven Amenity Village, that includes a clubhouse with fitness center, outdoor courtyard, resort-style pool, water park with splash pad, event lawn, playground, pickleball court, sand volleyball court, dog park, hike/bike trails, and more!
Key facts
- Well-appointed bath
- Spacious kitchen
- Welcoming foyer
Tags
Neighborhood map
What this means for you Summary
Snapshot
- This is a 4-bed/2.5-bath single-family listed at $335k. Condition is rated good.
Deal economics
- At list price, monthly cash flow is $271 ($3k/yr) — positive.
- The deal already cash-flows at list — no discount required.
- To meet the 1% rule (rent ≥ 1% of price), the offer needs to be $296k (11.5% below list).
- Recommended offer: $295k (12.0% below list) — sets the bar for market timing.
Location & tenants
- Location reads 61/100 on livability (#1,021 in TX) — a middle-class / working-renter tenant base. Strengths: cost of living A+, housing A+; Watch: employment D+, crime D, amenities F.
- Lamar CISD (suburban): math 50% / reading 53% proficiency, ranked #116 of 826 in TX (top 14%) — acceptable for families but not a draw, mixed tenant base, ~2y average lease.
- Zoned schools: Beasley El (math 42% / reading 27%, grade F, #1,995 of 4,322 statewide, top 50%, 366 students, 86% FRL); Lamar J H (math 30% / reading 34%, grade F, #971 of 1,662 statewide, top 60%, 1,246 students, 71% FRL); Lamar Cons H S (math 26% / reading 48%, grade F, #897 of 1,632 statewide, top 57%, 1,762 students, 62% FRL) — zoned schools average 73% FRL vs 43% district-wide (30 pts higher); higher-poverty schools than district average — tighter screening recommended.
- Zoned-school proficiency averages 34% at this address vs 52% district-wide (-17 pts) — the specific schools serving this property underperform the Lamar CISD average; the district grade overstates school quality for this exact location.
- Market conditions: 232 active listings in the ZIP; 1 comparable units currently listed for rent nearby; 12,093 units permitted in Fort Bend County in 2024 (815 in 5+ unit buildings).
Forward outlook
- In year one you build about $15k of equity ($2k loan paydown + $12k appreciation (4.2% local appreciation)).
- Fort Bend County population projected at +75% by 2050 — long-run rental-demand tailwind backs the buy-and-hold thesis.
- At projected returns (4.2% appreciation + 3.0% rent growth), your $84k cash investment doubles in ~5 years — after that, you're playing with house money.
- By year 3, paydown + projected appreciation supports a ~$36k cash-out refi (75% LTV) — recoverable capital for the next deal without selling this one.
Negotiation context
- It's been on market 199 days — a 12% lower offer ($295k) is reasonable based on typical stale-listing flexibility.
Questions for the listing agent
- It's been on market 199 days. Have you received any prior offers? Is the seller open to a 12% concession, seller financing, or rate buy-down credit?
- Why hasn't it sold? Are there any deal-killer items the seller is aware of (foundation, flood, title, zoning, code violations)?
- Is there a deadline driving the sale (1031 exchange, divorce, estate, relocation)? That informs how much negotiation room exists.
- Crime grade is D in this area — have there been break-ins, vandalism, or insurance claims at this property in the last 3 years? What carrier currently insures it and at what premium?
- What's the average days-on-market for RENTAL listings here right now (not sales)? A rising rental-DOM trend means longer vacancies and softer asking-rent achievability than the comps imply.
- What's the recent tenant-quality profile in this submarket — average credit score on applications, eviction rate, late-payment / NSF rate, and stable-employment percentage? A property-management company in the area should have these aggregated.
- How much new for-sale + rental construction is in the pipeline within 1–3 miles? Heavy new supply typically softens prices + rents 12–24 months out; constrained supply supports both.
Investment metrics
- 1% rule
- 0.99% ✗
- Cap rate
- 7.38%
- Cash-on-cash
- 3.88%
- DSCR
- 1.17
- GRM
- 8.4
CMA / ARV
- ARV (median comp)
- $299,705
- List price
- $334,990
- Delta
- 11.77%
- Verdict
- OVERPRICED
- Comps
- 20 within 1.0 mi
Show comp detail 12 sales within ~0.75 mi
| Address | Dist | Beds/Ba | Sqft | Sold | Price | $/sf | Match |
|---|---|---|---|---|---|---|---|
| 10722 Sky Creek Ln | 0.03mi | 3/2.0 (-1) | 2,141 (-4%) | 1mo | $319,000 | $149 | 84 |
| 722 Mockingbird Psge | 0.24mi | 3/2.0 (-1) | 2,200 (-2%) | 2mo | $357,590 | $163 | 78 |
| 10915 Tawny Ridge Dr | 0.55mi | 4/2.5 | 2,066 (-8%) | 4mo | $293,990 | $142 | 59 |
| 730 Mockingbird Passage Dr | 0.26mi | 4/3.5 | 2,563 (+15%) | 2mo | $376,365 | $147 | 58 |
| 706 Blue Sky Pl | 0.59mi | 3/2.0 (-1) | 2,141 (-4%) | 3mo | $319,990 | $149 | 56 |
| 731 Blue Stone Dr | 0.72mi | 3/2.5 (-1) | 2,386 (+7%) | 2mo | $376,990 | $158 | 48 |
| 1102 Arbor Dr | 0.65mi | 4/3.5 | 2,457 (+10%) | 3mo | $334,990 | $136 | 47 |
| 723 Blue Sky Pl | 0.60mi | 4/2.0 | 1,922 (-14%) | 5mo | $314,990 | $164 | 43 |
| 1106 Arbor Dr | 0.66mi | 5/3.0 (+1) | 2,542 (+14%) | 2mo | $329,990 | $130 | 38 |
| 703 Blue Stone Dr | 0.73mi | 4/3.5 | 2,548 (+14%) | 4mo | $385,990 | $151 | 35 |
| 715 Blue Stone Dr | 0.73mi | 4/3.5 | 2,548 (+14%) | 5mo | $389,990 | $153 | 34 |
| 727 Blue Stone Dr | 0.73mi | 4/3.5 | 2,548 (+14%) | 5mo | $383,990 | $151 | 34 |
Match score weights: distance 35% · size 25% · config 20% · recency 20%. Top-matched comps best support the ARV.
Projected returns pro-forma
4.15% appreciation · 3.0% rent growth · sell at horizon
- IRR
- 14.1%
- Equity multiple
- 1.86×
- Total profit
- $72,112
- Equity at exit
- $154,647
- IRR
- 15.2%
- Equity multiple
- 3.51×
- Total profit
- $210,652
- Equity at exit
- $255,110
Cash invested: $83,918 (down + closing). Projections, not guarantees.
Landlord ↔ Tenant lean methodology
- Overall (STATE)
- 87 Strongly Landlord-Friendly
- State Texas
- 87 Strongly Landlord-Friendly · R+5
- County
- — inherits STATE
- City
- — inherits STATE
ZIP-level market 77417
- Home prices YoY
- 1.2%
- Active inventory
- 232
- Price-to-rent
- 9.4×
Monthly cashflow live
- Estimated rent
- $2,965 medium interval (Pro) →
- Mortgage (P&I)
- −$1,572
- Tax est. 1.5%
- −$375 /mo · $4,496/yr
- Insurance
- −$125
- HOA
- −$0
- Vacancy / Maint / Mgmt
- −$623
- Net cashflow
- $271
Break-even live
Sensitivity live
| Price | -10% $478 | -5% $375 | +0% $271 | +5% $168 | +10% $64 |
|---|---|---|---|---|---|
| Rent | -10% $37 | -5% $154 | +0% $271 | +5% $388 | +10% $505 |
| Rate | -1.0pp $422 | -0.5pp $347 | base $271 | +0.5pp $193 | +1.0pp $114 |
UW: 25.0% down · 7.5% · 30yr · 1.5% tax · 5.0% vac · 8.0% maint · 8.0% mgmt
Financing live
Cash to close
- Down payment
- $74,926
- Closing costs
- $8,991
- Reserves months
- —
- Total cash needed
- —
Loan-product check · same deal, 3 products live
Conventional
25% down · 7.5% · 30yr
- Down + closing
- —
- Monthly P&I
- —
- Monthly cashflow
- —
- DSCR
- —
- Eligible?
- —
Personal DTI + credit; lowest rate.
DSCR
20% down · 8.5% · 30yr
- Down + closing
- —
- Monthly P&I
- —
- Monthly cashflow
- —
- DSCR
- —
- Eligible?
- —
No personal income docs; deal must DSCR.
Hard money
10% down · 12.0% · 12mo
- Down + closing
- —
- Monthly P&I
- —
- Monthly cashflow
- —
- DSCR
- —
- Eligible?
- —
Short-term bridge; refi at stabilization.
Rent comps 1 comps
| Address | Beds | Baths | Sqft | Rent | $/sqft | DOM | Units | Dist |
|---|---|---|---|---|---|---|---|---|
| 10730 Sky Creek Ln Beasley, TX | 3.0–4.0 | 2.0–2.5 | 1869 | $2,965 | $1.59 | 0d | 1 | 0.05mi |
Listing history 15 events
-
2026-06-21days on market $334,990 Active 199 DOM
-
2026-06-18days on market $334,990 Active 196 DOM
-
2026-06-17days on market $334,990 Active 195 DOM
-
2026-06-16days on market $334,990 Active 194 DOM
-
2026-06-15days on market $334,990 Active 193 DOM
-
2026-06-13days on market $334,990 Active 191 DOM
-
2026-06-10days on market $334,990 Active 187 DOM
-
2026-06-08days on market $334,990 Active 186 DOM
-
2026-06-07days on market $334,990 Active 185 DOM
-
2026-06-04days on market $334,990 Active 182 DOM
-
2026-06-03days on market $334,990 Active 181 DOM
-
2026-06-02days on market $334,990 Active 180 DOM
-
2026-06-01days on market $334,990 Active 179 DOM
-
2026-05-31days on market $334,990 Active 178 DOM
-
2025-12-04$334,990 Active 1085-char remark
Show marketing remark (1085 chars)
The Jasmine floor plan offers 2,236 sq. ft. of thoughtfully designed living space with a comfortable blend of open-concept areas and private retreats. The first floor features a welcoming foyer that leads into a spacious kitchen with a large island, pantry, and direct access to the dining and family rooms, creating an ideal layout for both everyday living and entertaining. A covered patio extends the living space outdoors, while a conveniently located powder room sits near the front of the home. The first-floor primary bedroom provides a private getaway with a well-appointed bath and a generous walk-in closet. The second floor includes three additional bedrooms and a full bath, along with a large game room that offers flexible space for recreation, relaxation, or gatherings. Located in Emberly, a master-planned community featuring The Haven Amenity Village, that includes a clubhouse with fitness center, outdoor courtyard, resort-style pool, water park with splash pad, event lawn, playground, pickleball court, sand volleyball court, dog park, hike/bike trails, and more!
ⓘ Source: listings_history table (triggers on properties + properties_extension) + one-shot
backfill from property_details.listing_events for pre-trigger history.
Nearby sold comps map
Loading sold comps map…
Walkable amenities ~0.75 mi
Loading nearby amenities…
Taxation est. · year 1
- Rental income
- $35,580
- − Mortgage interest
- −$16,788
- − Property taxes
- −$4,496
- − Insurance
- −$1,499
- − Repairs & maintenance
- −$2,846
- − Management
- −$2,846
- − Depreciation
- −$8,719
- Taxable loss
- −$1,614
- Est. tax savings @ 24.0%
- +$387
- After-tax cash flow
- $3,641/yr
For passive investors: Depreciation is non-cash, so a rental often shows a tax loss while cash-flowing — sheltering income. Rental losses are passive: they offset passive income freely, and up to $25,000/yr can offset ordinary (W-2) income if you actively participate and your MAGI is under $100k (phasing out to $0 by $150k); unused losses carry forward. On sale, claimed depreciation is recaptured at up to 25%, and gains may owe capital-gains tax (a 1031 exchange can defer both). Figures are a year-1 estimate at your 24.0% rate — not tax advice; consult a CPA.
Condition & rehab AI · 1 photo
The Jasmine floor plan is in good condition with a well-maintained exterior and interior. Minor updates to the exterior and interior can significantly enhance its resale and rental value.
Value-add opportunities
- Both Painting and minor touch-ups — Enhances curb appeal and interior aesthetics.
- Both Landscaping improvements — Enhances curb appeal and adds value.
- Resale Kitchen appliances — Modernizes the kitchen and attracts buyers.
- Resale Bathroom fixtures — Modernizes the bathrooms and attracts buyers.
- Rental HVAC system maintenance — Ensures comfort and attracts renters.
- Both Landscaping and curb appeal — Enhances curb appeal and adds value.
Renovation cost estimate screening
Value-add ROI direction
- Both Painting and minor touch-ups — Enhances curb appeal and interior aesthetics. ↑
- Both Landscaping improvements — Enhances curb appeal and adds value. ↑
- Resale Kitchen appliances — Modernizes the kitchen and attracts buyers. ↑
- Resale Bathroom fixtures — Modernizes the bathrooms and attracts buyers. ↑
- Rental HVAC system maintenance — Ensures comfort and attracts renters. ↑
- Both Landscaping and curb appeal — Enhances curb appeal and adds value. ↑
ⓘ Cost ranges are severity-bucket heuristics (US national rule-of-thumb). Get contractor quotes + a written scope before underwriting a rehab budget.
Schools (NCES district)
- District
- Lamar CISD
- NCES district ID
- 4826580
- Math proficiency
- 50% ▼ -12.00%
- Reading proficiency
- 53% ▼ -4.00%
- Median HH income
- $75,213
- Composite
- 46.43/100
- National rank
- #2452
- State rank
- #116 of 826 in TX
Livability — Kendleton
- Score
- 61/100
- State rank
- #1021
- US rank
- #18149
Category grades
Schools grade is shown separately in the Schools card above.
Census & demographics
- Population (ZIP)
- 3,232
Population outlook (Fort Bend County) Hauer SSP2
- Today (2025)
- 1,004,526 people
- By 2030
- 1,153,104 · +14.8%
- By 2040
- 1,453,718 · +44.7%
- By 2050
- 1,753,781 · +74.6%
- By 2075
- 2,455,772 · +144.5%
- By 2100
- 2,930,528 · +191.7%
Race, ethnicity, and origin ACS 2023
- Neighborhood character
- Predominantly Hispanic (67%)
- Race & ethnicity
- Hispanic / Latino 67% Two or more races 49% White 22% Black 8%
- Hispanic origin (detail)
- Mexican 54%
- Common ancestry
- Italian 2% Romanian 1%
- Foreign-born
- 3% · Canada
- Languages at home
- 76% English-only · Spanish 24%
Political lean MEDSL · Fort Bend
- 2024 margin
- Toss-up / Even · D 49.5% · R 47.9% · Other 2.6%
- 2008→2024 swing
- +4.0pp toward D · 2008: -2.4pp · 2024: 1.6pp
- All cycles
- 2024: D+1.6 2020: D+10.6 2016: D+6.6 2012: R+6.8 2008: R+2.4
Not yet ingested
- Civics
- —
Market trends
- HPI YoY
- ▲ 4.15%
- Current HPI
- 337.8236
- Rent YoY
- —
- Metro
- —
- State GDP YoY
- ▲ 3.95%
- F500 in state
- 110
Industry mix (Fortune 500 HQ in TX)
| Industry | F500 HQs | Revenue |
|---|---|---|
| Energy | 16 | $1,198B |
|
||
| Technology | 5 | $198B |
|
||
| Engineering / Construction | 4 | $72B |
|
||
| Energy Services | 3 | $60B |
|
||
| Utilities | 3 | $41B |
|
||
| Healthcare | 2 | $330B |
|
||
Price history
1 event — show timeline
- 2025-12-04 Listed $334,990 Zillow
Cash-flow waterfall
monthlySold comps — $/sqft
last 12 mo · ≤1 miLoading sold comps…