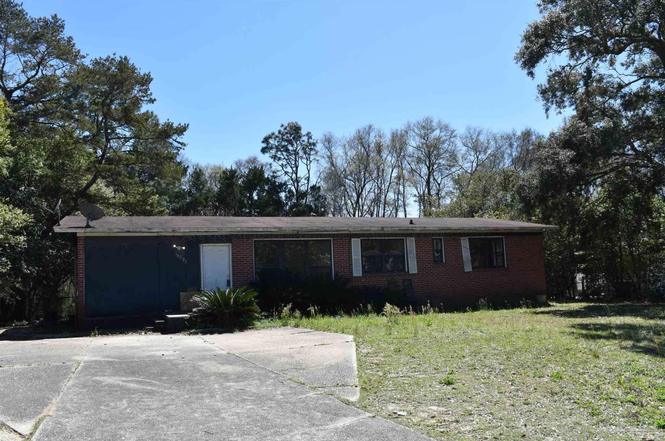
6571 Cedar St · Milton, FL
Flood risk 1/10 · Minimal
- FEMA flood zone
- X (unshaded)
- Chance of flooding over 30 yrs
- 0.0%
- Est. flood insurance / yr
- $507 – $1,088
Fire risk 3/10 · Minor
- Est. fire insurance / yr
- $947 – $1,759
Heat risk 9/10 · Severe
- Hot days now (above 104°F)
- 7 days/yr
- Hot days in 30 yrs
- 20 days/yr
Wind risk 9/10 · Severe
- Chance of severe wind over 30 yrs
- 99.0%
Air-quality risk 2/10 · Minimal
- Unhealthy air days now
- 0 days/yr
- Unhealthy air days in 30 yrs
- 1 days/yr
Risk factors via First Street. Map © Google.
Why this score? — see what drove the C+ grade
The composite is a weighted blend of 9 inputs, each scored 0–100. Each bar is that input's sub-score; the figure is the points it added to the 100-point composite (weight × sub-score).
- Cash flow +20.4/30.0
- ARV discount +15.0/15.0
- DSCR +6.5/10.0
- Schools +5.3/10.0
- 1% rule +5.0/10.0
- Livability +3.9/5.0
- Rent growth +3.2/5.0
- Condition / age +2.5/5.0
- Appreciation +0.0/10.0
$192,400
🖨 Deal sheet 📄 Offer letter ✓ Due diligence
Listing remarks MLS
This is a 3 bedroom 2 bath home in established neighborhood. Fenced back yard, covered patio, hardwood floors. This won't last long so be ready to make this your home.
Key facts
- New water heater
- Bonus room
- New kitchen cabinets
Tags
Property features AI
Finance
- Other: Lot size approximately 0.41 acres; Building area approximately 1,711 square feet
- HOA & community: No homeowners association
Exterior
- Parking: Driveway with open parking
- Utilities: Public water; Public sewer; Circuit breaker electrical service
- Home design: Single-story home; Resale property; Not attached to other units; Insulation and insulated walls
- Construction: Brick and frame construction; Off-grade foundation
- Exterior features: Partial fencing; Paved, public-maintained road access; Central access lot feature; Roof: see remarks
Interior
- Kitchen: Updated kitchen; New cabinets and countertops installed in 2025; Electric water heater
- Bedrooms: Primary bedroom on the first floor (approx. 14' x 12'); Two additional bedrooms on the first floor (each approx. 12' x 12')
- Flooring: Hardwood
- Bathrooms: Two full bathrooms
- Heating & cooling: Central heating; Central air conditioning
- Interior features: Ceiling fan(s); Hardwood flooring
- Laundry & utility: Electric water heater
Neighborhood map
What this means for you Summary
Snapshot
- This is a 3-bed/2.0-bath single-family listed at $192k.
Deal economics
- At list price, monthly cash flow is $249 ($3k/yr) — positive.
- The deal already cash-flows at list — no discount required.
- To meet the 1% rule (rent ≥ 1% of price), the offer needs to be $192k (0.2% below list).
- Recommended offer: $169k (12.0% below list) — sets the bar for market timing.
- Cap rate 7.8% vs local median 4.6% in Milton — top-decile yield for the area; either an underpriced asset or a hidden risk that comps aren't pricing in. Stress-test before assuming the spread holds.
Location & tenants
- Location reads 78/100 on livability (#166 in FL, #2,480 nationally) — a middle-class / working-renter tenant base. Strengths: cost of living A+, housing A+, health & safety A+; Watch: amenities D-, commute F.
- Santa Rosa (suburban): math 63% / reading 60% proficiency, ranked #8 of 73 in FL (top 11%) — acceptable for families but not a draw, mixed tenant base, ~2y average lease.
- Market conditions: Rents rising (+2.7%/yr); 360 active listings in the ZIP; 8 comparable units currently listed for rent nearby; rentals at typical pace (median 24d on market — plan ~3-4 weeks tenant-placement turnaround); solid renter incomes; 1,983 units permitted in Santa Rosa County in 2024 (128 in 5+ unit buildings).
Forward outlook
- Local home prices are declining (-3.0%/yr); year-one equity from $1k of loan paydown is wiped out by about $6k of value loss. Plan a longer hold.
- Santa Rosa County population projected at +31% by 2050 — long-run rental-demand tailwind backs the buy-and-hold thesis.
Negotiation context
- It's been on market 229 days — a 12% lower offer ($169k) is reasonable based on typical stale-listing flexibility.
- 4 sale attempts since 5y ago with the ask held roughly flat each time — persistent listings suggest the price (not the market) is what's stuck; bring a comps-based counter.
- Current owner paid $129k; 49% above their basis — modest negotiation headroom, anchor on the comps not their cost.
Risks & watch-outs
- Watch-outs: built in 1957 — expect roof / HVAC / electrical / plumbing capex.
- Climate carrying-cost: severe wind risk, 99% chance of damaging wind over 30y; extreme-heat days projected 7→20/yr by 2055 (HVAC capex compounding) — expect insurance premiums to compound above CPI over the hold.
Questions for the listing agent
- It's been on market 229 days. Have you received any prior offers? Is the seller open to a 12% concession, seller financing, or rate buy-down credit?
- Built in 1957 — when were the roof, HVAC, electrical panel, plumbing, and water heater last replaced?
- Why hasn't it sold? Are there any deal-killer items the seller is aware of (foundation, flood, title, zoning, code violations)?
- Is there a deadline driving the sale (1031 exchange, divorce, estate, relocation)? That informs how much negotiation room exists.
- Schools are B-rated — typically a magnet for longer-tenancy family renters. What's the average tenant stay here, and is there a school-zone premium baked into asking?
- What's the average days-on-market for RENTAL listings here right now (not sales)? A rising rental-DOM trend means longer vacancies and softer asking-rent achievability than the comps imply.
- What's the recent tenant-quality profile in this submarket — average credit score on applications, eviction rate, late-payment / NSF rate, and stable-employment percentage? A property-management company in the area should have these aggregated.
- How much new for-sale + rental construction is in the pipeline within 1–3 miles? Heavy new supply typically softens prices + rents 12–24 months out; constrained supply supports both.
Investment metrics
- 1% rule
- 1.00% ✗
- Cap rate
- 7.85%
- Cash-on-cash
- 5.55%
- DSCR
- 1.25
- GRM
- 8.4
CMA / ARV
- ARV (on-the-fly)
- $237,829
- Comps found
- 12
Show comp detail 12 sales within ~0.75 mi
| Address | Dist | Beds/Ba | Sqft | Sold | Price | $/sf | Match |
|---|---|---|---|---|---|---|---|
| 6606 Lee St | 0.13mi | 3/2.0 | 1,564 (-9%) | 5mo | $240,000 | $153 | 75 |
| 6623 Ridge Crest Dr | 0.63mi | 3/2.0 | 1,750 (+2%) | 4mo | $265,000 | $151 | 63 |
| 5733 Pecan St | 0.12mi | 4/3.0 (+1) | 1,905 (+11%) | 5mo | $265,000 | $139 | 62 |
| 6582 Lee St | 0.12mi | 4/2.0 (+1) | 1,469 (-14%) | 5mo | $195,000 | $133 | 61 |
| 6413 Sanders St | 0.54mi | 3/2.0 | 1,825 (+7%) | 3mo | $329,700 | $181 | 61 |
| 6807 Chaffin St | 0.74mi | 3/2.0 | 1,664 (-3%) | 0mo | $190,000 | $114 | 60 |
| 6518 Robin Ave | 0.45mi | 3/2.0 | 1,560 (-9%) | 5mo | $120,000 | $77 | 60 |
| 5589 Birch St | 0.36mi | 3/2.0 | 1,458 (-15%) | 3mo | $174,500 | $120 | 56 |
| 6481 Colonial Dr | 0.38mi | 3/1.5 | 1,507 (-12%) | 6mo | $105,000 | $70 | 55 |
| 5913 Savannah Dr | 0.67mi | 3/2.0 | 1,532 (-10%) | 4mo | $242,050 | $158 | 48 |
| 6902 Hanover Ct | 0.62mi | 4/2.0 (+1) | 1,916 (+12%) | 1mo | $369,000 | $193 | 46 |
| 5905 Little Leaf Ct | 0.47mi | 4/2.5 (+1) | 1,940 (+13%) | 5mo | $262,000 | $135 | 45 |
Match score weights: distance 35% · size 25% · config 20% · recency 20%. Top-matched comps best support the ARV.
Projected returns pro-forma
-3.0% appreciation · 2.7% rent growth · sell at horizon
- IRR
- -8.0%
- Equity multiple
- 0.71×
- Total profit
- $-15,890
- Equity at exit
- $28,687
- IRR
- 1.1%
- Equity multiple
- 1.08×
- Total profit
- $4,209
- Equity at exit
- $16,635
Cash invested: $53,872 (down + closing). Projections, not guarantees.
Landlord ↔ Tenant lean methodology
- Overall (STATE)
- 87 Strongly Landlord-Friendly
- State Florida
- 87 Strongly Landlord-Friendly · R+3
- County
- — inherits STATE
- City
- — inherits STATE
ZIP-level market 32570
- Home prices YoY
- -15.1%
- Rents YoY
- 2.7%
- Active inventory
- 360
- Price-to-rent
- 8.4×
Monthly cashflow live
- Estimated rent
- $1,919 high interval (Pro) →
- Mortgage (P&I)
- −$1,009
- Tax from tax record
- −$178 /mo · $2,134/yr
- Insurance
- −$80
- HOA
- −$0
- Vacancy / Maint / Mgmt
- −$403
- Net cashflow
- $249
Break-even live
UW: 25.0% down · 7.5% · 30yr · 1.5% tax · 5.0% vac · 8.0% maint · 8.0% mgmt
Financing live
Cash to close
- Down payment
- $48,100
- Closing costs
- $5,772
- Reserves months
- —
- Total cash needed
- —
Loan-product check · same deal, 3 products live
Conventional
25% down · 7.5% · 30yr
- Down + closing
- —
- Monthly P&I
- —
- Monthly cashflow
- —
- DSCR
- —
- Eligible?
- —
Personal DTI + credit; lowest rate.
DSCR
20% down · 8.5% · 30yr
- Down + closing
- —
- Monthly P&I
- —
- Monthly cashflow
- —
- DSCR
- —
- Eligible?
- —
No personal income docs; deal must DSCR.
Hard money
10% down · 12.0% · 12mo
- Down + closing
- —
- Monthly P&I
- —
- Monthly cashflow
- —
- DSCR
- —
- Eligible?
- —
Short-term bridge; refi at stabilization.
Rent comps 8 comps
| Address | Beds | Baths | Sqft | Rent | $/sqft | DOM | Units | Dist |
|---|---|---|---|---|---|---|---|---|
| 5733 Orange St Milton, FL | 3.0 | 1.5 | 1640 | $1,500 | $0.91 | 23d | 1 | 0.18mi |
| 6716 Barnwood Dr Milton, FL | 3.0 | 2.0 | 1753 | $1,850 | $1.06 | 23d | 1 | 0.46mi |
| 6747 Weathered Dr Milton, FL | 3.0 | 2.0 | 1546 | $1,800 | $1.16 | 23d | 1 | 0.53mi |
| 6707 Cedar Ridge Cir Milton, FL | 3.0 | 2.5 | 1669 | $1,900 | $1.14 | 14d | 1 | 0.70mi |
| 5723 Maggie Rose Cir Milton, FL | 3.0 | 2.0 | 1610 | $2,000 | $1.24 | 14d | 1 | 0.89mi |
| 5723 Maggie Rose Cir Milton, FL | 3.0 | 2.0 | 1610 | $2,000 | $1.24 | 23d | 1 | 0.89mi |
| 5357 Locklin Ave Milton, FL | 3.0 | 1.0 | 1100 | $1,700 | $1.55 | 14d | 1 | 0.97mi |
| 5555 Hannah St Milton, FL | 3.0 | 2.0 | 2010 | $1,900 | $0.95 | 23d | 1 | 1.00mi |
Listing history 25 events
-
2026-06-10days on market $192,400 Active 229 DOM
-
2026-06-09days on market $192,400 Active 228 DOM
-
2026-06-08days on market $192,400 Active 227 DOM
-
2026-06-07days on market $192,400 Active 226 DOM
-
2026-06-05days on market $192,400 Active 223 DOM
-
2026-06-03days on market $192,400 Active 222 DOM
-
2026-06-02days on market $192,400 Active 221 DOM
-
2026-06-01days on market $192,400 Active 220 DOM
-
2026-05-31days on market $192,400 Active 219 DOM
-
2026-05-31days on market $192,400 Active 218 DOM
-
2026-01-26price $192,400
-
2025-12-25price $194,900
-
2025-10-24$199,900 Active
-
2021-08-16status Pending 167-char remark
Show marketing remark (167 chars)
This is a 3 bedroom 2 bath home in established neighborhood. Fenced back yard, covered patio, hardwood floors. This won't last long so be ready to make this your home.
-
2021-08-11soldstatus $129,000
-
2021-08-10soldstatus $129,000 Sold 167-char remark
Show marketing remark (167 chars)
This is a 3 bedroom 2 bath home in established neighborhood. Fenced back yard, covered patio, hardwood floors. This won't last long so be ready to make this your home.
-
2021-05-10historical Contingent 167-char remark
Show marketing remark (167 chars)
This is a 3 bedroom 2 bath home in established neighborhood. Fenced back yard, covered patio, hardwood floors. This won't last long so be ready to make this your home.
-
2021-03-31status Active 167-char remark
Show marketing remark (167 chars)
This is a 3 bedroom 2 bath home in established neighborhood. Fenced back yard, covered patio, hardwood floors. This won't last long so be ready to make this your home.
-
2021-03-19Contingent 167-char remark
Show marketing remark (167 chars)
This is a 3 bedroom 2 bath home in established neighborhood. Fenced back yard, covered patio, hardwood floors. This won't last long so be ready to make this your home.
-
2021-03-03$129,900 167-char remark
Show marketing remark (167 chars)
This is a 3 bedroom 2 bath home in established neighborhood. Fenced back yard, covered patio, hardwood floors. This won't last long so be ready to make this your home.
-
1998-04-07soldstatus $56,000
-
1993-12-27soldstatus $42,900
-
1987-03-01soldstatus $39,500
-
1978-07-01soldstatus $27,667
-
1976-03-01soldstatus $23,000
ⓘ Source: listings_history table (triggers on properties + properties_extension) + one-shot
backfill from property_details.listing_events for pre-trigger history.
Tax reassessment forecast FL · Resets to sale price
- Current annual tax
- $2,134 · $178/mo
- Projected year-2 tax
- $2,134 · $178/mo
- Expected delta
- $0/yr ($0/mo · 0.0%)
ⓘ Screening estimate from a state-policy table — verify with the county assessor before closing.
Climate risk First Street
- Flood 1/10 Low FEMA zone X (unshaded) · 0% chance over 30 yrs
- Wildfire 3/10 Moderate
- Heat 9/10 Extreme 7 d/yr ≥104°F today · 20 d/yr by 30 yrs out
- Wind 9/10 Extreme 99% chance of damaging wind over 30 yrs
- Air quality 2/10 Low 0 unhealthy d/yr today · 1 by 30 yrs out
Nearby sold comps map
Loading sold comps map…
Walkable amenities ~0.75 mi
Loading nearby amenities…
Taxation est. · year 1
- Rental income
- $23,031
- − Mortgage interest
- −$10,777
- − Property taxes
- −$2,134
- − Insurance
- −$962
- − Repairs & maintenance
- −$1,843
- − Management
- −$1,843
- − Depreciation
- −$5,597
- Taxable loss
- −$124
- Est. tax savings @ 24.0%
- +$30
- After-tax cash flow
- $3,021/yr
For passive investors: Depreciation is non-cash, so a rental often shows a tax loss while cash-flowing — sheltering income. Rental losses are passive: they offset passive income freely, and up to $25,000/yr can offset ordinary (W-2) income if you actively participate and your MAGI is under $100k (phasing out to $0 by $150k); unused losses carry forward. On sale, claimed depreciation is recaptured at up to 25%, and gains may owe capital-gains tax (a 1031 exchange can defer both). Figures are a year-1 estimate at your 24.0% rate — not tax advice; consult a CPA.
Schools (NCES district)
- District
- Santa Rosa
- NCES district ID
- 1201650
- Math proficiency
- 63% ▼ -6.00%
- Reading proficiency
- 60% ▼ -5.00%
- Median HH income
- $58,161
- Composite
- 53.12/100
- National rank
- #1511
- State rank
- #8 of 73 in FL
Livability — Milton
- Score
- 78/100
- State rank
- #166
- US rank
- #2480
Category grades
Schools grade is shown separately in the Schools card above.
Census & demographics
- Census place
- Milton, FL
- County
- Santa Rosa County · 194,764 people
- City population
- 69,025
- Metro
- Pensacola-Ferry Pass-Brent, FL
- Population (ZIP)
- 37,197
- Household income
- $77,222
- Rent vs Own
- Severe rent burden
- 590.0
Population outlook (Santa Rosa County) Hauer SSP2
- Today (2025)
- 195,978 people
- By 2030
- 209,782 · +7.0%
- By 2040
- 235,293 · +20.1%
- By 2050
- 256,408 · +30.8%
- By 2075
- 298,074 · +52.1%
- By 2100
- 303,216 · +54.7%
Race, ethnicity, and origin ACS 2023
- Neighborhood character
- Predominantly White (80%)
- Race & ethnicity
- White 80% Two or more races 7% Black 6% Hispanic / Latino 6% Asian 1%
- Hispanic origin (detail)
- Mexican 2% Puerto Rican 2%
- Common ancestry
- Italian 4% Lithuanian 3% Portuguese 2%
- Foreign-born
- 4% · Canada
- Languages at home
- 94% English-only · Spanish 4% Other Asian/Pacific 1%
Political lean MEDSL · Santa Rosa
- 2024 margin
- Solid R (+51.0) · D 24.1% · R 75.0%
- 2008→2024 swing
- -3.0pp toward R · 2008: -47.9pp · 2024: -51.0pp
- All cycles
- 2024: R+51.0 2020: R+46.5 2016: R+53.5 2012: R+52.6 2008: R+47.9
Not yet ingested
- Civics
- —
Market trends
- HPI YoY
- ▼ -51.06%
- Current HPI
- 287.7469
- Rent YoY
- ▲ 2.70%
- Metro
- Pensacola-Ferry Pass-Brent, FL
- State GDP YoY
- ▲ 3.28%
- F500 in state
- 36
Industry mix (Fortune 500 HQ in FL)
| Industry | F500 HQs | Revenue |
|---|---|---|
| Industrial Technology | 2 | $29B |
|
||
| Insurance | 2 | $17B |
|
||
| Retail | 1 | $60B |
|
||
| Technology Distribution | 1 | $58B |
|
||
| Homebuilding | 1 | $35B |
|
||
| Technology Manufacturing | 1 | $35B |
|
||
Price history
+736.5% since first listed15 events — show timeline
- 2026-01-26 Price Changed $192,400 PARMLS
- 2025-12-25 Price Changed $194,900 PARMLS
- 2025-10-24 Listed $199,900 PARMLS
- 2021-08-16 Pending — PARMLS
- 2021-08-11 Sold (Public Records) $129,000 Public Records
- 2021-08-10 Sold (MLS) $129,000 PARMLS
- 2021-05-10 Contingent — PARMLS
- 2021-03-31 Relisted — PARMLS
- 2021-03-19 Listed — PARMLS
- 2021-03-03 Listed $129,900 PARMLS
- 1998-04-07 Sold (Public Records) $56,000 Public Records
- 1993-12-27 Sold (Public Records) $42,900 Public Records
- 1987-03-01 Sold (Public Records) $39,500 Public Records
- 1978-07-01 Sold (Public Records) $27,667 Public Records
- 1976-03-01 Sold (Public Records) $23,000 Public Records
Property tax history
+6.7%/yrLatest (2025): $2,134 · -4.2% YoY. Source: county tax records.
Cash-flow waterfall
monthlySold comps — $/sqft
last 12 mo · ≤1 miLoading sold comps…