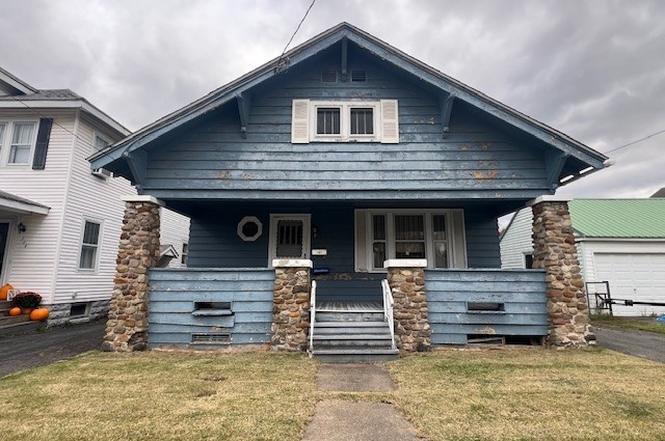
102 Dryden Ave · Utica, NY
Flood risk 6/10 · Moderate
- FEMA flood zone
- X (unshaded)
- Chance of flooding over 30 yrs
- 0.69%
- Est. flood insurance / yr
- $473 – $860
Fire risk 1/10 · Minimal
- Est. fire insurance / yr
- $691 – $1,283
Heat risk 3/10 · Minor
- Hot days now (above 95°F)
- 7 days/yr
- Hot days in 30 yrs
- 17 days/yr
Wind risk 2/10 · Minimal
- Chance of severe wind over 30 yrs
- 1.0%
Air-quality risk 2/10 · Minimal
- Unhealthy air days now
- 0 days/yr
- Unhealthy air days in 30 yrs
- 2 days/yr
Risk factors via First Street. Map © Google.
Why this score? — see what drove the B- grade
The composite is a weighted blend of 9 inputs, each scored 0–100. Each bar is that input's sub-score; the figure is the points it added to the 100-point composite (weight × sub-score).
- Cash flow +30.0/30.0
- 1% rule +10.0/10.0
- DSCR +10.0/10.0
- ARV discount +7.5/15.0
- Livability +4.0/5.0
- Schools +2.9/10.0
- Rent growth +2.5/5.0
- Condition / age +2.5/5.0
- Appreciation +0.0/10.0
$98,000
🖨 Deal sheet (PDF) 📄 Offer letter ✓ Due diligence
Listing remarks
Discover the potential in this desirable South Utica home! This spacious bungalow features 5 bedrooms and 1 full bathroom, offering plenty of room for family or home office space. The welcoming front entry opens to a large porch, perfect for relaxing evenings. Enjoy meals or quiet mornings in the screened-in porch off the kitchen, adding extra space for entertaining or everyday living. A walk-in attic provides ample room for expansion or storage, and the full basement offers even more possibilities. With great bones and endless potential, this home is ready for your personal touch. Don’t wait—this gem won’t last long! Home being sold as-is.
Key facts
- Screened-in porch
- Full basement
- Large porch
Tags
Neighborhood map
What this means for you Summary
Snapshot
- This is a 5-bed/1.5-bath single-family listed at $98k.
Deal economics
- At list price, monthly cash flow is $808 ($10k/yr) — positive.
- The deal already cash-flows at list — no discount required.
- Meets the 1% rule at list price ($2k rent vs $98k).
- Recommended offer: $89k (9.0% below list) — sets the bar for market timing.
- Cap rate 16.2% vs local median 7.8% in Utica — top-decile yield for the area; either an underpriced asset or a hidden risk that comps aren't pricing in. Stress-test before assuming the spread holds.
Location & tenants
- Location reads 80/100 on livability (#104 in NY, #1,589 nationally) — a professional / high-income tenant draw. Strengths: commute A+, cost of living A+, housing A+; Watch: employment D, crime F.
- Utica City School District (urban): math 33% / reading 38% proficiency, ranked #562 of 590 in NY (top 95%) — families likely to look elsewhere, expect single-tenant / working-renter base with shorter leases; 71% free/reduced lunch — lower-income household profile, screen leases tightly.
- Zoned schools: Hugh R Jones Elementary School (math 47% / reading 62%, grade C, #908 of 2,108 statewide, top 46%, 405 students, 55% FRL); Senator James H Donovan Middle School (math 19% / reading 30%, grade F, #611 of 729 statewide, top 88%, 730 students, 84% FRL); Thomas R Proctor High School (math 86% / reading 62%, grade B+, #659 of 1,100 statewide, top 60%, 2,675 students, 76% FRL) — zoned schools at 71% FRL track the district average.
- Zoned-school proficiency averages 51% at this address vs 36% district-wide (+16 pts) — the actual schools serving this property are materially stronger than the Utica City School District average implies; a family-tenant draw the district grade alone would hide.
- Market conditions: 150 active listings in the ZIP; 204 units permitted in Oneida County in 2024 (68 in 5+ unit buildings).
- This rent runs 41% of the median local income ($58k/yr) — at the standard rent-burdened threshold; future hikes will face affordability resistance.
Forward outlook
- Local home prices are declining (-3.0%/yr); year-one equity from $678 of loan paydown is wiped out by about $3k of value loss. Plan a longer hold.
- Oneida County population projected at -12% by 2050 — secular population decline; favor cash flow + early exit over multi-decade hold.
- At projected returns (-3.0% appreciation + 3.0% rent growth), your $27k cash investment doubles in ~4 years — after that, you're playing with house money.
Negotiation context
- It's been on market 112 days — a 9% lower offer ($89k) is reasonable based on typical stale-listing flexibility.
Risks & watch-outs
- Watch-outs: built in 1925 — expect roof / HVAC / electrical / plumbing capex.
- Climate carrying-cost: major flood risk — expect insurance premiums to compound above CPI over the hold.
Questions for the listing agent
- It's been on market 112 days. Have you received any prior offers? Is the seller open to a 9% concession, seller financing, or rate buy-down credit?
- Built in 1925 — when were the roof, HVAC, electrical panel, plumbing, and water heater last replaced?
- Why hasn't it sold? Are there any deal-killer items the seller is aware of (foundation, flood, title, zoning, code violations)?
- Is there a deadline driving the sale (1031 exchange, divorce, estate, relocation)? That informs how much negotiation room exists.
- Schools are D-rated, which usually means shorter tenancies and higher turnover. Who's the typical renter profile here, and what's been the actual vacancy rate?
- Crime grade is F in this area — have there been break-ins, vandalism, or insurance claims at this property in the last 3 years? What carrier currently insures it and at what premium?
- What's the average days-on-market for RENTAL listings here right now (not sales)? A rising rental-DOM trend means longer vacancies and softer asking-rent achievability than the comps imply.
- What's the recent tenant-quality profile in this submarket — average credit score on applications, eviction rate, late-payment / NSF rate, and stable-employment percentage? A property-management company in the area should have these aggregated.
- How much new for-sale + rental construction is in the pipeline within 1–3 miles? Heavy new supply typically softens prices + rents 12–24 months out; constrained supply supports both.
Investment metrics
- 1% rule
- 2.00% ✓
- Cap rate
- 16.19%
- Cash-on-cash
- 35.34%
- DSCR
- 2.57
- GRM
- 4.2
CMA / ARV
- ARV (on-the-fly)
- $298,200
- Comps found
- 12
Show comp detail 12 sales within ~0.75 mi
| Address | Dist | Beds/Ba | Sqft | Sold | Price | $/sf | Match |
|---|---|---|---|---|---|---|---|
| 117 Proctor Blvd | 0.33mi | 4/1.5 (-1) | 2,012 (-4%) | 10mo | $360,000 | $179 | 64 |
| 13 Proctor Blvd | 0.31mi | 4/2.5 (-1) | 2,078 (-1%) | 16mo | $267,800 | $129 | 61 |
| 171 Proctor Blvd | 0.55mi | 4/1.5 (-1) | 2,106 (+0%) | 12mo | $210,000 | $100 | 59 |
| 9 Seward Ave | 0.21mi | 5/2.5 | 2,407 (+15%) | 9mo | $325,000 | $135 | 54 |
| 2 Cromwell Pl | 0.36mi | 4/1.5 (-1) | 1,890 (-10%) | 12mo | $186,500 | $99 | 51 |
| 2642 Remington Rd | 0.74mi | 4/3.0 (-1) | 2,142 (+2%) | 2mo | $305,000 | $142 | 50 |
| 806 Mildred Ave | 0.61mi | 4/1.5 (-1) | 1,974 (-6%) | 11mo | $210,000 | $106 | 48 |
| 140 Proctor Blvd | 0.43mi | 4/2.0 (-1) | 1,800 (-14%) | 3mo | $287,000 | $159 | 47 |
| 12 Eastwood Ave | 0.53mi | 5/3.0 | 2,400 (+14%) | 1mo | $352,000 | $147 | 45 |
| 109 Patricia Ln | 0.45mi | 4/2.5 (-1) | 2,293 (+9%) | 12mo | $368,000 | $160 | 44 |
| 18 Geer Ave | 0.59mi | 4/1.5 (-1) | 2,340 (+11%) | 8mo | $335,000 | $143 | 42 |
| 23 Bonnie Brae | 0.62mi | 4/2.0 (-1) | 2,330 (+11%) | 9mo | $270,000 | $116 | 38 |
Match score weights: distance 35% · size 25% · config 20% · recency 20%. Top-matched comps best support the ARV.
Projected returns pro-forma
-3.0% appreciation · 3.0% rent growth · sell at horizon
- IRR
- 31.0%
- Equity multiple
- 2.30×
- Total profit
- $35,656
- Equity at exit
- $14,612
- IRR
- 38.2%
- Equity multiple
- 4.56×
- Total profit
- $97,604
- Equity at exit
- $8,473
Cash invested: $27,440 (down + closing). Projections, not guarantees.
Landlord ↔ Tenant lean methodology
- Overall (STATE)
- 15 Strongly Tenant-Friendly
- State New York
- 15 Strongly Tenant-Friendly · D+10
- County
- — inherits STATE
- City
- — inherits STATE
ZIP-level market 13502
- Home prices YoY
- -12.1%
- Active inventory
- 150
- Price-to-rent
- 4.2×
Monthly cashflow live
- Estimated rent
- $1,963 medium interval (Pro) →
- Mortgage (P&I)
- −$514
- Tax from tax record
- −$188 /mo · $2,258/yr
- Insurance
- −$41
- HOA
- −$0
- Vacancy / Maint / Mgmt
- −$412
- Net cashflow
- $808
Break-even live
Sensitivity live
| Price | -10% $864 | -5% $836 | +0% $808 | +5% $780 | +10% $753 |
|---|---|---|---|---|---|
| Rent | -10% $653 | -5% $731 | +0% $808 | +5% $886 | +10% $963 |
| Rate | -1.0pp $857 | -0.5pp $833 | base $808 | +0.5pp $783 | +1.0pp $757 |
UW: 25.0% down · 7.5% · 30yr · 1.5% tax · 5.0% vac · 8.0% maint · 8.0% mgmt
Financing live
Cash to close
- Down payment
- $24,500
- Closing costs
- $2,940
- Reserves months
- —
- Total cash needed
- —
Loan-product check · same deal, 3 products live
Conventional
25% down · 7.5% · 30yr
- Down + closing
- —
- Monthly P&I
- —
- Monthly cashflow
- —
- DSCR
- —
- Eligible?
- —
Personal DTI + credit; lowest rate.
DSCR
20% down · 8.5% · 30yr
- Down + closing
- —
- Monthly P&I
- —
- Monthly cashflow
- —
- DSCR
- —
- Eligible?
- —
No personal income docs; deal must DSCR.
Hard money
10% down · 12.0% · 12mo
- Down + closing
- —
- Monthly P&I
- —
- Monthly cashflow
- —
- DSCR
- —
- Eligible?
- —
Short-term bridge; refi at stabilization.
Listing history 5 events
-
2026-02-14status Pending
-
2026-02-03price $98,000
-
2025-12-25price $126,000
-
2025-11-24price $133,000
-
2025-10-25$140,000 Active
ⓘ Source: listings_history table (triggers on properties + properties_extension) + one-shot
backfill from property_details.listing_events for pre-trigger history.
Tax reassessment forecast NY · Partial reset (capped growth)
- Current annual tax
- $2,258 · $188/mo
- Projected year-2 tax
- $2,258 · $188/mo
- Expected delta
- $0/yr ($0/mo · 0.0%)
ⓘ Screening estimate from a state-policy table — verify with the county assessor before closing.
Climate risk First Street
- Flood 6/10 Major FEMA zone X (unshaded) · 69% chance over 30 yrs
- Wildfire 1/10 Low
- Heat 3/10 Moderate 7 d/yr ≥95°F today · 17 d/yr by 30 yrs out
- Wind 2/10 Low 100% chance of damaging wind over 30 yrs
- Air quality 2/10 Low 0 unhealthy d/yr today · 2 by 30 yrs out
Nearby sold comps map
Loading sold comps map…
Walkable amenities ~0.75 mi
Loading nearby amenities…
Taxation est. · year 1
- Rental income
- $23,559
- − Mortgage interest
- −$5,490
- − Property taxes
- −$2,258
- − Insurance
- −$490
- − Repairs & maintenance
- −$1,885
- − Management
- −$1,885
- − Depreciation
- −$2,851
- Taxable income
- $8,701
- Est. tax owed @ 24.0%
- −$2,088
- After-tax cash flow
- $7,609/yr
For passive investors: Depreciation is non-cash, so a rental often shows a tax loss while cash-flowing — sheltering income. Rental losses are passive: they offset passive income freely, and up to $25,000/yr can offset ordinary (W-2) income if you actively participate and your MAGI is under $100k (phasing out to $0 by $150k); unused losses carry forward. On sale, claimed depreciation is recaptured at up to 25%, and gains may owe capital-gains tax (a 1031 exchange can defer both). Figures are a year-1 estimate at your 24.0% rate — not tax advice; consult a CPA.
Schools (NCES district)
- District
- Utica City School District
- NCES district ID
- 3629370
- Math proficiency
- 33% ▼ -7.00%
- Reading proficiency
- 38% ▲ 2.00%
- Median HH income
- $31,834
- Composite
- 29.01/100
- National rank
- #6613
- State rank
- #562 of 590 in NY
Livability — Utica
- Score
- 80/100
- State rank
- #104
- US rank
- #1589
Category grades
Schools grade is shown separately in the Schools card above.
Census & demographics
- Census place
- Utica, NY
- County
- Oneida County · 89,710 people
- City population
- 72,968
- Metro
- Utica-Rome, NY
- Population (ZIP)
- 34,037
- Household income
- $57,835
- Rent vs Own
- Severe rent burden
- 1604.0
Population outlook (Oneida County) Hauer SSP2
- Today (2025)
- 225,223 people
- By 2030
- 220,384 · -2.1%
- By 2040
- 209,071 · -7.2%
- By 2050
- 197,920 · -12.1%
- By 2075
- 175,541 · -22.1%
- By 2100
- 148,491 · -34.1%
Race, ethnicity, and origin ACS 2023
- Neighborhood character
- Predominantly White (71%)
- Race & ethnicity
- White 71% Hispanic / Latino 11% Black 9% Two or more races 7% Asian 5%
- Hispanic origin (detail)
- Mexican 2% Puerto Rican 5% Dominican 2%
- Common ancestry
- Romanian 11% Lithuanian 3% American 2%
- Foreign-born
- 12% · Canada, Philippines, China
- Languages at home
- 81% English-only · Spanish 7% Russian/Polish/Slavic 4% Other Asian/Pacific 3%
Political lean MEDSL · Oneida
- 2024 margin
- Strong R (+21.3) · D 39.4% · R 60.6%
- 2008→2024 swing
- -15.2pp toward R · 2008: -6.1pp · 2024: -21.3pp
- All cycles
- 2024: R+21.3 2020: R+15.5 2016: R+21.1 2012: R+5.3 2008: R+6.1
Not yet ingested
- Civics
- —
Market trends
- HPI YoY
- ▼ -50.76%
- Current HPI
- 368.3955
- Rent YoY
- —
- Metro
- Utica-Rome, NY
- State GDP YoY
- ▲ 2.60%
- F500 in state
- 92
Industry mix (Fortune 500 HQ in NY)
| Industry | F500 HQs | Revenue |
|---|---|---|
| Financial Services | 10 | $950B |
|
||
| Consumer Goods | 9 | $162B |
|
||
| Insurance | 4 | $225B |
|
||
| Telecommunications | 2 | $144B |
|
||
| Pharmaceuticals | 2 | $112B |
|
||
| Media / Entertainment | 2 | $69B |
|
||
Price history
-30.0% since first listed5 events — show timeline
- 2026-02-14 Pending — CNYIS
- 2026-02-03 Price Changed $98,000 CNYIS
- 2025-12-25 Price Changed $126,000 CNYIS
- 2025-11-24 Price Changed $133,000 CNYIS
- 2025-10-25 Listed $140,000 CNYIS
Property tax history
+2.3%/yrLatest (2025): $2,258 · +8.1% YoY. Source: county tax records.
Cash-flow waterfall
monthlySold comps — $/sqft
last 12 mo · ≤1 miLoading sold comps…