2302 R St SE #80 · Auburn, WA
Flood risk 4/10 · Minor
- FEMA flood zone
- X (unshaded)
- Chance of flooding over 30 yrs
- 0.22%
- Est. flood insurance / yr
- $507 – $1,088
Fire risk 1/10 · Minimal
- Est. fire insurance / yr
- $604 – $1,122
Heat risk 3/10 · Minor
- Hot days now (above 87°F)
- 7 days/yr
- Hot days in 30 yrs
- 14 days/yr
Wind risk 1/10 · Minimal
- Chance of severe wind over 30 yrs
- —
Air-quality risk 7/10 · Major
- Unhealthy air days now
- 10 days/yr
- Unhealthy air days in 30 yrs
- 11 days/yr
Risk factors via First Street. Map © Google.
Why this score? — see what drove the B+ grade
The composite is a weighted blend of 9 inputs, each scored 0–100. Each bar is that input's sub-score; the figure is the points it added to the 100-point composite (weight × sub-score).
- Cash flow +30.0/30.0
- ARV discount +15.0/15.0
- 1% rule +10.0/10.0
- DSCR +10.0/10.0
- Schools +4.7/10.0
- Livability +4.0/5.0
- Rent growth +3.6/5.0
- Condition / age +2.2/5.0
- Appreciation +0.0/10.0
$71,200
🖨 Deal sheet 📄 Offer letter ✓ Due diligence
Listing remarks
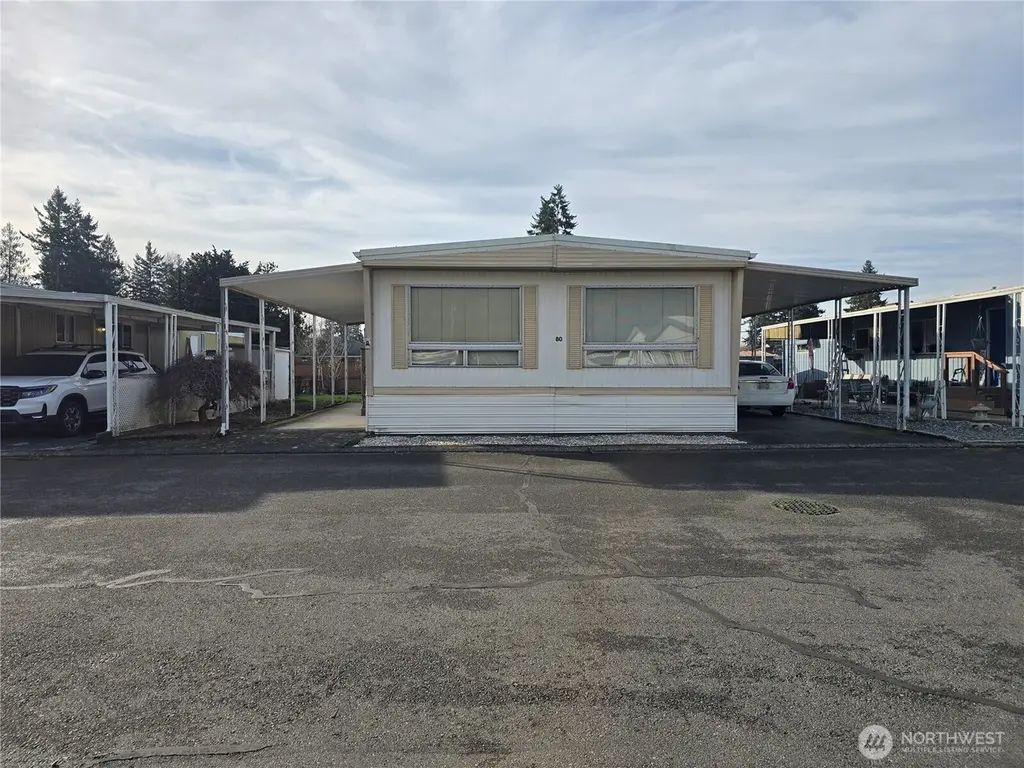
Leisure Manor 55+ gated community offers this well maintained 2 bedroom / 2 bath home with 1,440sqft. Spacious living room offers large windows for ample natural light year round. Dining room with built-in hutch, great for seasonal storage! Spacious kitchen with breakfast bar, lots of cabinets for storage, gas cooktop, cabinet oven, dishwasher and microwave. Living room off the kitchen with wet bar and open cabinets to display cherished items. 3/4 guest bath with large vanity just off entry and connects to front large front bedroom. Continue to the oversized primary with 2 large windows that allow for tons of natural light, 2 great size closets, with vanity counter and mirror and attached
Key facts
- 2 parking spots
- Community pool
- Built 1968
Property features AI
Finance
- Financial info: Listing terms: Cash or Conventional
- HOA & community: Located in Leisure Manor (manufactured home park); Park amenities: Clubhouse, common area, exercise room, pool, recreational area, RV parking, security gate; Park approved for sale; Senior community; Pets: see remarks; Land lease: $1,075
Exterior
- Parking: Carport; Carport present
- Security: Security gate
- Utilities: Electric and natural gas service; Public water (billed by park); Sewer billed by park; Electric water heater located in closet; Xfinity cable and internet
- Home design: Manufactured home (double wide); One level; Faces east; Good condition; Manufactured model NEWP 60THT/24; Style: Manufactured double wide
- Construction: Metal roof; Metal/vinyl construction; Vinyl skirting; Pillar/Post/Pier foundation; Mobile home remains on site
- Exterior features: Metal/vinyl exterior; Cul-de-sac lot; Paved access; Storage at side/back of carports
Interior
- Kitchen: Dishwasher; Garbage disposal; Double oven; Microwave; Refrigerator; Stove/Range
- Bedrooms: 2 bedrooms
- Flooring: Vinyl; Carpet
- Bathrooms: 1 full bath; 1 three-quarter bath; 1 bathtub; 2 showers
- Heating & cooling: Forced air heating; No central cooling listed
- Interior features: Water heater; Wet bar; Drapes
- Laundry & utility: Washer; Dryer; Utility room
Neighborhood map
What this means for you Summary
Snapshot
- This is a 2-bed/2.0-bath manufactured listed at $71k. Condition is rated fair.
Deal economics
- At list price, monthly cash flow is $1k ($14k/yr) — positive.
- The deal already cash-flows at list — no discount required.
- Meets the 1% rule at list price ($2k rent vs $71k).
- Recommended offer: $69k (3.0% below list) — sets the bar for market timing.
- Cap rate 26.1% vs local median 2.7% in Auburn — top-decile yield for the area; either an underpriced asset or a hidden risk that comps aren't pricing in. Stress-test before assuming the spread holds.
Location & tenants
- Location reads 81/100 on livability (#75 in WA, #1,371 nationally) — a professional / high-income tenant draw. Strengths: amenities A+, commute A+, employment A+; Watch: crime F, cost of living F.
- Auburn School District (urban): math 47% / reading 56% proficiency, ranked #125 of 291 in WA (top 43%) — acceptable for families but not a draw, mixed tenant base, ~2y average lease.
- Market conditions: Rents rising fast (+4.3%/yr); 223 active listings in the ZIP; 14 comparable units currently listed for rent nearby; rentals leasing fast (median 13d on market — plan ~1-2 weeks tenant-placement turnaround); high-income renter base; 10,555 units permitted in King County in 2024 (7,119 in 5+ unit buildings).
Forward outlook
- Local home prices are declining (-3.0%/yr); year-one equity from $492 of loan paydown is wiped out by about $2k of value loss. Plan a longer hold.
- King County population projected at +44% by 2050 — long-run rental-demand tailwind backs the buy-and-hold thesis.
- At projected returns (-3.0% appreciation + 4.3% rent growth), your $20k cash investment doubles in ~2 years — after that, you're playing with house money.
Negotiation context
- It's been on market 43 days — a 3% lower offer ($69k) is reasonable based on typical stale-listing flexibility.
Questions for the listing agent
- It's been on market 43 days. Have you received any prior offers? Is the seller open to a 3% concession, seller financing, or rate buy-down credit?
- Have any recent inspections been done? Can we get a copy of the seller's disclosures and any deferred-maintenance estimates?
- Built in 1968 — when were the roof, HVAC, electrical panel, plumbing, and water heater last replaced?
- Is there a deadline driving the sale (1031 exchange, divorce, estate, relocation)? That informs how much negotiation room exists.
- Crime grade is F in this area — have there been break-ins, vandalism, or insurance claims at this property in the last 3 years? What carrier currently insures it and at what premium?
- What's the average days-on-market for RENTAL listings here right now (not sales)? A rising rental-DOM trend means longer vacancies and softer asking-rent achievability than the comps imply.
- What's the recent tenant-quality profile in this submarket — average credit score on applications, eviction rate, late-payment / NSF rate, and stable-employment percentage? A property-management company in the area should have these aggregated.
- How much new for-sale + rental construction is in the pipeline within 1–3 miles? Heavy new supply typically softens prices + rents 12–24 months out; constrained supply supports both.
Investment metrics
- 1% rule
- 2.96% ✓
- Cap rate
- 26.08%
- Cash-on-cash
- 70.66%
- DSCR
- 4.14
- GRM
- 2.8
CMA / ARV
- ARV (on-the-fly)
- $92,160
- Comps found
- 9
Show comp detail 9 sales within ~0.75 mi
| Address | Dist | Beds/Ba | Sqft | Sold | Price | $/sf | Match |
|---|---|---|---|---|---|---|---|
| 2302 R St SE #11 | 0.00mi | 2/2.0 | 1,440 (0%) | 17mo | $85,900 | $60 | 86 |
| 2302 R St SE #128 | 0.00mi | 2/2.0 | 1,248 (-13%) | 10mo | $80,000 | $64 | 69 |
| 2302 R St SE #116 | 0.08mi | 2/2.0 | 1,344 (-7%) | 21mo | $86,000 | $64 | 68 |
| 900 29th St SE Unit E-22 | 0.68mi | 3/2.0 (+1) | 1,440 (0%) | 8mo | $50,000 | $35 | 57 |
| 800 29th St SE Unit G16 | 0.69mi | 3/2.0 (+1) | 1,440 (0%) | 23mo | $78,000 | $54 | 44 |
| 3225 M St SE #144 | 0.62mi | 3/2.0 (+1) | 1,248 (-13%) | 3mo | $155,000 | $124 | 42 |
| 3225 M St SE #121 | 0.71mi | 3/2.0 (+1) | 1,344 (-7%) | 15mo | $149,000 | $111 | 38 |
| 3225 M St SE #145 | 0.71mi | 3/2.0 (+1) | 1,254 (-13%) | 7mo | $105,000 | $84 | 34 |
| 3225 M St SE #137 | 0.71mi | 3/2.0 (+1) | 1,232 (-14%) | 17mo | $72,000 | $58 | 24 |
Match score weights: distance 35% · size 25% · config 20% · recency 20%. Top-matched comps best support the ARV.
Projected returns pro-forma
-3.0% appreciation · 4.32% rent growth · sell at horizon
- IRR
- 71.7%
- Equity multiple
- 4.32×
- Total profit
- $66,099
- Equity at exit
- $10,616
- IRR
- 76.0%
- Equity multiple
- 9.32×
- Total profit
- $165,924
- Equity at exit
- $6,156
Cash invested: $19,936 (down + closing). Projections, not guarantees.
Landlord ↔ Tenant lean methodology
- Overall (STATE)
- 28 Tenant-Leaning
- State Washington
- 28 Tenant-Leaning · D+8
- County
- — inherits STATE
- City
- — inherits STATE
ZIP-level market 98022
- Rents YoY
- 4.3%
- Active inventory
- 223
- Price-to-rent
- 2.8×
Monthly cashflow live
- Estimated rent
- $2,109 high interval (Pro) →
- Mortgage (P&I)
- −$373
- Tax est. 1.5%
- −$89 /mo · $1,068/yr
- Insurance
- −$30
- HOA
- −$0
- Vacancy / Maint / Mgmt
- −$443
- Net cashflow
- $1,174
Break-even live
UW: 25.0% down · 7.5% · 30yr · 1.5% tax · 5.0% vac · 8.0% maint · 8.0% mgmt
Financing live
Cash to close
- Down payment
- $17,800
- Closing costs
- $2,136
- Reserves months
- —
- Total cash needed
- —
Loan-product check · same deal, 3 products live
Conventional
25% down · 7.5% · 30yr
- Down + closing
- —
- Monthly P&I
- —
- Monthly cashflow
- —
- DSCR
- —
- Eligible?
- —
Personal DTI + credit; lowest rate.
DSCR
20% down · 8.5% · 30yr
- Down + closing
- —
- Monthly P&I
- —
- Monthly cashflow
- —
- DSCR
- —
- Eligible?
- —
No personal income docs; deal must DSCR.
Hard money
10% down · 12.0% · 12mo
- Down + closing
- —
- Monthly P&I
- —
- Monthly cashflow
- —
- DSCR
- —
- Eligible?
- —
Short-term bridge; refi at stabilization.
Rent comps 14 comps
| Address | Beds | Baths | Sqft | Rent | $/sqft | DOM | Units | Dist |
|---|---|---|---|---|---|---|---|---|
| 1910 N Ct SE Auburn, WA | 3.0 | 2.0 | 1570 | $2,900 | $1.85 | 10d | 1 | 0.34mi |
| 1526 29th St SE Auburn, WA | 2.0 | 1.0 | 912 | $1,595 | $1.75 | 24d | 1 | 0.43mi |
| 2952 O St SE Unit F Auburn, WA | 2.0 | 1.0 | 1051 | $1,495 | $1.42 | 1d | 1 | 0.46mi |
| 2455 F St SE Auburn, WA | 1.0–3.0 | 1.0–2.0 | 757 | $1,678 | $2.21 | 2d | 6 | 0.79mi |
| 404 27th St SE Unit 19-1 Auburn, WA | 2.0 | 1.0 | 1000 | $1,750 | $1.75 | 12d | 1 | 0.87mi |
| 418 17th St SE Unit 6C Auburn, WA | 2.0 | 2.0 | 1219 | $2,200 | $1.80 | 24d | 1 | 0.88mi |
| 1014 37th St SE Apt 4 Auburn, WA | 2.0 | 2.0 | 1005 | $1,780 | $1.77 | 4d | 1 | 0.95mi |
| 3320 Auburn Way S Auburn, WA | 2.0 | 1.5 | 1033 | $2,200 | $2.13 | 1d | 1 | 1.03mi |
| 330 V St SE Unit 1 Auburn, WA | 2.0 | 1.0 | 950 | $2,400 | $2.53 | 21d | 1 | 1.19mi |
| 2220 Noble Ct SE Auburn, WA | 2.0 | 1.5–2.0 | 1200 | $2,100 | $1.75 | 1d | 2 | 1.24mi |
| 225 I St SE Unit 225 Auburn, WA | 2.0 | 1.0 | 980 | $2,100 | $2.14 | 14d | 1 | 1.33mi |
| 107 N St SE Unit A Auburn, WA | 2.0 | 1.0 | 1080 | $1,750 | $1.62 | 21d | 1 | 1.34mi |
| 29 R St NE Unit A Auburn, WA | 2.0 | 1.0 | 900 | $1,695 | $1.88 | 24d | 1 | 1.47mi |
| 4704 Mill Pond Dr SE #213 Auburn, WA | 2.0 | 2.0 | 1142 | $2,750 | $2.41 | 2d | 1 | 1.49mi |
Listing history 15 events
-
2026-06-18days on market $71,200 Active 43 DOM
-
2026-06-17days on market $71,200 Active 42 DOM
-
2026-06-16days on market $71,200 Active 41 DOM
-
2026-06-15days on market $71,200 Active 40 DOM
-
2026-06-13days on market $71,200 Active 38 DOM
-
2026-06-13days on market $71,200 Active 37 DOM
-
2026-06-09days on market $71,200 Active 34 DOM
-
2026-06-08days on market $71,200 Active 33 DOM
-
2026-06-07days on market $71,200 Active 32 DOM
-
2026-06-04days on market $71,200 Active 29 DOM
-
2026-06-03days on market $71,200 Active 28 DOM
-
2026-06-02days on market $71,200 Active 27 DOM
-
2026-06-01days on market $71,200 Active 26 DOM
-
2026-05-31days on market $71,200 Active 25 DOM
-
2026-05-06$71,200 Active
ⓘ Source: listings_history table (triggers on properties + properties_extension) + one-shot
backfill from property_details.listing_events for pre-trigger history.
Climate risk First Street
- Flood 4/10 Moderate FEMA zone X (unshaded) · 22% chance over 30 yrs
- Wildfire 1/10 Low
- Heat 3/10 Moderate 7 d/yr ≥87°F today · 14 d/yr by 30 yrs out
- Wind 1/10 Low
- Air quality 7/10 Severe 10 unhealthy d/yr today · 11 by 30 yrs out
Nearby sold comps map
Loading sold comps map…
Walkable amenities ~0.75 mi
Loading nearby amenities…
Taxation est. · year 1
- Rental income
- $25,306
- − Mortgage interest
- −$3,988
- − Property taxes
- −$1,068
- − Insurance
- −$356
- − Repairs & maintenance
- −$2,024
- − Management
- −$2,024
- − Depreciation
- −$2,071
- Taxable income
- $13,773
- Est. tax owed @ 24.0%
- −$3,306
- After-tax cash flow
- $10,781/yr
For passive investors: Depreciation is non-cash, so a rental often shows a tax loss while cash-flowing — sheltering income. Rental losses are passive: they offset passive income freely, and up to $25,000/yr can offset ordinary (W-2) income if you actively participate and your MAGI is under $100k (phasing out to $0 by $150k); unused losses carry forward. On sale, claimed depreciation is recaptured at up to 25%, and gains may owe capital-gains tax (a 1031 exchange can defer both). Figures are a year-1 estimate at your 24.0% rate — not tax advice; consult a CPA.
Condition & rehab AI · 12 photos
This manufactured home requires significant repairs and updates to improve its condition and value. The exterior siding and interior walls are in poor condition, and the flooring, kitchen, and bathrooms need major upgrades. Painting, replacing carpet, and updating the kitchen and bathrooms would significantly enhance its resale and rental value.
Repairs flagged
- Major exterior siding — Significant wear and tear
- Major interior walls — Worn wood paneling and peeling paint
- Major flooring — Worn carpet with visible stains
- Major kitchen cabinets — Old cabinets and outdated appliances
- Major bathrooms — Small, outdated fixtures
Value-add opportunities
- Resale Paint interior walls — Fresh paint enhances curb appeal
- Resale Replace carpet — New carpet improves comfort and appearance
- Resale Upgrade kitchen cabinets and appliances — Modern kitchen boosts appeal and functionality
- Resale Replace bathroom fixtures — New fixtures enhance bathroom's functionality and appearance
Renovation cost estimate screening
| Repair item | Severity | Est. cost |
|---|---|---|
| exterior siding · Significant wear and tear | Major | $15,000–50,000 |
| interior walls · Worn wood paneling and peeling paint | Major | $15,000–50,000 |
| flooring · Worn carpet with visible stains | Major | $15,000–50,000 |
| kitchen cabinets · Old cabinets and outdated appliances | Major | $15,000–50,000 |
| bathrooms · Small, outdated fixtures | Major | $15,000–50,000 |
| Total estimated repair cost · 5 items | $75,000–250,000 |
Value-add ROI direction
- Resale Paint interior walls — Fresh paint enhances curb appeal ↑
- Resale Replace carpet — New carpet improves comfort and appearance ↑
- Resale Upgrade kitchen cabinets and appliances — Modern kitchen boosts appeal and functionality ↑
- Resale Replace bathroom fixtures — New fixtures enhance bathroom's functionality and appearance ↑
ⓘ Cost ranges are severity-bucket heuristics (US national rule-of-thumb). Get contractor quotes + a written scope before underwriting a rehab budget.
Schools (NCES district)
- District
- Auburn School District
- NCES district ID
- 5300300
- Math proficiency
- 47% ▼ -3.00%
- Reading proficiency
- 56% ▼ -1.00%
- Median HH income
- $58,048
- Composite
- 46.73/100
- National rank
- #5240
- State rank
- #125 of 291 in WA
Livability — Auburn
- Score
- 81/100
- State rank
- #75
- US rank
- #1371
Category grades
Schools grade is shown separately in the Schools card above.
Census & demographics
- Census place
- Auburn, WA
- County
- King County · 2,251,916 people
- City population
- 74,969
- Metro
- Seattle-Tacoma-Bellevue, WA
- Population (ZIP)
- 22,418
- Household income
- $120,406
- Rent vs Own
- Severe rent burden
- 382.0
Population outlook (King County) Hauer SSP2
- Today (2025)
- 2,576,485 people
- By 2030
- 2,803,316 · +8.8%
- By 2040
- 3,255,921 · +26.4%
- By 2050
- 3,706,444 · +43.9%
- By 2075
- 4,746,063 · +84.2%
- By 2100
- 5,407,730 · +109.9%
Race, ethnicity, and origin ACS 2023
- Neighborhood character
- Predominantly White (78%)
- Race & ethnicity
- White 78% Hispanic / Latino 10% Two or more races 9% Asian 2% Native American 2%
- Hispanic origin (detail)
- Mexican 8%
- Common ancestry
- Portuguese 7% Italian 4% Slovak 3%
- Foreign-born
- 6% · Canada
- Languages at home
- 91% English-only · Spanish 6% Other Indo-European 1% German/W. Germanic 1%
Political lean MEDSL · King
- 2024 margin
- Solid D (+51.7) · D 74.2% · R 22.5% · Other 3.4%
- 2008→2024 swing
- +9.6pp toward D · 2008: 42.1pp · 2024: 51.7pp
- All cycles
- 2024: D+51.7 2020: D+52.7 2016: D+50.4 2012: D+39.9 2008: D+42.1
Not yet ingested
- Civics
- —
Market trends
- HPI YoY
- ▼ -605.16%
- Current HPI
- 297.9161
- Rent YoY
- ▲ 4.32%
- Metro
- Seattle-Tacoma-Bellevue, WA
- State GDP YoY
- ▲ 4.65%
- F500 in state
- 22
Industry mix (Fortune 500 HQ in WA)
| Industry | F500 HQs | Revenue |
|---|---|---|
| Retail | 2 | $269B |
|
||
| Technology / Retail | 1 | $638B |
|
||
| Technology | 1 | $245B |
|
||
| Telecommunications | 1 | $38B |
|
||
| Food / Beverage | 1 | $36B |
|
||
| Automotive / Trucks | 1 | $34B |
|
||
Price history
1 event — show timeline
- 2026-05-06 Listed $71,200 NWMLS as Distributed by MLS Grid
Cash-flow waterfall
monthlySold comps — $/sqft
last 12 mo · ≤1 miLoading sold comps…