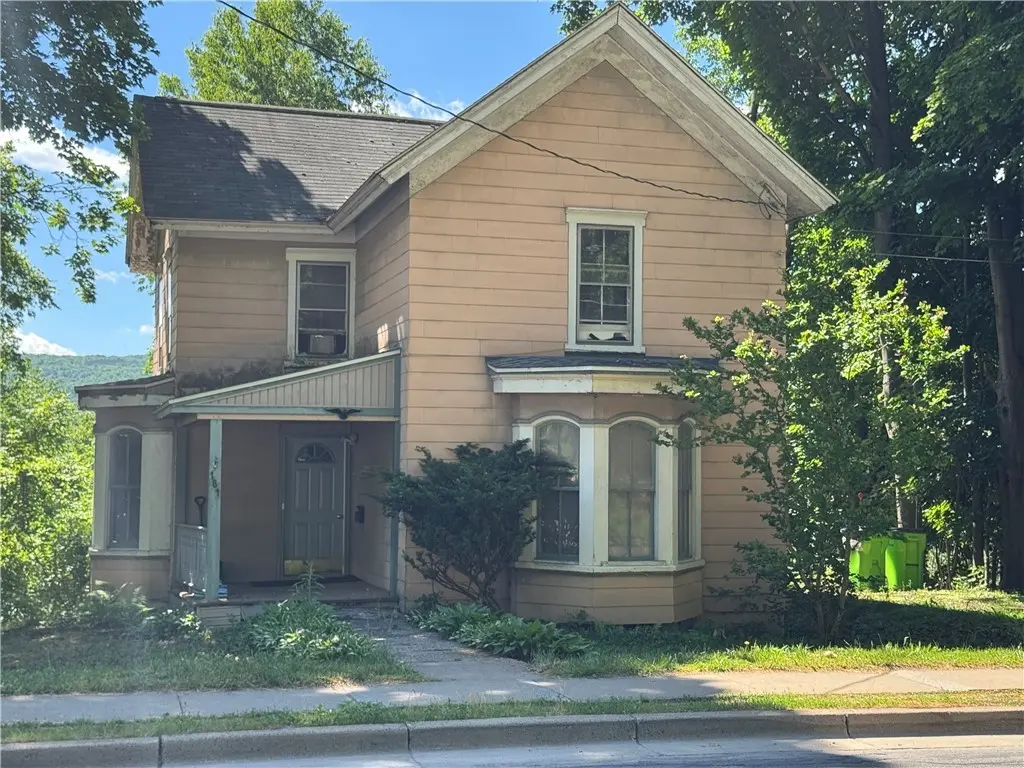
181 Chestnut St · Oneonta, NY
Flood risk 1/10 · Minimal
- FEMA flood zone
- X (unshaded)
- Chance of flooding over 30 yrs
- 0.0%
- Est. flood insurance / yr
- $473 – $860
Fire risk 1/10 · Minimal
- Est. fire insurance / yr
- $691 – $1,283
Heat risk 2/10 · Minimal
- Hot days now (above 93°F)
- 7 days/yr
- Hot days in 30 yrs
- 17 days/yr
Wind risk 2/10 · Minimal
- Chance of severe wind over 30 yrs
- 1.0%
Air-quality risk 1/10 · Minimal
- Unhealthy air days now
- 0 days/yr
- Unhealthy air days in 30 yrs
- 0 days/yr
Risk factors via First Street. Map © Google.
Why this score? — see what drove the B grade
The composite is a weighted blend of 9 inputs, each scored 0–100. Each bar is that input's sub-score; the figure is the points it added to the 100-point composite (weight × sub-score).
- Cash flow +20.3/30.0
- ARV discount +15.0/15.0
- Appreciation +10.0/10.0
- 1% rule +7.6/10.0
- DSCR +6.4/10.0
- Schools +4.3/10.0
- Livability +3.8/5.0
- Rent growth +2.5/5.0
- Condition / age +2.5/5.0
$109,000
🖨 Deal sheet 📄 Offer letter ✓ Due diligence
Listing remarks
Bring your vision and your contractor to this single family home. A 2- story, 1200 sq, ft home sits on . 36 acre lot that iss solid and also livable while making straightforward easy updates. Located in Center-City Oneonta, this 2 bedroom and 1.5 bathroom is conveniently located near all amenities, making it an ideal location. Plenty of off-street parking will greet you at the door. Property is being sold "as is" and inspections will be for buyers knowledge only.
Key facts
- 0.36 acre lot
- Built 1900
- Listed 5 days
Property features AI
Exterior
- Parking: No garage
- Utilities: Electricity connected; Public water connected
- Home design: Two-story existing home
- Construction: Wood siding; Shingle roof; Poured foundation; Built previously (existing)
- Exterior features: Dirt driveway; Irregular lot; Road frontage on a main thoroughfare; Lot dimensions approximately 106 x 140
Interior
- Kitchen: Gas range; Gas oven; Dishwasher; Refrigerator
- Bedrooms: Total rooms: 7; Includes a bonus room
- Flooring: Carpet; Laminate; Varies
- Bathrooms: 2 full bathrooms; 1 half bathroom; One main-level bathroom
- Heating & cooling: Oil heating; Heating present (see remarks)
- Interior features: Ceiling fans; Kitchen island; Partial finished basement
- Laundry & utility: Washer; Dryer; Oil water heater
Neighborhood map
What this means for you Summary
Snapshot
- This is a 2-bed/1.5-bath single-family listed at $109k.
Deal economics
- At list price, monthly cash flow is $140 ($2k/yr) — positive.
- The deal already cash-flows at list — no discount required.
- Meets the 1% rule at list price ($1k rent vs $109k).
- Cap rate 7.8% vs local median 5.5% in Oneonta — top-decile yield for the area; either an underpriced asset or a hidden risk that comps aren't pricing in. Stress-test before assuming the spread holds.
Location & tenants
- Location reads 75/100 on livability (#253 in NY, #4,021 nationally) — a middle-class / working-renter tenant base. Strengths: housing A+, health & safety A+, cost of living B+; Watch: amenities C-, crime F, commute F.
- Oneonta City School District (town): math 46% / reading 57% proficiency, ranked #374 of 590 in NY (top 63%) — acceptable for families but not a draw, mixed tenant base, ~2y average lease.
- Market conditions: 118 active listings in the ZIP; 1 comparable units currently listed for rent nearby; 133 units permitted in Otsego County in 2024 (10 in 5+ unit buildings).
Forward outlook
- In year one you build about $12k of equity ($754 loan paydown + $11k appreciation (10.0% local appreciation)).
- Otsego County population projected at -21% by 2050 — secular population decline; favor cash flow + early exit over multi-decade hold.
- At projected returns (10.0% appreciation + 3.0% rent growth), your $31k cash investment doubles in ~3 years — after that, you're playing with house money.
- By year 4, paydown + projected appreciation supports a ~$41k cash-out refi (75% LTV) — recoverable capital for the next deal without selling this one.
Negotiation context
- Only 6 days on market — expect competitive offers; lowballing is unlikely to land.
Risks & watch-outs
- Watch-outs: property tax is 3.6% of price; built in 1900 — expect roof / HVAC / electrical / plumbing capex.
Questions for the listing agent
- Built in 1900 — when were the roof, HVAC, electrical panel, plumbing, and water heater last replaced?
- Property tax is high relative to price — has the assessment been appealed recently, and will the sale trigger a re-assessment?
- Is there a deadline driving the sale (1031 exchange, divorce, estate, relocation)? That informs how much negotiation room exists.
- Crime grade is F in this area — have there been break-ins, vandalism, or insurance claims at this property in the last 3 years? What carrier currently insures it and at what premium?
- What's the average days-on-market for RENTAL listings here right now (not sales)? A rising rental-DOM trend means longer vacancies and softer asking-rent achievability than the comps imply.
- What's the recent tenant-quality profile in this submarket — average credit score on applications, eviction rate, late-payment / NSF rate, and stable-employment percentage? A property-management company in the area should have these aggregated.
- How much new for-sale + rental construction is in the pipeline within 1–3 miles? Heavy new supply typically softens prices + rents 12–24 months out; constrained supply supports both.
Investment metrics
- 1% rule
- 1.26% ✓
- Cap rate
- 7.83%
- Cash-on-cash
- 5.50%
- DSCR
- 1.24
- GRM
- 6.6
CMA / ARV
- ARV (on-the-fly)
- $151,200
- Comps found
- 12
Show comp detail 12 sales within ~0.75 mi
| Address | Dist | Beds/Ba | Sqft | Sold | Price | $/sf | Match |
|---|---|---|---|---|---|---|---|
| 14 Thorn St | 0.30mi | 3/2.0 (+1) | 1,176 (-2%) | 11mo | $126,000 | $107 | 66 |
| 162 Chestnut St | 0.08mi | 3/2.0 (+1) | 1,370 (+14%) | 4mo | $50,000 | $36 | 62 |
| 5 Birch St | 0.58mi | 3/1.0 (+1) | 1,198 (-0%) | 6mo | $150,000 | $125 | 61 |
| 6 Cleveland St | 0.51mi | 2/1.5 | 1,092 (-9%) | 5mo | $185,000 | $169 | 57 |
| 21 Cherry St | 0.51mi | 3/2.0 (+1) | 1,288 (+7%) | 3mo | $161,000 | $125 | 54 |
| 5 Bronk St | 0.55mi | 3/1.0 (+1) | 1,152 (-4%) | 11mo | $145,000 | $126 | 51 |
| 173 River St | 0.59mi | 2/1.0 | 1,051 (-12%) | 3mo | $90,000 | $86 | 47 |
| 1 Pearl St | 0.48mi | 3/1.0 (+1) | 1,064 (-11%) | 6mo | $135,000 | $127 | 47 |
| 15 Church St | 0.51mi | 3/1.0 (+1) | 1,344 (+12%) | 4mo | $220,000 | $164 | 46 |
| 12 Brook St | 0.73mi | 2/1.5 | 1,330 (+11%) | 4mo | $208,500 | $157 | 44 |
| 74 S Main St | 0.74mi | 3/1.0 (+1) | 1,100 (-8%) | 10mo | $75,000 | $68 | 36 |
| 24 Spruce St | 0.71mi | 3/1.0 (+1) | 1,350 (+12%) | 5mo | $185,000 | $137 | 35 |
Match score weights: distance 35% · size 25% · config 20% · recency 20%. Top-matched comps best support the ARV.
Projected returns pro-forma
10.0% appreciation · 3.0% rent growth · sell at horizon
- IRR
- 28.3%
- Equity multiple
- 3.24×
- Total profit
- $68,410
- Equity at exit
- $98,196
- IRR
- 24.7%
- Equity multiple
- 7.38×
- Total profit
- $194,732
- Equity at exit
- $211,763
Cash invested: $30,520 (down + closing). Projections, not guarantees.
Landlord ↔ Tenant lean methodology
- Overall (STATE)
- 15 Strongly Tenant-Friendly
- State New York
- 15 Strongly Tenant-Friendly · D+10
- County
- — inherits STATE
- City
- — inherits STATE
ZIP-level market 13820
- Home prices YoY
- 22.7%
- Active inventory
- 118
- Price-to-rent
- 6.6×
Monthly cashflow live
- Estimated rent
- $1,377 medium interval (Pro) →
- Mortgage (P&I)
- −$572
- Tax from tax record
- −$331 /mo · $3,975/yr
- Insurance
- −$45
- HOA
- −$0
- Vacancy / Maint / Mgmt
- −$289
- Net cashflow
- $140
Break-even live
UW: 25.0% down · 7.5% · 30yr · 1.5% tax · 5.0% vac · 8.0% maint · 8.0% mgmt
Financing live
Cash to close
- Down payment
- $27,250
- Closing costs
- $3,270
- Reserves months
- —
- Total cash needed
- —
Loan-product check · same deal, 3 products live
Conventional
25% down · 7.5% · 30yr
- Down + closing
- —
- Monthly P&I
- —
- Monthly cashflow
- —
- DSCR
- —
- Eligible?
- —
Personal DTI + credit; lowest rate.
DSCR
20% down · 8.5% · 30yr
- Down + closing
- —
- Monthly P&I
- —
- Monthly cashflow
- —
- DSCR
- —
- Eligible?
- —
No personal income docs; deal must DSCR.
Hard money
10% down · 12.0% · 12mo
- Down + closing
- —
- Monthly P&I
- —
- Monthly cashflow
- —
- DSCR
- —
- Eligible?
- —
Short-term bridge; refi at stabilization.
Rent comps 1 comps
| Address | Beds | Baths | Sqft | Rent | $/sqft | DOM | Units | Dist |
|---|---|---|---|---|---|---|---|---|
| 120 River St Oneonta, NY | 2.0 | 1.0 | 700 | $1,250 | $1.79 | 44d | 1 | 0.41mi |
Listing history 8 events
-
2026-06-19days on market $109,000 Active 6 DOM
-
2026-06-18days on market $109,000 Active 5 DOM
-
2026-06-17days on market $109,000 Active 4 DOM
-
2026-06-16days on market $109,000 Active 3 DOM
-
2026-06-15remarks 467-char remark
-
2026-06-15days on market $109,000 Active 2 DOM
-
2026-06-14remarks 451-char remark
-
2026-06-14$109,000 Active 1 DOM
ⓘ Source: listings_history table (triggers on properties + properties_extension) + one-shot
backfill from property_details.listing_events for pre-trigger history.
Tax reassessment forecast NY · Partial reset (capped growth)
- Current annual tax
- $3,975 · $331/mo
- Projected year-2 tax
- $3,975 · $331/mo
- Expected delta
- $0/yr ($0/mo · 0.0%)
ⓘ Screening estimate from a state-policy table — verify with the county assessor before closing.
Climate risk First Street
- Flood 1/10 Low FEMA zone X (unshaded) · 0% chance over 30 yrs
- Wildfire 1/10 Low
- Heat 2/10 Low 7 d/yr ≥93°F today · 17 d/yr by 30 yrs out
- Wind 2/10 Low 100% chance of damaging wind over 30 yrs
- Air quality 1/10 Low 0 unhealthy d/yr today · 0 by 30 yrs out
Nearby sold comps map
Loading sold comps map…
Walkable amenities ~0.75 mi
Loading nearby amenities…
Taxation est. · year 1
- Rental income
- $16,528
- − Mortgage interest
- −$6,106
- − Property taxes
- −$3,975
- − Insurance
- −$545
- − Repairs & maintenance
- −$1,322
- − Management
- −$1,322
- − Depreciation
- −$3,171
- Taxable income
- $87
- Est. tax owed @ 24.0%
- −$21
- After-tax cash flow
- $1,657/yr
For passive investors: Depreciation is non-cash, so a rental often shows a tax loss while cash-flowing — sheltering income. Rental losses are passive: they offset passive income freely, and up to $25,000/yr can offset ordinary (W-2) income if you actively participate and your MAGI is under $100k (phasing out to $0 by $150k); unused losses carry forward. On sale, claimed depreciation is recaptured at up to 25%, and gains may owe capital-gains tax (a 1031 exchange can defer both). Figures are a year-1 estimate at your 24.0% rate — not tax advice; consult a CPA.
Schools (NCES district)
- District
- Oneonta City School District
- NCES district ID
- 3621780
- Math proficiency
- 46% ▼ -2.00%
- Reading proficiency
- 57% ▲ 14.00%
- Median HH income
- $41,631
- Composite
- 43.19/100
- National rank
- #3066
- State rank
- #374 of 590 in NY
Livability — Oneonta
- Score
- 75/100
- State rank
- #253
- US rank
- #4021
Category grades
Schools grade is shown separately in the Schools card above.
Census & demographics
- Census place
- Oneonta, NY
- County
- Otsego County · 23,056 people
- City population
- 23,056
- Metro
- Oneonta, NY
- Population (ZIP)
- 23,056
- Household income
- $65,953
- Rent vs Own
- Severe rent burden
- 662.0
Population outlook (Otsego County) Hauer SSP2
- Today (2025)
- 57,987 people
- By 2030
- 55,403 · -4.5%
- By 2040
- 50,336 · -13.2%
- By 2050
- 45,715 · -21.2%
- By 2075
- 38,769 · -33.1%
- By 2100
- 33,468 · -42.3%
Race, ethnicity, and origin ACS 2023
- Neighborhood character
- Predominantly White (84%)
- Race & ethnicity
- White 84% Hispanic / Latino 6% Black 5% Two or more races 5% Asian 2%
- Hispanic origin (detail)
- Puerto Rican 2%
- Common ancestry
- Romanian 4% Slovak 2% Lithuanian 2%
- Foreign-born
- 5% · Canada, China
- Languages at home
- 94% English-only · Spanish 3% Russian/Polish/Slavic 1% Other Indo-European 1%
Political lean MEDSL · Otsego
- 2024 margin
- Lean R (+7.9) · D 46.1% · R 53.9%
- 2008→2024 swing
- -13.8pp toward R · 2008: 5.9pp · 2024: -7.9pp
- All cycles
- 2024: R+7.9 2020: R+5.0 2016: R+13.0 2012: D+2.0 2008: D+5.9
Not yet ingested
- Civics
- —
Market trends
- HPI YoY
- ▲ 67.86%
- Current HPI
- 366.3391
- Rent YoY
- —
- Metro
- Oneonta, NY
- State GDP YoY
- ▲ 2.60%
- F500 in state
- 92
Industry mix (Fortune 500 HQ in NY)
| Industry | F500 HQs | Revenue |
|---|---|---|
| Financial Services | 10 | $950B |
|
||
| Consumer Goods | 9 | $162B |
|
||
| Insurance | 4 | $225B |
|
||
| Telecommunications | 2 | $144B |
|
||
| Pharmaceuticals | 2 | $112B |
|
||
| Media / Entertainment | 2 | $69B |
|
||
Price history
1 event — show timeline
- 2026-06-12 Listed $109,000 UNYREIS
Property tax history
+3.0%/yrLatest (2025): $3,975 · +5.5% YoY. Source: county tax records.
Cash-flow waterfall
monthlySold comps — $/sqft
last 12 mo · ≤1 miLoading sold comps…