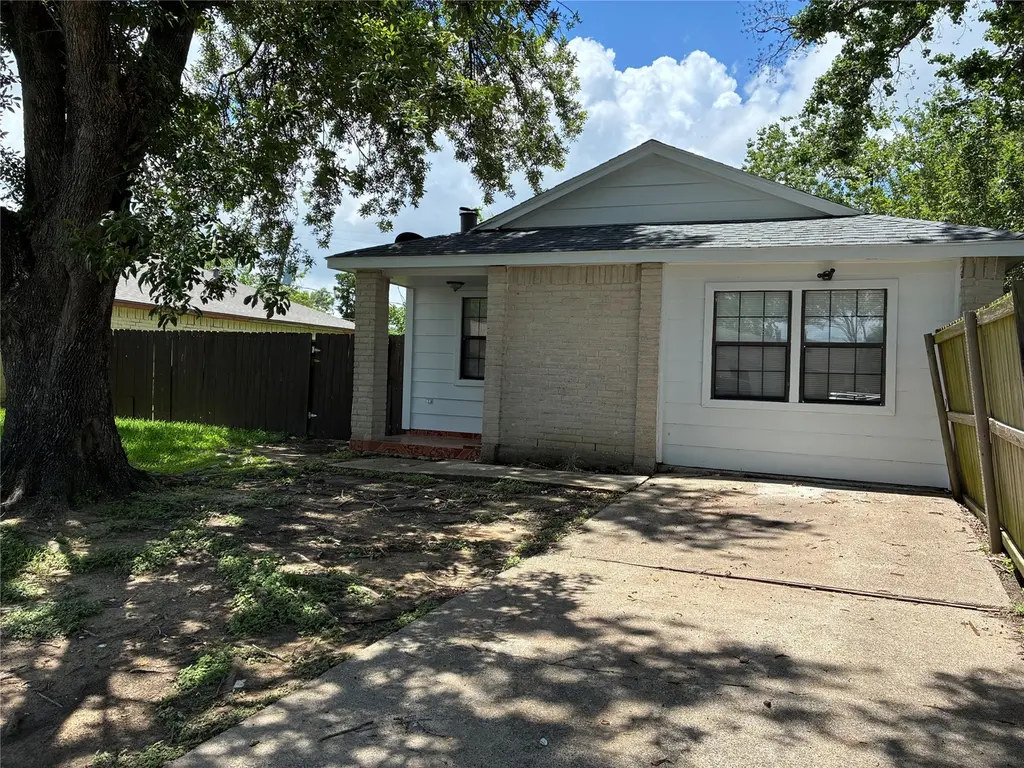
5315 Gayla Ln · Baytown, TX
Flood risk 8/10 · Major
- FEMA flood zone
- X (shaded)
- Chance of flooding over 30 yrs
- 0.99%
- Est. flood insurance / yr
- $507 – $1,088
Fire risk 1/10 · Minimal
- Est. fire insurance / yr
- $1,222 – $2,270
Heat risk 9/10 · Severe
- Hot days now (above 109°F)
- 7 days/yr
- Hot days in 30 yrs
- 24 days/yr
Wind risk 9/10 · Severe
- Chance of severe wind over 30 yrs
- 99.0%
Air-quality risk 2/10 · Minimal
- Unhealthy air days now
- 1 days/yr
- Unhealthy air days in 30 yrs
- 2 days/yr
Risk factors via First Street. Map © Google.
Why this score? — see what drove the F grade
The composite is a weighted blend of 9 inputs, each scored 0–100. Each bar is that input's sub-score; the figure is the points it added to the 100-point composite (weight × sub-score).
- Cash flow +7.3/30.0
- Livability +3.5/5.0
- Schools +3.2/10.0
- Rent growth +2.9/5.0
- 1% rule +2.6/10.0
- Condition / age +2.5/5.0
- DSCR +1.5/10.0
- ARV discount +0.0/15.0
- Appreciation +0.0/10.0
$189,900
🖨 Deal sheet 📄 Offer letter ✓ Due diligence
Listing remarks MLS
3-bedroom, 2-bath home in an established Baytown neighborhood with strong rental and resale demand. Property has significant foundation issues and will need full repairs; seller has a foundation bid available. Being sold AS-IS and seller will make no repairs. Great floor plan, good-sized bedrooms and a fenced yard offer solid potential once work is completed. Convenient access to I-10, schools, shopping and employment centers.
Key facts
- Quartz countertops
- Remodeled bathroom
- Tiled floors
Tags
Property features AI
Exterior
- Utilities: Public water; Public sewer
- Home design: Residential property; Single-story (all main rooms on first floor)
- Construction: Built in 1981; Brick and wood siding exterior; Composition roof; Slab foundation
- Exterior features: Back yard fence; Subdivision lot
Interior
- Kitchen: Dishwasher; Disposal; Gas oven and gas range; Free-standing range
- Bedrooms: Primary bedroom on first floor (approx. 15 x 12); Three additional first-floor bedrooms (each approx. 10 x 10)
- Flooring: Carpet; Tile
- Bathrooms: 2 full bathrooms
- Heating & cooling: Central heating (gas); Central electric air conditioning
- Interior features: Wood-burning fireplace; Quartz countertops; Tub/shower
- Laundry & utility: Washer hookup; Electric dryer hookup; Gas dryer hookup
Neighborhood map
What this means for you Summary
Snapshot
- This is a 2-bed/1.5-bath single-family listed at $190k.
Deal economics
- At list price, monthly cash flow is $-316 ($-4k/yr) — negative.
- To cash-flow at today's rent, offer at most $134k (29.4% below list).
- To meet the 1% rule (rent ≥ 1% of price), the offer needs to be $144k (24.3% below list).
- Recommended offer: $134k (29.4% below list) — sets the bar for cash-flow.
Location & tenants
- Location reads 69/100 on livability (#412 in TX) — a middle-class / working-renter tenant base. Strengths: cost of living A+, housing A+; Watch: employment D+, crime F, amenities F.
- Goose Creek CISD (urban): math 37% / reading 36% proficiency, ranked #473 of 826 in TX (top 57%) — families likely to look elsewhere, expect single-tenant / working-renter base with shorter leases; 61% free/reduced lunch — lower-income household profile, screen leases tightly.
- Zoned schools: High Point School (12 students, 75% FRL).
- Market conditions: Rents rising (+1.5%/yr); 612 active listings in the ZIP; 9 comparable units currently listed for rent nearby; rentals lingering (median 44d on market — plan ~5-8 weeks vacancy on turnover, expect pricing pressure); 56% of comp listings sitting > 30 days — soft ceiling on asking rent; 29,883 units permitted in Harris County in 2024 (8,621 in 5+ unit buildings).
Forward outlook
- Local home prices are declining (-3.0%/yr); year-one equity from $1k of loan paydown is wiped out by about $6k of value loss. Plan a longer hold.
- Harris County population projected at +47% by 2050 — long-run rental-demand tailwind backs the buy-and-hold thesis.
Negotiation context
- Only 6 days on market — expect competitive offers; lowballing is unlikely to land.
- 3 sale attempts since 14y ago with the ask held roughly flat each time — persistent listings suggest the price (not the market) is what's stuck; bring a comps-based counter.
Risks & watch-outs
- Watch-outs: flood insurance adds $66/mo.
- Climate carrying-cost: severe flood risk; severe wind risk, 99% chance of damaging wind over 30y; extreme-heat days projected 7→24/yr by 2055 (HVAC capex compounding) — expect insurance premiums to compound above CPI over the hold.
Questions for the listing agent
- What do current leases actually rent for vs. the listed asking? Can we see a recent rent roll and the last 12 months of T-12 income?
- What's the actual annual flood-insurance premium (NFIP or private), and is the property in a SFHA with mandatory coverage?
- Is there a deadline driving the sale (1031 exchange, divorce, estate, relocation)? That informs how much negotiation room exists.
- Schools are D-rated, which usually means shorter tenancies and higher turnover. Who's the typical renter profile here, and what's been the actual vacancy rate?
- Crime grade is F in this area — have there been break-ins, vandalism, or insurance claims at this property in the last 3 years? What carrier currently insures it and at what premium?
- The area grade is low — what's the realistic commute time and amenity access for the typical tenant pool here? Any planned neighborhood developments (good or bad) we should know about?
- What's the average days-on-market for RENTAL listings here right now (not sales)? A rising rental-DOM trend means longer vacancies and softer asking-rent achievability than the comps imply.
- What's the recent tenant-quality profile in this submarket — average credit score on applications, eviction rate, late-payment / NSF rate, and stable-employment percentage? A property-management company in the area should have these aggregated.
- How much new for-sale + rental construction is in the pipeline within 1–3 miles? Heavy new supply typically softens prices + rents 12–24 months out; constrained supply supports both.
Investment metrics
- 1% rule
- 0.76% ✗
- Cap rate
- 4.71%
- Cash-on-cash
- -5.64%
- DSCR
- 0.75
- GRM
- 11.0
CMA / ARV
- ARV (on-the-fly)
- $157,619
- Comps found
- 10
Show comp detail 10 sales within ~0.75 mi
| Address | Dist | Beds/Ba | Sqft | Sold | Price | $/sf | Match |
|---|---|---|---|---|---|---|---|
| 5210 Shirley St | 0.16mi | 3/2.0 (+1) | 1,004 (+3%) | 1mo | $185,000 | $184 | 80 |
| 5212 Willowview Dr | 0.11mi | 2/2.0 | 979 (0%) | 18mo | $74,900 | $77 | 78 |
| 5317 Crestmont St | 0.35mi | 3/1.0 (+1) | 1,013 (+4%) | 10mo | $178,900 | $177 | 63 |
| 5408 Lillian St | 0.19mi | 3/2.0 (+1) | 1,084 (+11%) | 5mo | $110,000 | $101 | 62 |
| 5400 Linda Ln | 0.10mi | 3/2.0 (+1) | 1,122 (+15%) | 11mo | $177,999 | $159 | 55 |
| 5105 Deborah Ln | 0.08mi | 3/2.0 (+1) | 1,122 (+15%) | 13mo | $210,000 | $187 | 54 |
| 5407 Shirley St | 0.22mi | 3/2.0 (+1) | 1,110 (+13%) | 10mo | $179,000 | $161 | 52 |
| 5406 Louise St | 0.21mi | 3/1.0 (+1) | 1,119 (+14%) | 9mo | $165,000 | $147 | 51 |
| 5408 Louise St | 0.23mi | 3/1.0 (+1) | 1,064 (+9%) | 20mo | $179,900 | $169 | 51 |
| 5411 Hazel St | 0.21mi | 3/1.0 (+1) | 1,120 (+14%) | 14mo | $150,118 | $134 | 48 |
Match score weights: distance 35% · size 25% · config 20% · recency 20%. Top-matched comps best support the ARV.
Projected returns pro-forma
-3.0% appreciation · 1.48% rent growth · sell at horizon
- IRR
- -30.6%
- Equity multiple
- 0.00×
- Total profit
- $-52,973
- Equity at exit
- $28,315
- IRR
- -42.3%
- Equity multiple
- -0.51×
- Total profit
- $-80,250
- Equity at exit
- $16,419
Cash invested: $53,172 (down + closing). Projections, not guarantees.
Landlord ↔ Tenant lean methodology
- Overall (STATE)
- 87 Strongly Landlord-Friendly
- State Texas
- 87 Strongly Landlord-Friendly · R+5
- County
- — inherits STATE
- City
- — inherits STATE
ZIP-level market 77521
- Rents YoY
- 1.5%
- Active inventory
- 612
- Price-to-rent
- 11.0×
Monthly cashflow live
- Estimated rent
- $1,438 high interval (Pro) →
- Mortgage (P&I)
- −$996
- Tax from tax record
- −$311 /mo · $3,730/yr
- Insurance
- −$79
- Flood insurance flood zone
- −$66 /mo · $798/yr
- HOA
- −$0
- Vacancy / Maint / Mgmt
- −$302
- Net cashflow
- $-316
Break-even live
UW: 25.0% down · 7.5% · 30yr · 1.5% tax · 5.0% vac · 8.0% maint · 8.0% mgmt
Financing live
Cash to close
- Down payment
- $47,475
- Closing costs
- $5,697
- Reserves months
- —
- Total cash needed
- —
Loan-product check · same deal, 3 products live
Conventional
25% down · 7.5% · 30yr
- Down + closing
- —
- Monthly P&I
- —
- Monthly cashflow
- —
- DSCR
- —
- Eligible?
- —
Personal DTI + credit; lowest rate.
DSCR
20% down · 8.5% · 30yr
- Down + closing
- —
- Monthly P&I
- —
- Monthly cashflow
- —
- DSCR
- —
- Eligible?
- —
No personal income docs; deal must DSCR.
Hard money
10% down · 12.0% · 12mo
- Down + closing
- —
- Monthly P&I
- —
- Monthly cashflow
- —
- DSCR
- —
- Eligible?
- —
Short-term bridge; refi at stabilization.
Rent comps 9 comps
| Address | Beds | Baths | Sqft | Rent | $/sqft | DOM | Units | Dist |
|---|---|---|---|---|---|---|---|---|
| 2906 W Baker Rd Unit 901 Baytown, TX | 2.0 | 2.0 | 1067 | $1,185 | $1.11 | 43d | 1 | 0.94mi |
| 3400 Shady Hill Dr Baytown, TX | 1.0–3.0 | 1.0–2.0 | 1013 | $2,012 | $1.99 | 1d | 21 | 0.99mi |
| 2898 W Baker Rd Baytown, TX | 2.0 | 2.0 | 896 | $1,216 | $1.36 | 43d | 1 | 1.11mi |
| 2806 W Baker Rd Baytown, TX | 1.0 | 1.0 | 724 | $1,000 | $1.38 | 43d | 1 | 1.14mi |
| 2800 W Baker Rd Baytown, TX | 1.0–3.0 | 1.0–2.0 | 988 | $1,455 | $1.47 | 4d | 28 | 1.15mi |
| 2200 W Baker Rd Baytown, TX | 1.0–2.0 | 1.0–2.0 | 863 | $1,664 | $1.93 | 1d | 13 | 1.29mi |
| 2257 W Baker Rd Baytown, TX | 2.0 | 2.0 | 1007 | $1,525 | $1.51 | 43d | 1 | 1.41mi |
| 3300 Rollingbrook Dr Baytown, TX | 1.0–2.0 | 1.0–2.0 | 818 | $1,415 | $1.73 | 1d | 16 | 1.42mi |
| 7515 Bayway Dr Baytown, TX | 1.0 | 1.0 | 650 | $795 | $1.22 | 43d | 1 | 1.48mi |
Listing history 6 events
-
2026-06-18days on market $189,900 Active 6 DOM
-
2026-06-17days on market $189,900 Active 5 DOM
-
2026-06-16days on market $189,900 Active 4 DOM
-
2026-06-15days on market $189,900 Active 3 DOM
-
2026-06-13remarks 164-char remark
-
2026-06-13$189,900 Active 1 DOM
ⓘ Source: listings_history table (triggers on properties + properties_extension) + one-shot
backfill from property_details.listing_events for pre-trigger history.
Tax reassessment forecast TX · Resets to sale price
- Current annual tax
- $3,730 · $311/mo
- Projected year-2 tax
- $3,730 · $311/mo
- Expected delta
- $0/yr ($0/mo · 0.0%)
ⓘ Screening estimate from a state-policy table — verify with the county assessor before closing.
Climate risk First Street
- Flood 8/10 Severe FEMA zone X (shaded) · 99% chance over 30 yrs
- Wildfire 1/10 Low
- Heat 9/10 Extreme 7 d/yr ≥109°F today · 24 d/yr by 30 yrs out
- Wind 9/10 Extreme 99% chance of damaging wind over 30 yrs
- Air quality 2/10 Low 1 unhealthy d/yr today · 2 by 30 yrs out
Nearby sold comps map
Loading sold comps map…
Walkable amenities ~0.75 mi
Loading nearby amenities…
Taxation est. · year 1
- Rental income
- $17,256
- − Mortgage interest
- −$10,637
- − Property taxes
- −$3,730
- − Insurance
- −$1,747
- − Repairs & maintenance
- −$1,381
- − Management
- −$1,381
- − Depreciation
- −$5,524
- Taxable loss
- −$7,144
- Est. tax savings @ 24.0%
- +$1,714
- After-tax cash flow
- $-2,081/yr
For passive investors: Depreciation is non-cash, so a rental often shows a tax loss while cash-flowing — sheltering income. Rental losses are passive: they offset passive income freely, and up to $25,000/yr can offset ordinary (W-2) income if you actively participate and your MAGI is under $100k (phasing out to $0 by $150k); unused losses carry forward. On sale, claimed depreciation is recaptured at up to 25%, and gains may owe capital-gains tax (a 1031 exchange can defer both). Figures are a year-1 estimate at your 24.0% rate — not tax advice; consult a CPA.
Schools (NCES district)
- District
- Goose Creek CISD
- NCES district ID
- 4821150
- Math proficiency
- 37% ▼ -11.00%
- Reading proficiency
- 36% ▼ -4.00%
- Median HH income
- $52,468
- Composite
- 31.84/100
- National rank
- #5877
- State rank
- #473 of 826 in TX
Livability — Baytown
- Score
- 69/100
- State rank
- #412
- US rank
- #8494
Category grades
Schools grade is shown separately in the Schools card above.
Census & demographics
- Census place
- Baytown, TX
- County
- Harris County · 4,702,590 people
- City population
- 135,579
- Metro
- Houston-The Woodlands-Sugar Land, TX
- Population (ZIP)
- 69,038
- Household income
- $73,629
- Rent vs Own
- Severe rent burden
- 2121.0
Population outlook (Harris County) Hauer SSP2
- Today (2025)
- 5,571,493 people
- By 2030
- 6,089,821 · +9.3%
- By 2040
- 7,142,806 · +28.2%
- By 2050
- 8,185,864 · +46.9%
- By 2075
- 10,574,329 · +89.8%
- By 2100
- 12,109,958 · +117.4%
Race, ethnicity, and origin ACS 2023
- Neighborhood character
- Diverse neighborhood (Simpson 0.64)
- Race & ethnicity
- Hispanic / Latino 50% White 28% Two or more races 18% Black 17% Asian 3%
- Hispanic origin (detail)
- Mexican 42% Puerto Rican 2%
- Common ancestry
- Lithuanian 2% Slovak 1%
- Foreign-born
- 20% · Canada, Vietnam
- Languages at home
- 59% English-only · Spanish 36% French/Haitian/Cajun 1% Other Asian/Pacific 1%
Political lean MEDSL · Harris
- 2024 margin
- Lean D (+5.5) · D 52.0% · R 46.4% · Other 1.6%
- 2008→2024 swing
- +3.9pp toward D · 2008: 1.6pp · 2024: 5.5pp
- All cycles
- 2024: D+5.5 2020: D+13.3 2016: D+12.4 2012: D+0.1 2008: D+1.6
Not yet ingested
- Civics
- —
Market trends
- HPI YoY
- ▼ -154.80%
- Current HPI
- 246.1892
- Rent YoY
- ▲ 1.48%
- Metro
- Houston-The Woodlands-Sugar Land, TX
- State GDP YoY
- ▲ 3.95%
- F500 in state
- 110
Industry mix (Fortune 500 HQ in TX)
| Industry | F500 HQs | Revenue |
|---|---|---|
| Energy | 16 | $1,198B |
|
||
| Technology | 5 | $198B |
|
||
| Engineering / Construction | 4 | $72B |
|
||
| Energy Services | 3 | $60B |
|
||
| Utilities | 3 | $41B |
|
||
| Healthcare | 2 | $330B |
|
||
Price history
+644.7% since first listed12 events — show timeline
- 2026-06-12 Listed $189,900 HARMLS
- 2025-12-30 Sold (Public Records) — Public Records
- 2025-12-29 Sold (MLS) — HARMLS
- 2025-12-19 Pending — HARMLS
- 2025-12-15 Price Changed $90,000 HARMLS
- 2025-11-17 Listed $100,000 HARMLS
- 2013-06-25 Sold (Public Records) — Public Records
- 2012-11-19 Sold (MLS) — HARMLS
- 2012-10-12 Listing Removed — HARMLS
- 2012-08-24 Listed $25,500 HARMLS
- 2005-03-08 Sold (Public Records) — Public Records
- 1989-04-17 Sold (Public Records) — Public Records
Property tax history
+7.0%/yrLatest (2025): $3,730 · -8.2% YoY. Source: county tax records.
Cash-flow waterfall
monthlySold comps — $/sqft
last 12 mo · ≤1 miLoading sold comps…