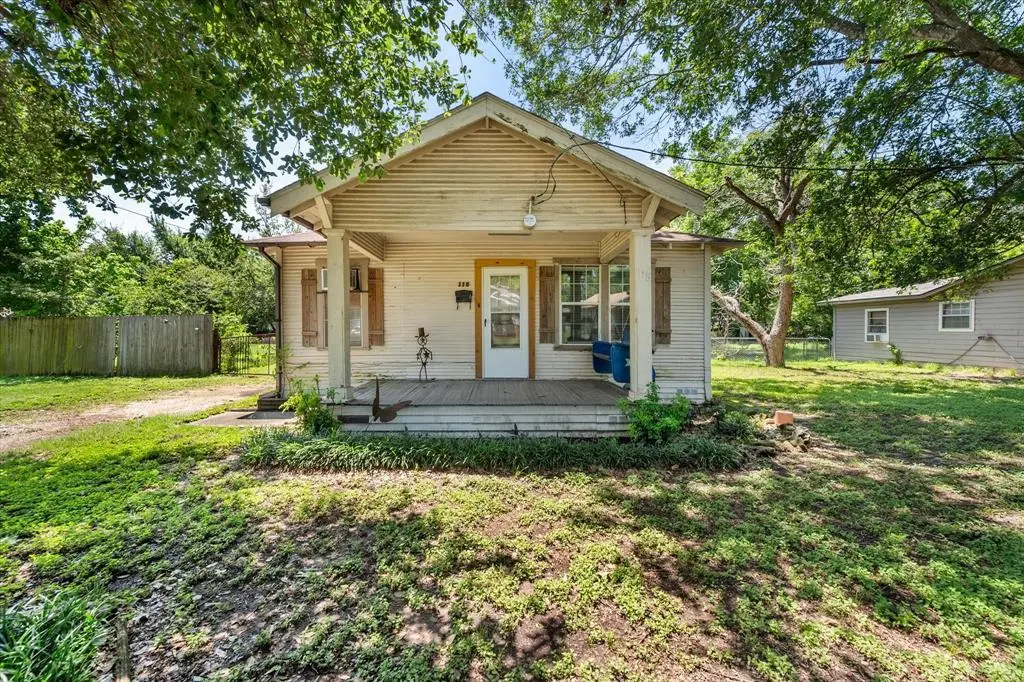
115 Woodland Ave · Corsicana, TX
Flood risk 1/10 · Minimal
- FEMA flood zone
- X (unshaded)
- Chance of flooding over 30 yrs
- 0.0%
- Est. flood insurance / yr
- $507 – $1,088
Fire risk 5/10 · Moderate
- Est. fire insurance / yr
- $1,222 – $2,270
Heat risk 7/10 · Major
- Hot days now (above 109°F)
- 7 days/yr
- Hot days in 30 yrs
- 25 days/yr
Wind risk 6/10 · Moderate
- Chance of severe wind over 30 yrs
- 64.0%
Air-quality risk 2/10 · Minimal
- Unhealthy air days now
- 0 days/yr
- Unhealthy air days in 30 yrs
- 1 days/yr
Risk factors via First Street. Map © Google.
Why this score? — see what drove the C- grade
The composite is a weighted blend of 9 inputs, each scored 0–100. Each bar is that input's sub-score; the figure is the points it added to the 100-point composite (weight × sub-score).
- Cash flow +19.5/30.0
- ARV discount +9.9/15.0
- DSCR +6.2/10.0
- 1% rule +5.1/10.0
- Livability +3.6/5.0
- Schools +3.2/10.0
- Condition / age +2.5/5.0
- Rent growth +2.1/5.0
- Appreciation +0.0/10.0
$137,000
🖨 Deal sheet 📄 Offer letter ✓ Due diligence
Listing remarks
Charming 3-Bedroom Home on Double Lot with Workshop & Storage Galore! Full of character and unique features, this adorable 3-bedroom, 1-bathroom home sits on a spacious double lot just under half an acre. Step inside to discover built-ins, offering both charm and practical storage. The updated kitchen features ample cabinet space and a warm, inviting atmosphere. Outside, you'll find a detached double garage with an attached workshop and tons of storage—perfect for hobbies or extra space. The additional lot next door provides endless possibilities, whether you're looking to add a carport, storage shed, or simply enjoy the extra yard space. With some TLC, this gem is ready to shin
Key facts
- Extra yard space
- Double lot
- Workshop
Tags
Property features AI
Finance
- HOA & community: No association (no HOA)
Exterior
- Parking: Covered parking for 2 vehicles; Driveway; On-site parking; Garage with 2 car spaces
- Utilities: City water; City sewer; Not in a municipal utility district
- Home design: Single-family residence; Residential property; Single-story; Multiple parcel (multi-parcel)
- Construction: Built in 1950; Siding exterior; Composition roof; Pillar/post/pier foundation
- Exterior features: Back yard fencing; Few trees; Large grassy backyard
Interior
- Kitchen: Built-in cabinets; Dishwasher
- Bedrooms: Three bedrooms (all on the main level)
- Flooring: Hardwood flooring; Laminate flooring
- Bathrooms: One full bathroom
- Heating & cooling: Central air; Wall/window unit(s)
- Interior features: Built-in features; Seven total rooms; One living area; One dining area; One level (single-story)
Neighborhood map
What this means for you Summary
Snapshot
- This is a 3-bed/1.0-bath single-family listed at $137k.
Deal economics
- At list price, monthly cash flow is $156 ($2k/yr) — positive.
- The deal already cash-flows at list — no discount required.
- Meets the 1% rule at list price ($1k rent vs $137k).
- Recommended offer: $133k (3.0% below list) — sets the bar for market timing.
- Cap rate 7.7% vs local median 4.5% in Corsicana — top-decile yield for the area; either an underpriced asset or a hidden risk that comps aren't pricing in. Stress-test before assuming the spread holds.
Location & tenants
- Location reads 71/100 on livability (#283 in TX) — a middle-class / working-renter tenant base. Strengths: cost of living A+, housing A+, health & safety A+; Watch: amenities D, schools F, crime F.
- Corsicana ISD (town): math 39% / reading 37% proficiency, ranked #471 of 826 in TX (top 57%) — families likely to look elsewhere, expect single-tenant / working-renter base with shorter leases; 65% free/reduced lunch — lower-income household profile, screen leases tightly.
- Market conditions: Rents soft (-1.5%/yr); 268 active listings in the ZIP; 1 comparable units currently listed for rent nearby; 522 units permitted in Navarro County in 2024 (0 in 5+ unit buildings).
Forward outlook
- Local home prices are declining (-3.0%/yr); year-one equity from $947 of loan paydown is wiped out by about $4k of value loss. Plan a longer hold.
- Navarro County population projected to shrink 4% by 2050 — rents likely to lag national; underwrite the cash flow, not the appreciation.
Negotiation context
- It's been on market 44 days — a 3% lower offer ($133k) is reasonable based on typical stale-listing flexibility.
- 3 sale attempts since 2y ago with the ask held roughly flat each time — persistent listings suggest the price (not the market) is what's stuck; bring a comps-based counter.
Risks & watch-outs
- Watch-outs: built in 1950 — expect roof / HVAC / electrical / plumbing capex.
- Climate carrying-cost: major wind risk, 64% chance of damaging wind over 30y; moderate wildfire risk; extreme-heat days projected 7→25/yr by 2055 (HVAC capex compounding) — expect insurance premiums to compound above CPI over the hold.
Questions for the listing agent
- It's been on market 44 days. Have you received any prior offers? Is the seller open to a 3% concession, seller financing, or rate buy-down credit?
- Built in 1950 — when were the roof, HVAC, electrical panel, plumbing, and water heater last replaced?
- Is there a deadline driving the sale (1031 exchange, divorce, estate, relocation)? That informs how much negotiation room exists.
- Schools are F-rated, which usually means shorter tenancies and higher turnover. Who's the typical renter profile here, and what's been the actual vacancy rate?
- Crime grade is F in this area — have there been break-ins, vandalism, or insurance claims at this property in the last 3 years? What carrier currently insures it and at what premium?
- What's the average days-on-market for RENTAL listings here right now (not sales)? A rising rental-DOM trend means longer vacancies and softer asking-rent achievability than the comps imply.
- What's the recent tenant-quality profile in this submarket — average credit score on applications, eviction rate, late-payment / NSF rate, and stable-employment percentage? A property-management company in the area should have these aggregated.
- How much new for-sale + rental construction is in the pipeline within 1–3 miles? Heavy new supply typically softens prices + rents 12–24 months out; constrained supply supports both.
Investment metrics
- 1% rule
- 1.01% ✓
- Cap rate
- 7.66%
- Cash-on-cash
- 4.87%
- DSCR
- 1.22
- GRM
- 8.3
CMA / ARV
- ARV (median comp)
- $144,827
- List price
- $137,000
- Delta
- -5.40%
- Verdict
- FAIR
- Comps
- 20 within 1.0 mi
Show comp detail 8 sales within ~0.75 mi
| Address | Dist | Beds/Ba | Sqft | Sold | Price | $/sf | Match |
|---|---|---|---|---|---|---|---|
| 1302 Ann Arbor Dr | 0.41mi | 3/1.0 | 1,024 (+6%) | 2mo | $187,500 | $183 | 70 |
| 104 Woodland Ave | 0.06mi | 3/2.0 | 1,064 (+10%) | 14mo | $189,999 | $179 | 65 |
| 808 N Commerce St | 0.28mi | 3/1.0 | 1,033 (+7%) | 14mo | $95,000 | $92 | 64 |
| 110 E Rob Ave | 0.05mi | 3/1.0 | 1,096 (+13%) | 16mo | $155,000 | $141 | 62 |
| 2408 Morris Dr | 0.51mi | 3/2.0 | 894 (-8%) | 1mo | $204,950 | $229 | 59 |
| 230 Gorman St | 0.60mi | 2/1.0 (-1) | 1,000 (+3%) | 17mo | $125,000 | $125 | 48 |
| 516 N 9th St | 0.73mi | 2/1.0 (-1) | 952 (-2%) | 23mo | $159,000 | $167 | 40 |
| 627 N Commerce St | 0.63mi | 3/2.0 | 1,074 (+11%) | 22mo | $208,000 | $194 | 30 |
Match score weights: distance 35% · size 25% · config 20% · recency 20%. Top-matched comps best support the ARV.
Projected returns pro-forma
-3.0% appreciation · 0.0% rent growth · sell at horizon
- IRR
- -12.1%
- Equity multiple
- 0.57×
- Total profit
- $-16,325
- Equity at exit
- $20,427
- IRR
- -8.2%
- Equity multiple
- 0.56×
- Total profit
- $-17,038
- Equity at exit
- $11,845
Cash invested: $38,360 (down + closing). Projections, not guarantees.
Landlord ↔ Tenant lean methodology
- Overall (STATE)
- 87 Strongly Landlord-Friendly
- State Texas
- 87 Strongly Landlord-Friendly · R+5
- County
- — inherits STATE
- City
- — inherits STATE
ZIP-level market 75110
- Rents YoY
- -1.5%
- Active inventory
- 268
- Price-to-rent
- 8.3×
Monthly cashflow live
- Estimated rent
- $1,381 medium interval (Pro) →
- Mortgage (P&I)
- −$718
- Tax from tax record
- −$160 /mo · $1,915/yr
- Insurance
- −$57
- HOA
- −$0
- Vacancy / Maint / Mgmt
- −$290
- Net cashflow
- $156
Break-even live
UW: 25.0% down · 7.5% · 30yr · 1.5% tax · 5.0% vac · 8.0% maint · 8.0% mgmt
Financing live
Cash to close
- Down payment
- $34,250
- Closing costs
- $4,110
- Reserves months
- —
- Total cash needed
- —
Loan-product check · same deal, 3 products live
Conventional
25% down · 7.5% · 30yr
- Down + closing
- —
- Monthly P&I
- —
- Monthly cashflow
- —
- DSCR
- —
- Eligible?
- —
Personal DTI + credit; lowest rate.
DSCR
20% down · 8.5% · 30yr
- Down + closing
- —
- Monthly P&I
- —
- Monthly cashflow
- —
- DSCR
- —
- Eligible?
- —
No personal income docs; deal must DSCR.
Hard money
10% down · 12.0% · 12mo
- Down + closing
- —
- Monthly P&I
- —
- Monthly cashflow
- —
- DSCR
- —
- Eligible?
- —
Short-term bridge; refi at stabilization.
Rent comps 1 comps
| Address | Beds | Baths | Sqft | Rent | $/sqft | DOM | Units | Dist |
|---|---|---|---|---|---|---|---|---|
| 1306 Liveoak Ave Corsicana, TX | 3.0 | 1.0 | 1080 | $1,300 | $1.20 | 5d | 1 | 0.99mi |
Listing history 22 events
-
2026-06-19days on market $137,000 Active 44 DOM
-
2026-06-18days on market $137,000 Active 43 DOM
-
2026-06-17days on market $137,000 Active 42 DOM
-
2026-06-16days on market $137,000 Active 41 DOM
-
2026-06-15days on market $137,000 Active 40 DOM
-
2026-06-14days on market $137,000 Active 38 DOM
-
2026-06-12days on market $137,000 Active 37 DOM
-
2026-06-09days on market $137,000 Active 34 DOM
-
2026-06-08days on market $137,000 Active 33 DOM
-
2026-06-07days on market $137,000 Active 32 DOM
-
2026-06-02days on market $137,000 Active 27 DOM
-
2026-06-01days on market $137,000 Active 26 DOM
-
2026-05-31days on market $137,000 Active 25 DOM
-
2026-05-30days on market $137,000 Active 24 DOM
-
2026-05-06$137,000 Active 758-char remark
-
2025-08-11price $150,000
-
2025-06-17$155,000 Active
-
2025-03-04historical
-
2024-12-18price $165,000
-
2024-06-11price $169,900
-
2024-03-13$181,000 Active
-
1989-02-20soldstatus
ⓘ Source: listings_history table (triggers on properties + properties_extension) + one-shot
backfill from property_details.listing_events for pre-trigger history.
Tax reassessment forecast TX · Resets to sale price
- Current annual tax
- $1,915 · $160/mo
- Projected year-2 tax
- $2,507 · $209/mo
- Expected delta
- +$592/yr (+$49/mo · 30.9%)
ⓘ Screening estimate from a state-policy table — verify with the county assessor before closing.
Climate risk First Street
- Flood 1/10 Low FEMA zone X (unshaded) · 0% chance over 30 yrs
- Wildfire 5/10 Major
- Heat 7/10 Severe 7 d/yr ≥109°F today · 25 d/yr by 30 yrs out
- Wind 6/10 Major 64% chance of damaging wind over 30 yrs
- Air quality 2/10 Low 0 unhealthy d/yr today · 1 by 30 yrs out
Nearby sold comps map
Loading sold comps map…
Walkable amenities ~0.75 mi
Loading nearby amenities…
Taxation est. · year 1
- Rental income
- $16,567
- − Mortgage interest
- −$7,674
- − Property taxes
- −$1,915
- − Insurance
- −$685
- − Repairs & maintenance
- −$1,325
- − Management
- −$1,325
- − Depreciation
- −$3,985
- Taxable loss
- −$343
- Est. tax savings @ 24.0%
- +$82
- After-tax cash flow
- $1,949/yr
For passive investors: Depreciation is non-cash, so a rental often shows a tax loss while cash-flowing — sheltering income. Rental losses are passive: they offset passive income freely, and up to $25,000/yr can offset ordinary (W-2) income if you actively participate and your MAGI is under $100k (phasing out to $0 by $150k); unused losses carry forward. On sale, claimed depreciation is recaptured at up to 25%, and gains may owe capital-gains tax (a 1031 exchange can defer both). Figures are a year-1 estimate at your 24.0% rate — not tax advice; consult a CPA.
Schools (NCES district)
- District
- Corsicana ISD
- NCES district ID
- 4815330
- Math proficiency
- 39% ▼ -9.00%
- Reading proficiency
- 37% ▬ 0.00%
- Median HH income
- $39,948
- Composite
- 31.89/100
- National rank
- #5862
- State rank
- #471 of 826 in TX
Livability — Corsicana
- Score
- 71/100
- State rank
- #283
- US rank
- #6570
Category grades
Schools grade is shown separately in the Schools card above.
Census & demographics
- Census place
- Corsicana, TX
- County
- Navarro County · 31,552 people
- City population
- 31,552
- Metro
- Corsicana, TX
- Population (ZIP)
- 31,552
- Household income
- $57,370
- Rent vs Own
- Severe rent burden
- 663.0
Population outlook (Navarro County) Hauer SSP2
- Today (2025)
- 48,397 people
- By 2030
- 48,096 · -0.6%
- By 2040
- 47,394 · -2.1%
- By 2050
- 46,541 · -3.8%
- By 2075
- 44,940 · -7.1%
- By 2100
- 42,288 · -12.6%
Race, ethnicity, and origin ACS 2023
- Neighborhood character
- Diverse neighborhood (Simpson 0.68)
- Race & ethnicity
- White 41% Hispanic / Latino 37% Two or more races 16% Black 13% Pacific Islander 2% Asian 1%
- Hispanic origin (detail)
- Mexican 34%
- Common ancestry
- Lithuanian 2% Slovak 1% Romanian 1%
- Foreign-born
- 17% · Canada
- Languages at home
- 68% English-only · Spanish 29% Other Asian/Pacific 2%
Political lean MEDSL · Navarro
- 2024 margin
- Solid R (+51.8) · D 23.7% · R 75.6%
- 2008→2024 swing
- -18.7pp toward R · 2008: -33.1pp · 2024: -51.8pp
- All cycles
- 2024: R+51.8 2020: R+45.5 2016: R+48.8 2012: R+42.4 2008: R+33.1
Not yet ingested
- Civics
- —
Market trends
- HPI YoY
- ▼ -248.01%
- Current HPI
- 224.5566
- Rent YoY
- ▼ -1.47%
- Metro
- Corsicana, TX
- State GDP YoY
- ▲ 3.95%
- F500 in state
- 110
Industry mix (Fortune 500 HQ in TX)
| Industry | F500 HQs | Revenue |
|---|---|---|
| Energy | 16 | $1,198B |
|
||
| Technology | 5 | $198B |
|
||
| Engineering / Construction | 4 | $72B |
|
||
| Energy Services | 3 | $60B |
|
||
| Utilities | 3 | $41B |
|
||
| Healthcare | 2 | $330B |
|
||
Price history
-24.3% since first listed8 events — show timeline
- 2026-05-06 Listed $137,000 NTREIS
- 2025-08-11 Price Changed $150,000 NTREIS
- 2025-06-17 Listed $155,000 NTREIS
- 2025-03-04 Listing Removed — NTREIS
- 2024-12-18 Price Changed $165,000 NTREIS
- 2024-06-11 Price Changed $169,900 NTREIS
- 2024-03-13 Listed $181,000 NTREIS
- 1989-02-20 Sold (Public Records) — Public Records
Property tax history
+8.8%/yrLatest (2025): $1,915 · +12.7% YoY. Source: county tax records.
Cash-flow waterfall
monthlySold comps — $/sqft
last 12 mo · ≤1 miLoading sold comps…