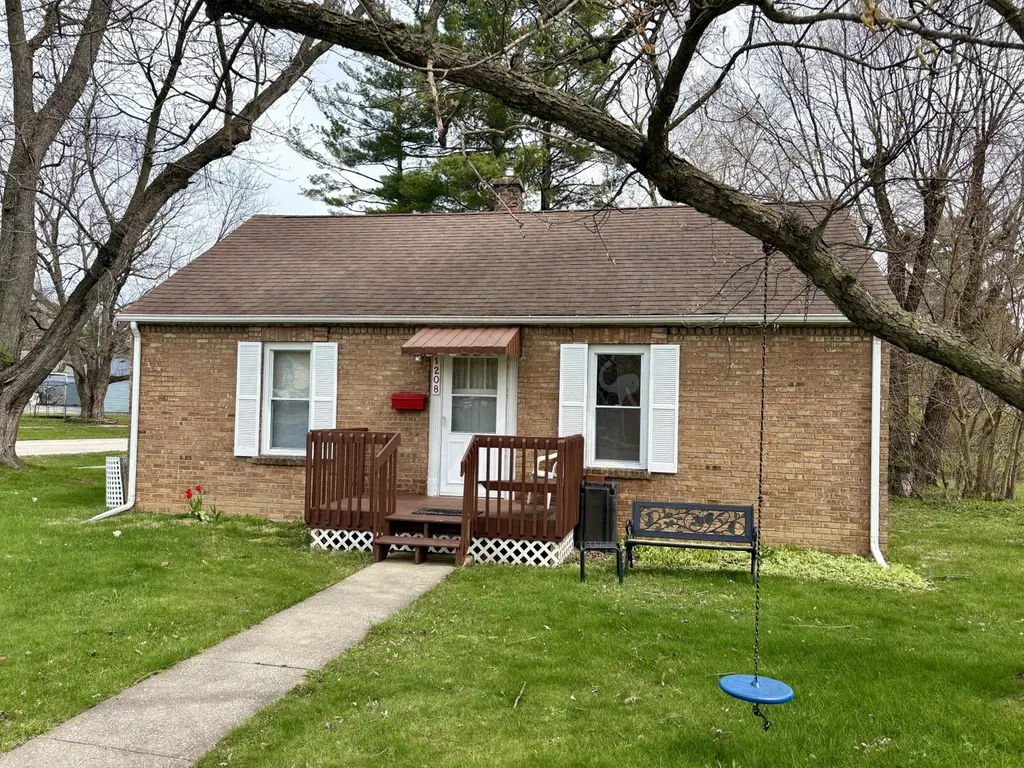
1208 Lafayette St · Valparaiso, IN
Flood risk 1/10 · Minimal
- FEMA flood zone
- X (unshaded)
- Chance of flooding over 30 yrs
- 0.0%
- Est. flood insurance / yr
- $473 – $860
Fire risk 2/10 · Minimal
- Est. fire insurance / yr
- $717 – $1,331
Heat risk 2/10 · Minimal
- Hot days now (above 99°F)
- 7 days/yr
- Hot days in 30 yrs
- 16 days/yr
Wind risk 2/10 · Minimal
- Chance of severe wind over 30 yrs
- —
Air-quality risk 2/10 · Minimal
- Unhealthy air days now
- 1 days/yr
- Unhealthy air days in 30 yrs
- 2 days/yr
Risk factors via First Street. Map © Google.
Why this score? — see what drove the C- grade
The composite is a weighted blend of 9 inputs, each scored 0–100. Each bar is that input's sub-score; the figure is the points it added to the 100-point composite (weight × sub-score).
- ARV discount +15.0/15.0
- Cash flow +13.7/30.0
- Schools +5.2/10.0
- DSCR +4.2/10.0
- Livability +4.1/5.0
- Rent growth +3.4/5.0
- 1% rule +2.6/10.0
- Condition / age +2.5/5.0
- Appreciation +0.0/10.0
$169,900
🖨 Deal sheet 📄 Offer letter ✓ Due diligence
Listing remarks
Charming brick ranch with great potential! This 2-bedroom, 1-bath home with a full unfinished basement sits on a corner lot and offers off-street parking. While the home does need some updates and repairs, it's a fantastic opportunity for investors, flippers, or buyers looking to build equity and make it their own. The durable brick exterior adds timeless curb appeal. With a little vision and work, this property could truly shine! Short distance to downtown Valpo! Seller's agent is related to seller.
Key facts
- Off-street parking
- Corner lot
- 8,375 sq ft lot
Tags
Property features AI
Finance
- Other: Property listed in fixer condition
Exterior
- Parking: Off-street parking on gravel
- Utilities: Public water; Public sewer
- Home design: One-story brick home; Built in 1947
- Construction: Brick construction; Shingle roof; Has basement
- Exterior features: Porch; Neighborhood view; Shed(s)
Interior
- Kitchen: Gas range; Refrigerator
- Bedrooms: Primary bedroom; Second bedroom
- Flooring: Hardwood; Other
- Bathrooms: 1 full bathroom
- Heating & cooling: Natural gas heating; Central air conditioning; Ceiling fan(s)
- Interior features: Ceiling fans
- Laundry & utility: Washer; Dryer; Basement with storage space and sump pump
Neighborhood map
What this means for you Summary
Snapshot
- This is a 2-bed/1.5-bath single-family listed at $170k.
Deal economics
- At list price, monthly cash flow is $13 ($161/yr) — positive.
- The deal already cash-flows at list — no discount required.
- To meet the 1% rule (rent ≥ 1% of price), the offer needs to be $128k (24.5% below list).
- Recommended offer: $128k (24.5% below list) — sets the bar for 1% rule.
- Cap rate 6.4% vs local median 2.8% in Valparaiso — top-decile yield for the area; either an underpriced asset or a hidden risk that comps aren't pricing in. Stress-test before assuming the spread holds.
Location & tenants
- Location reads 82/100 on livability (#12 in IN, #1,149 nationally) — a professional / high-income tenant draw. Strengths: schools A+, crime A+, cost of living A+; Watch: amenities D-, commute F.
- Valparaiso Community Schools (suburban): math 56% / reading 64% proficiency, ranked #18 of 301 in IN (top 6%) — acceptable for families but not a draw, mixed tenant base, ~2y average lease.
- Market conditions: Rents rising (+3.5%/yr); 257 active listings in the ZIP; 31 comparable units currently listed for rent nearby; rentals at typical pace (median 15d on market — plan ~3-4 weeks tenant-placement turnaround); solid renter incomes; 542 units permitted in Porter County in 2024 (0 in 5+ unit buildings).
Forward outlook
- Local home prices are declining (-3.0%/yr); year-one equity from $1k of loan paydown is wiped out by about $5k of value loss. Plan a longer hold.
- Porter County population projected at +6% by 2050 — modest demand growth; plan on rents tracking national, not racing it.
Negotiation context
- Only 5 days on market — expect competitive offers; lowballing is unlikely to land.
- 2 sale attempts since 28y ago; this cycle's ask has dropped $10k (6%) from the opening price — seller is motivated, your offer sets the floor, not the list.
Risks & watch-outs
- Watch-outs: built in 1947 — expect roof / HVAC / electrical / plumbing capex.
Questions for the listing agent
- Built in 1947 — when were the roof, HVAC, electrical panel, plumbing, and water heater last replaced?
- Is there a deadline driving the sale (1031 exchange, divorce, estate, relocation)? That informs how much negotiation room exists.
- Schools are A-rated — typically a magnet for longer-tenancy family renters. What's the average tenant stay here, and is there a school-zone premium baked into asking?
- What's the average days-on-market for RENTAL listings here right now (not sales)? A rising rental-DOM trend means longer vacancies and softer asking-rent achievability than the comps imply.
- What's the recent tenant-quality profile in this submarket — average credit score on applications, eviction rate, late-payment / NSF rate, and stable-employment percentage? A property-management company in the area should have these aggregated.
- How much new for-sale + rental construction is in the pipeline within 1–3 miles? Heavy new supply typically softens prices + rents 12–24 months out; constrained supply supports both.
Investment metrics
- 1% rule
- 0.76% ✗
- Cap rate
- 6.39%
- Cash-on-cash
- 0.34%
- DSCR
- 1.02
- GRM
- 11.0
CMA / ARV
- ARV (median comp)
- $215,365
- List price
- $169,900
- Delta
- -21.11%
- Verdict
- UNDERPRICED
- Comps
- 20 within 1.0 mi
Show comp detail 6 sales within ~0.75 mi
| Address | Dist | Beds/Ba | Sqft | Sold | Price | $/sf | Match |
|---|---|---|---|---|---|---|---|
| 1208 Lafayette St | 0.00mi | 2/1.0 | 759 (0%) | 0mo | $157,000 | $207 | 98 |
| 301 Mckinley St | 0.25mi | 3/1.0 (+1) | 768 (+1%) | 2mo | $180,000 | $234 | 78 |
| 701 Lafayette St | 0.42mi | 2/1.0 | 750 (-1%) | 18mo | $165,000 | $220 | 61 |
| 607 Madison St | 0.53mi | 2/1.0 | 864 (+14%) | 3mo | $215,000 | $249 | 48 |
| 204 Fair St | 0.21mi | 3/1.0 (+1) | 672 (-12%) | 22mo | $238,000 | $354 | 46 |
| 608 Oak St | 0.73mi | 2/1.0 | 665 (-12%) | 11mo | $190,000 | $286 | 34 |
Match score weights: distance 35% · size 25% · config 20% · recency 20%. Top-matched comps best support the ARV.
Projected returns pro-forma
-3.0% appreciation · 3.52% rent growth · sell at horizon
- IRR
- -15.3%
- Equity multiple
- 0.45×
- Total profit
- $-26,090
- Equity at exit
- $25,333
- IRR
- -6.2%
- Equity multiple
- 0.60×
- Total profit
- $-19,177
- Equity at exit
- $14,690
Cash invested: $47,572 (down + closing). Projections, not guarantees.
Landlord ↔ Tenant lean methodology
- Overall (STATE)
- 90 Strongly Landlord-Friendly
- State Indiana
- 90 Strongly Landlord-Friendly · R+11
- County
- — inherits STATE
- City
- — inherits STATE
ZIP-level market 46383
- Rents YoY
- 3.5%
- Active inventory
- 257
- Price-to-rent
- 11.0×
Monthly cashflow live
- Estimated rent
- $1,283 high interval (Pro) →
- Mortgage (P&I)
- −$891
- Tax from tax record
- −$38 /mo · $458/yr
- Insurance
- −$71
- HOA
- −$0
- Vacancy / Maint / Mgmt
- −$269
- Net cashflow
- $13
Break-even live
UW: 25.0% down · 7.5% · 30yr · 1.5% tax · 5.0% vac · 8.0% maint · 8.0% mgmt
Financing live
Cash to close
- Down payment
- $42,475
- Closing costs
- $5,097
- Reserves months
- —
- Total cash needed
- —
Loan-product check · same deal, 3 products live
Conventional
25% down · 7.5% · 30yr
- Down + closing
- —
- Monthly P&I
- —
- Monthly cashflow
- —
- DSCR
- —
- Eligible?
- —
Personal DTI + credit; lowest rate.
DSCR
20% down · 8.5% · 30yr
- Down + closing
- —
- Monthly P&I
- —
- Monthly cashflow
- —
- DSCR
- —
- Eligible?
- —
No personal income docs; deal must DSCR.
Hard money
10% down · 12.0% · 12mo
- Down + closing
- —
- Monthly P&I
- —
- Monthly cashflow
- —
- DSCR
- —
- Eligible?
- —
Short-term bridge; refi at stabilization.
Rent comps 31 comps
| Address | Beds | Baths | Sqft | Rent | $/sqft | DOM | Units | Dist |
|---|---|---|---|---|---|---|---|---|
| 705 Napoleon St Valparaiso, IN | 2.0 | 1.0 | 900 | $1,400 | $1.56 | 43d | 1 | 0.40mi |
| 101 E Chicago St Valparaiso, IN | 1.0 | 1.0 | 700 | $1,175 | $1.68 | 43d | 1 | 0.71mi |
| 103 E Chicago St Apt 7 Valparaiso, IN | 1.0 | 1.0 | 700 | $1,175 | $1.68 | 18d | 1 | 0.72mi |
| 1005 McCord Rd Valparaiso, IN | 2.0 | 1.0 | 770 | $1,464 | $1.90 | 1d | 2 | 0.72mi |
| 1101 Evans Ave Valparaiso, IN | 1.0 | 1.0 | 700 | $1,000 | $1.43 | 43d | 1 | 0.74mi |
| 1103 Evans Ave Valparaiso, IN | 2.0 | 1.0 | 750 | $1,350 | $1.80 | 15d | 1 | 0.75mi |
| 1103 Evans Ave Unit 4C Valparaiso, IN | 2.0 | 1.0 | 750 | $1,350 | $1.80 | 17d | 1 | 0.75mi |
| 1103 Evans Ave Valparaiso, IN | 2.0 | 1.0 | 750 | $1,250 | $1.67 | 43d | 1 | 0.75mi |
| 1103 Evans Ave Unit 3C Valparaiso, IN | 2.0 | 1.0 | 850 | $1,250 | $1.47 | 12d | 1 | 0.75mi |
| 1103 Evans Ave Unit 6B Valparaiso, IN | 2.0 | 1.0 | 750 | $1,300 | $1.73 | 12d | 1 | 0.75mi |
| 1105 Evans Ave Unit 1C Valparaiso, IN | 1.0 | 1.0 | 700 | $1,000 | $1.43 | 12d | 1 | 0.79mi |
| 453 Golfview Blvd Valparaiso, IN | 1.0–2.0 | 1.0–2.0 | 805 | $1,698 | $2.11 | 1d | 15 | 0.82mi |
| 217 E Lincolnway Valparaiso, IN | 1.0 | 1.0 | 530 | $1,411 | $2.66 | 12d | 1 | 0.85mi |
| 217 E Lincolnway Valparaiso, IN | 1.0 | 1.0 | 530 | $1,411 | $2.66 | 24d | 1 | 0.85mi |
| 52 College Ave Unit 1-4 Valparaiso, IN | 1.0 | 1.0 | 650 | $900 | $1.38 | 12d | 1 | 0.95mi |
| 52 College Ave Valparaiso, IN | 1.0 | 1.0 | 650 | $995 | $1.53 | 24d | 1 | 0.96mi |
| 54 College Ave Unit 3-2 Valparaiso, IN | 1.0 | 1.0 | 650 | $995 | $1.53 | 24d | 1 | 0.96mi |
| 207 Monroe St Unit B Valparaiso, IN | 1.0 | 1.0 | 800 | $975 | $1.22 | 24d | 1 | 0.99mi |
| 405 Monroe St Valparaiso, IN | 1.0 | 1.0 | 600 | $900 | $1.50 | 1d | 1 | 1.01mi |
| 1302 Eisenhower Ave Valparaiso, IN | 2.0–3.0 | 2.0 | 1134 | $1,697 | $1.50 | 1d | 5 | 1.08mi |
| 603 Union St Unit 3 Valparaiso, IN | 1.0 | 1.0 | 750 | $1,125 | $1.50 | 43d | 1 | 1.20mi |
| 927 Hampton Ct Valparaiso, IN | 2.0 | 2.0 | 1100 | $1,240 | $1.13 | 43d | 1 | 1.21mi |
| 926 Hampton Ct Valparaiso, IN | 2.0 | 1.0 | 900 | $1,180 | $1.31 | 43d | 1 | 1.25mi |
| 1710 Vale Park Rd Valparaiso, IN | 2.0–3.0 | 1.0–1.5 | 1054 | $1,345 | $1.28 | 1d | 2 | 1.29mi |
| 1807 Beech St Valparaiso, IN | 2.0 | 1.0 | 900 | $1,225 | $1.36 | 1d | 1 | 1.29mi |
| 1401 Laporte Ave Valparaiso, IN | 2.0 | 2.0 | 907 | $1,699 | $1.87 | 18d | 1 | 1.30mi |
| 1401 Laporte Ave Valparaiso, IN | 2.0 | 2.0 | 907 | $1,699 | $1.87 | 24d | 1 | 1.30mi |
| 1615 Firestone Ln Valparaiso, IN | 1.0 | 1.0 | 850 | $1,200 | $1.41 | 3d | 1 | 1.33mi |
| 1901 Wood St Valparaiso, IN | 1.0 | 1.0 | 885 | $1,100 | $1.24 | 1d | 1 | 1.37mi |
| 18 South St Valparaiso, IN | 2.0 | 1.0 | 960 | $1,375 | $1.43 | 1d | 1 | 1.37mi |
| 451 Brookshire Dr Valparaiso, IN | 2.0 | 1.0 | 960 | $1,200 | $1.25 | 1d | 1 | 1.47mi |
Listing history 4 events
-
2026-05-09status Pending 505-char remark
-
2026-05-06price $169,900 505-char remark
-
2026-05-04$179,900 Active 505-char remark
-
1998-01-07$72,900
ⓘ Source: listings_history table (triggers on properties + properties_extension) + one-shot
backfill from property_details.listing_events for pre-trigger history.
Tax reassessment forecast IN · Partial reset (capped growth)
- Current annual tax
- $458 · $38/mo
- Projected year-2 tax
- $951 · $79/mo
- Expected delta
- +$493/yr (+$41/mo · 107.5%)
ⓘ Screening estimate from a state-policy table — verify with the county assessor before closing.
Climate risk First Street
- Flood 1/10 Low FEMA zone X (unshaded) · 0% chance over 30 yrs
- Wildfire 2/10 Low
- Heat 2/10 Low 7 d/yr ≥99°F today · 16 d/yr by 30 yrs out
- Wind 2/10 Low
- Air quality 2/10 Low 1 unhealthy d/yr today · 2 by 30 yrs out
Nearby sold comps map
Loading sold comps map…
Walkable amenities ~0.75 mi
Loading nearby amenities…
Taxation est. · year 1
- Rental income
- $15,393
- − Mortgage interest
- −$9,517
- − Property taxes
- −$458
- − Insurance
- −$850
- − Repairs & maintenance
- −$1,231
- − Management
- −$1,231
- − Depreciation
- −$4,943
- Taxable loss
- −$2,837
- Est. tax savings @ 24.0%
- +$681
- After-tax cash flow
- $842/yr
For passive investors: Depreciation is non-cash, so a rental often shows a tax loss while cash-flowing — sheltering income. Rental losses are passive: they offset passive income freely, and up to $25,000/yr can offset ordinary (W-2) income if you actively participate and your MAGI is under $100k (phasing out to $0 by $150k); unused losses carry forward. On sale, claimed depreciation is recaptured at up to 25%, and gains may owe capital-gains tax (a 1031 exchange can defer both). Figures are a year-1 estimate at your 24.0% rate — not tax advice; consult a CPA.
Schools (NCES district)
- District
- Valparaiso Community Schools
- NCES district ID
- 1811970
- Math proficiency
- 56% ▼ -9.00%
- Reading proficiency
- 64% ▼ -6.00%
- Median HH income
- $56,736
- Composite
- 51.69/100
- National rank
- #1691
- State rank
- #18 of 301 in IN
Livability — Valparaiso
- Score
- 82/100
- State rank
- #12
- US rank
- #1149
Category grades
Schools grade is shown separately in the Schools card above.
Census & demographics
- Census place
- Valparaiso, IN
- County
- Porter County · 151,647 people
- City population
- 83,039
- Metro
- Chicago-Naperville-Elgin, IL-IN-WI
- Population (ZIP)
- 42,183
- Household income
- $76,224
- Rent vs Own
- Severe rent burden
- 1478.0
Population outlook (Porter County) Hauer SSP2
- Today (2025)
- 177,804 people
- By 2030
- 181,552 · +2.1%
- By 2040
- 185,830 · +4.5%
- By 2050
- 187,498 · +5.5%
- By 2075
- 189,585 · +6.6%
- By 2100
- 183,722 · +3.3%
Race, ethnicity, and origin ACS 2023
- Neighborhood character
- Predominantly White (84%)
- Race & ethnicity
- White 84% Hispanic / Latino 9% Two or more races 6% Black 2% Asian 1%
- Hispanic origin (detail)
- Mexican 6%
- Common ancestry
- Romanian 9% Lithuanian 3% Slovak 3%
- Foreign-born
- 4% · Canada
- Languages at home
- 95% English-only · Spanish 3%
Political lean MEDSL · Porter
- 2024 margin
- R (+10.5) · D 43.8% · R 54.3% · Other 1.8%
- 2008→2024 swing
- -17.7pp toward R · 2008: 7.2pp · 2024: -10.5pp
- All cycles
- 2024: R+10.5 2020: R+6.1 2016: R+6.8 2012: D+3.8 2008: D+7.2
Not yet ingested
- Civics
- —
Market trends
- HPI YoY
- ▼ -151.84%
- Current HPI
- 197.9925
- Rent YoY
- ▲ 3.52%
- Metro
- Chicago-Naperville-Elgin, IL-IN-WI
- State GDP YoY
- ▲ 2.90%
- F500 in state
- 18
Industry mix (Fortune 500 HQ in IN)
| Industry | F500 HQs | Revenue |
|---|---|---|
| Industrial Machinery | 2 | $37B |
|
||
| Healthcare | 1 | $177B |
|
||
| Pharmaceuticals | 1 | $45B |
|
||
| Metals / Steel | 1 | $18B |
|
||
| Agriculture | 1 | $17B |
|
||
| Packaging | 1 | $12B |
|
||
Price history
+115.4% since first listed5 events — show timeline
- 2026-06-15 Sold (MLS) $157,000 NIRA MLS as Distributed by MLS Grid
- 2026-05-09 Pending — NIRA MLS as Distributed by MLS Grid
- 2026-05-06 Price Changed $169,900 NIRA MLS as Distributed by MLS Grid
- 2026-05-04 Listed $179,900 NIRA MLS as Distributed by MLS Grid
- 1998-01-07 Listed $72,900 NIRA MLS as Distributed by MLS Grid
Property tax history
-0.7%/yrLatest (2024): $458 · +2.0% YoY. Source: county tax records.
Cash-flow waterfall
monthlySold comps — $/sqft
last 12 mo · ≤1 miLoading sold comps…