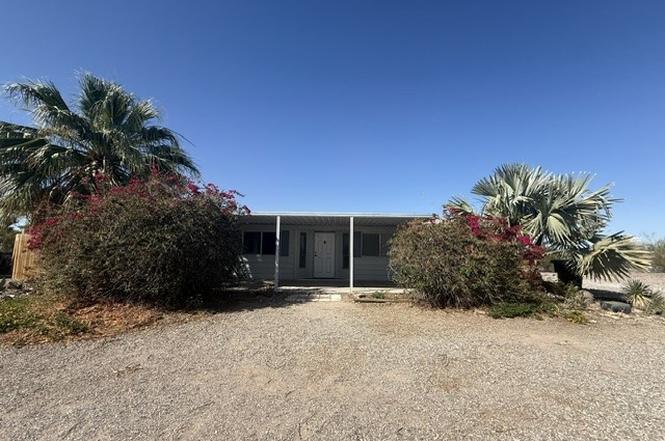
149322 Huasna Trl · Big River, CA
Flood risk 1/10 · Minimal
- FEMA flood zone
- D
- Chance of flooding over 30 yrs
- 0.0%
- Est. flood insurance / yr
- $544 – $1,084
Fire risk 4/10 · Minor
- Est. fire insurance / yr
- $659 – $1,223
Heat risk 10/10 · Severe
- Hot days now (above 116°F)
- 7 days/yr
- Hot days in 30 yrs
- 17 days/yr
Wind risk 1/10 · Minimal
- Chance of severe wind over 30 yrs
- —
Air-quality risk 1/10 · Minimal
- Unhealthy air days now
- 0 days/yr
- Unhealthy air days in 30 yrs
- 0 days/yr
Risk factors via First Street. Map © Google.
Why this score? — see what drove the B- grade
The composite is a weighted blend of 9 inputs, each scored 0–100. Each bar is that input's sub-score; the figure is the points it added to the 100-point composite (weight × sub-score).
- Cash flow +28.7/30.0
- DSCR +10.0/10.0
- Appreciation +8.6/10.0
- 1% rule +8.0/10.0
- Livability +3.4/5.0
- Rent growth +2.5/5.0
- Condition / age +2.5/5.0
- Schools +2.3/10.0
- ARV discount +0.0/15.0
$125,000
🖨 Deal sheet (PDF) 📄 Offer letter ✓ Due diligence
Listing remarks MLS
Very well maintained 3 Bedroom 2 bath home with carport. Large lot backing up to a wash landscaped and also a 10x12 storage shed. Inside features a large kitchen with island gas stove top. Separate Dinning room and large Living room. Bedrooms feature walk in closets and a garden tub in the master bath. Located on leased land with the current lease thru 2029.
Key facts
- Ample cabinetry
- Spacious kitchen
- Large yard
Tags
Property features AI
Finance
- Other: Lot reported as 0-1 unit/acre; Living area source: seller; Year built source: public records; No common walls; Total units: 1; Parcel number on record
- Financial info: Land lease of $100 annually (land lease renews January 1, 2029)
- HOA & community: Rural community
Exterior
- Parking: Gravel driveway; Covered parking; Carport
- Utilities: Septic tank sewer; Electricity connected; Public/District water
- Home design: Single-story house; One-level entry; Has a view; No ADU
- Construction: Composition roof; House structure
- Exterior features: Covered patio/porch; Chain link fencing; No pool
Interior
- Kitchen: Refrigerator; Propane oven; Propane stove; Range/stove hood; Dishwasher; Water heater unit
- Bedrooms: Main floor primary bedroom; Three bedrooms on the main level
- Bathrooms: Two full bathrooms; Master bathroom with double sinks and jetted tub; Shower-in-tub in a bathroom
- Heating & cooling: Central furnace heating; Central cooling
- Interior features: Ceiling fan; Open floor plan; Formica counters; Kitchen island
- Laundry & utility: Inside laundry
Neighborhood map
What this means for you Summary
Snapshot
- This is a 3-bed/2.0-bath manufactured listed at $125k.
Deal economics
- At list price, monthly cash flow is $417 ($5k/yr) — positive.
- The deal already cash-flows at list — no discount required.
- Meets the 1% rule at list price ($2k rent vs $125k).
Location & tenants
- Location reads 67/100 on livability (#327 in CA) — a middle-class / working-renter tenant base. Strengths: cost of living A+, housing A+, crime B; Watch: health & safety C-, employment D, schools F.
- Needles Unified (town): math 22% / reading 28% proficiency, ranked #1,194 of 1,400 in CA (top 85%) — low school quality limits family demand, transient renter base, plan for 1-2y turnover; 68% free/reduced lunch — lower-income household profile, screen leases tightly.
- Market conditions: 33 active listings in the ZIP; 5,458 units permitted in San Bernardino County in 2024 (1,500 in 5+ unit buildings).
Forward outlook
- In year one you build about $10k of equity ($864 loan paydown + $9k appreciation (7.3% local appreciation)).
- San Bernardino County population projected at +15% by 2050 — modest demand growth; plan on rents tracking national, not racing it.
- At projected returns (7.3% appreciation + 3.0% rent growth), your $35k cash investment doubles in ~3 years — after that, you're playing with house money.
- By year 4, paydown + projected appreciation supports a ~$34k cash-out refi (75% LTV) — recoverable capital for the next deal without selling this one.
Negotiation context
- Only 8 days on market — expect competitive offers; lowballing is unlikely to land.
- 7 sale attempts since 19y ago with the ask held roughly flat each time — persistent listings suggest the price (not the market) is what's stuck; bring a comps-based counter.
- Current owner paid $42k; list at $125k implies a 194% gain — meaningful room to come down on a strong offer.
Risks & watch-outs
- Climate carrying-cost: extreme-heat days projected 7→17/yr by 2055 (HVAC capex compounding) — expect insurance premiums to compound above CPI over the hold.
Questions for the listing agent
- Built in 1974 — when were the roof, HVAC, electrical panel, plumbing, and water heater last replaced?
- Is there a deadline driving the sale (1031 exchange, divorce, estate, relocation)? That informs how much negotiation room exists.
- Schools are F-rated, which usually means shorter tenancies and higher turnover. Who's the typical renter profile here, and what's been the actual vacancy rate?
- What's the average days-on-market for RENTAL listings here right now (not sales)? A rising rental-DOM trend means longer vacancies and softer asking-rent achievability than the comps imply.
- What's the recent tenant-quality profile in this submarket — average credit score on applications, eviction rate, late-payment / NSF rate, and stable-employment percentage? A property-management company in the area should have these aggregated.
- How much new for-sale + rental construction is in the pipeline within 1–3 miles? Heavy new supply typically softens prices + rents 12–24 months out; constrained supply supports both.
Investment metrics
- 1% rule
- 1.30% ✓
- Cap rate
- 10.29%
- Cash-on-cash
- 14.29%
- DSCR
- 1.64
- GRM
- 6.4
CMA / ARV
- ARV (on-the-fly)
- $93,800
- Comps found
- 6
Show comp detail 6 sales within ~0.75 mi
| Address | Dist | Beds/Ba | Sqft | Sold | Price | $/sf | Match |
|---|---|---|---|---|---|---|---|
| 149153 Snoqualmie Trl | 0.24mi | 2/2.0 (-1) | 1,440 (+3%) | 13mo | $80,000 | $56 | 68 |
| 7285 Kaniksu Trl | 0.63mi | 2/2.0 (-1) | 1,440 (+3%) | 12mo | $50,000 | $35 | 51 |
| 7272 Nokomis | 0.36mi | 2/2.0 (-1) | 1,296 (-7%) | 20mo | $99,900 | $77 | 49 |
| 7305 Pahaska Trl | 0.68mi | 2/2.0 (-1) | 1,440 (+3%) | 18mo | $89,000 | $62 | 44 |
| 7351 Nokomis Trl | 0.40mi | 2/2.0 (-1) | 1,194 (-15%) | 15mo | $120,000 | $101 | 39 |
| 149143 Concho Ct | 0.48mi | 2/2.0 (-1) | 1,248 (-11%) | 22mo | $83,300 | $67 | 36 |
Match score weights: distance 35% · size 25% · config 20% · recency 20%. Top-matched comps best support the ARV.
Projected returns pro-forma
7.26% appreciation · 3.0% rent growth · sell at horizon
- IRR
- 29.7%
- Equity multiple
- 3.06×
- Total profit
- $72,205
- Equity at exit
- $88,737
- IRR
- 27.0%
- Equity multiple
- 6.43×
- Total profit
- $189,895
- Equity at exit
- $170,513
Cash invested: $35,000 (down + closing). Projections, not guarantees.
Landlord ↔ Tenant lean methodology
- Overall (STATE)
- 18 Strongly Tenant-Friendly
- State California
- 18 Strongly Tenant-Friendly · D+13
- County
- — inherits STATE
- City
- — inherits STATE
ZIP-level market 92242
- Home prices YoY
- 4.1%
- Active inventory
- 33
- Price-to-rent
- 6.4×
Monthly cashflow live
- Estimated rent
- $1,621 medium interval (Pro) →
- Mortgage (P&I)
- −$656
- Tax est. 1.5%
- −$156 /mo · $1,875/yr
- Insurance
- −$52
- HOA
- −$0
- Vacancy / Maint / Mgmt
- −$340
- Net cashflow
- $417
Break-even live
Sensitivity live
| Price | -10% $503 | -5% $460 | +0% $417 | +5% $374 | +10% $330 |
|---|---|---|---|---|---|
| Rent | -10% $289 | -5% $353 | +0% $417 | +5% $481 | +10% $545 |
| Rate | -1.0pp $480 | -0.5pp $449 | base $417 | +0.5pp $384 | +1.0pp $351 |
UW: 25.0% down · 7.5% · 30yr · 1.5% tax · 5.0% vac · 8.0% maint · 8.0% mgmt
Financing live
Cash to close
- Down payment
- $31,250
- Closing costs
- $3,750
- Reserves months
- —
- Total cash needed
- —
Loan-product check · same deal, 3 products live
Conventional
25% down · 7.5% · 30yr
- Down + closing
- —
- Monthly P&I
- —
- Monthly cashflow
- —
- DSCR
- —
- Eligible?
- —
Personal DTI + credit; lowest rate.
DSCR
20% down · 8.5% · 30yr
- Down + closing
- —
- Monthly P&I
- —
- Monthly cashflow
- —
- DSCR
- —
- Eligible?
- —
No personal income docs; deal must DSCR.
Hard money
10% down · 12.0% · 12mo
- Down + closing
- —
- Monthly P&I
- —
- Monthly cashflow
- —
- DSCR
- —
- Eligible?
- —
Short-term bridge; refi at stabilization.
Listing history 8 events
-
2026-06-19days on market $125,000 Active 8 DOM
-
2026-06-18days on market $125,000 Active 7 DOM
-
2026-06-17days on market $125,000 Active 6 DOM
-
2026-06-16days on market $125,000 Active 5 DOM
-
2026-06-15days on market $125,000 Active 4 DOM
-
2026-06-14days on market $125,000 Active 2 DOM
-
2026-06-13remarks 699-char remark
-
2026-06-13$125,000 Active 1 DOM
ⓘ Source: listings_history table (triggers on properties + properties_extension) + one-shot
backfill from property_details.listing_events for pre-trigger history.
Climate risk First Street
- Flood 1/10 Low FEMA zone D · 0% chance over 30 yrs
- Wildfire 4/10 Moderate
- Heat 10/10 Extreme 7 d/yr ≥116°F today · 17 d/yr by 30 yrs out
- Wind 1/10 Low
- Air quality 1/10 Low 0 unhealthy d/yr today · 0 by 30 yrs out
Nearby sold comps map
Loading sold comps map…
Walkable amenities ~0.75 mi
Loading nearby amenities…
Taxation est. · year 1
- Rental income
- $19,452
- − Mortgage interest
- −$7,002
- − Property taxes
- −$1,875
- − Insurance
- −$625
- − Repairs & maintenance
- −$1,556
- − Management
- −$1,556
- − Depreciation
- −$3,636
- Taxable income
- $3,201
- Est. tax owed @ 24.0%
- −$768
- After-tax cash flow
- $4,233/yr
For passive investors: Depreciation is non-cash, so a rental often shows a tax loss while cash-flowing — sheltering income. Rental losses are passive: they offset passive income freely, and up to $25,000/yr can offset ordinary (W-2) income if you actively participate and your MAGI is under $100k (phasing out to $0 by $150k); unused losses carry forward. On sale, claimed depreciation is recaptured at up to 25%, and gains may owe capital-gains tax (a 1031 exchange can defer both). Figures are a year-1 estimate at your 24.0% rate — not tax advice; consult a CPA.
Schools (NCES district)
- District
- Needles Unified
- NCES district ID
- 0626760
- Math proficiency
- 22% ▼ -2.00%
- Reading proficiency
- 28% ▼ -1.00%
- Median HH income
- $31,795
- Composite
- 23.35/100
- National rank
- #13305
- State rank
- #1194 of 1400 in CA
Livability — Big River
- Score
- 67/100
- State rank
- #327
- US rank
- #11065
Category grades
Schools grade is shown separately in the Schools card above.
Census & demographics
- Census place
- Big River, CA
- Population (ZIP)
- 1,203
Population outlook (San Bernardino County) Hauer SSP2
- Today (2025)
- 2,300,329 people
- By 2030
- 2,378,907 · +3.4%
- By 2040
- 2,523,137 · +9.7%
- By 2050
- 2,642,388 · +14.9%
- By 2075
- 2,880,769 · +25.2%
- By 2100
- 2,909,436 · +26.5%
Race, ethnicity, and origin ACS 2023
- Neighborhood character
- Predominantly White (84%)
- Race & ethnicity
- White 84% Hispanic / Latino 12% Two or more races 9% Native American 2%
- Hispanic origin (detail)
- Mexican 10% Salvadoran 1%
- Common ancestry
- Romanian 5% Serbian 3% Lithuanian 3%
- Foreign-born
- 3% · Canada, Dominican Republic
- Languages at home
- 93% English-only · Spanish 6% German/W. Germanic 1%
Political lean MEDSL · San Bernardino
- 2024 margin
- Toss-up / Even · D 47.5% · R 49.7% · Other 2.8%
- 2008→2024 swing
- -8.5pp toward R · 2008: 6.3pp · 2024: -2.1pp
- All cycles
- 2024: R+2.1 2020: D+10.7 2016: D+9.8 2012: D+5.4 2008: D+6.3
Not yet ingested
- Civics
- —
Market trends
- HPI YoY
- ▲ 7.26%
- Current HPI
- 183.526
- Rent YoY
- —
- Metro
- —
- State GDP YoY
- ▲ 3.21%
- F500 in state
- 116
Industry mix (Fortune 500 HQ in CA)
| Industry | F500 HQs | Revenue |
|---|---|---|
| Technology | 27 | $1,492B |
|
||
| Financial Services | 3 | $174B |
|
||
| Retail | 3 | $44B |
|
||
| Insurance | 3 | $26B |
|
||
| Media / Entertainment | 2 | $115B |
|
||
| Pharmaceuticals / Biotech | 2 | $62B |
|
||
Price history
+212.5% since first listed11 events — show timeline
- 2026-06-11 Listed $125,000 CRMLS
- 2017-04-25 Sold (MLS) $42,500 WARDEX
- 2017-04-25 Sold (MLS) $42,500 LHAR
- 2017-03-06 Listed $42,500 WARDEX
- 2017-03-06 Listed $42,500 LHAR
- 2014-09-02 Listed $42,500 LHAR
- 2014-09-02 Listed $42,500 WARDEX
- 2008-01-04 Listing Removed — GPSMLS
- 2007-09-18 Listing Removed — GPSMLS
- 2007-08-03 Listed $50,000 GPSMLS
- 2007-08-03 Listed $40,000 GPSMLS
Property tax history
-2.5%/yrLatest (2022): $147 · -0.5% YoY. Source: county tax records.
Cash-flow waterfall
monthlySold comps — $/sqft
last 12 mo · ≤1 miLoading sold comps…