50 Yacht Cove Dr #230 · Hilton Head Island, SC
Flood risk No data
- FEMA flood zone
- —
- Chance of flooding over 30 yrs
- —
- Est. flood insurance / yr
- —
Fire risk No data
- Est. fire insurance / yr
- —
Heat risk No data
- Hot days now (above threshold)
- —
- Hot days in 30 yrs
- —
Wind risk No data
- Chance of severe wind over 30 yrs
- —
Air-quality risk No data
- Unhealthy air days now
- —
- Unhealthy air days in 30 yrs
- —
Risk factors via First Street. Map © Google.
Why this score? — see what drove the D grade
The composite is a weighted blend of 9 inputs, each scored 0–100. Each bar is that input's sub-score; the figure is the points it added to the 100-point composite (weight × sub-score).
- ARV discount +11.1/15.0
- Cash flow +7.9/30.0
- Appreciation +6.6/10.0
- Schools +4.1/10.0
- Rent growth +3.3/5.0
- Livability +3.2/5.0
- 1% rule +3.1/10.0
- Condition / age +2.5/5.0
- DSCR +1.9/10.0
$369,000
🖨 Deal sheet (PDF) 📄 Offer letter ✓ Due diligence
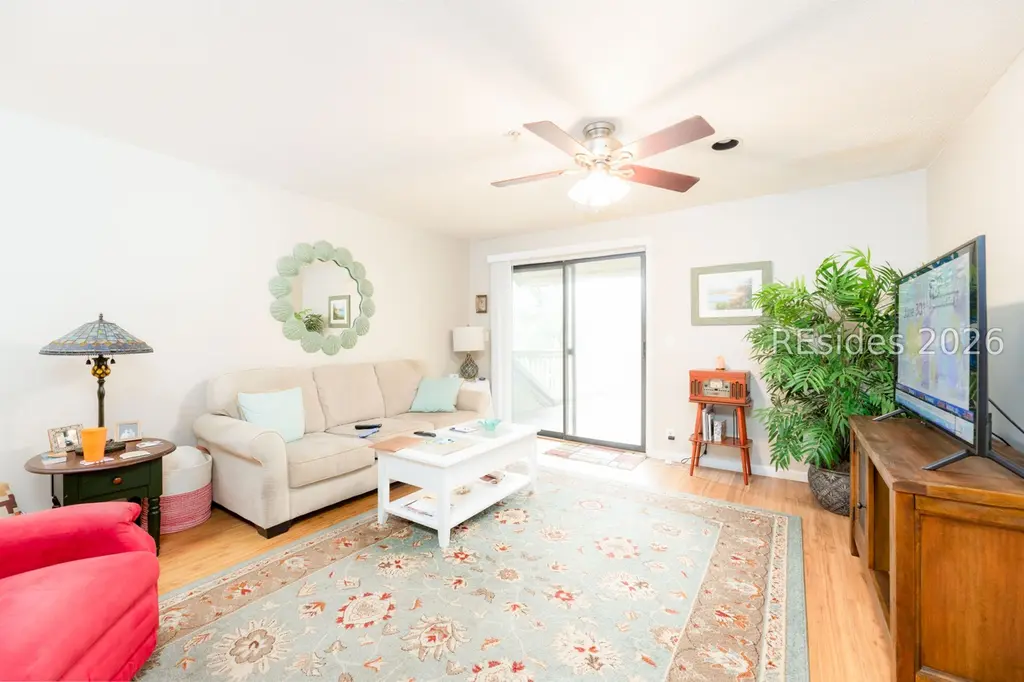
Listing remarks
Wow!! Top flοor, сornеr, 2 ΒR, 2 BA FLΑΤ in "the elevator building" at Wyndеmеre Villas! Granite countertops, wood floors, separate dining spaces, nice outdoor space and additional outside storage. Enjoy the ideal, mid-Island location which is convenient to everything! Shelter Cove is just a short walk or bike ride away. The perfect primary or the ideal Island getaway. Claim your piece of Island Paradise for under $400,000!
Key facts
- Corner
- Wood floors
- Outdoor space
Tags
Property features AI
Finance
- Other: Pets allowed (dogs OK; owner restrictions, number and size limits apply)
- HOA & community: Association management; Common area maintenance; Flood insurance included; Grounds maintenance; Structure maintenance; Pest control; Sewer included; Trash included; Water included; Community clubhouse; Community pool; Trails
Exterior
- Parking: Assigned parking
- Security: Closed-circuit cameras; Security guard
- Utilities: Public water
- Home design: Wood siding
- Construction: Asphalt roof; Wood siding construction
- Exterior features: Paved driveway; Porch; Rear porch; Storage; Community pool; Has view
Interior
- Kitchen: Dishwasher; Disposal; Microwave; Range; Refrigerator
- Flooring: Carpet; Ceramic tile; Wood
- Bathrooms: 2 full bathrooms
- Heating & cooling: Electric heating; Heat pump; Electric cooling; Heat pump cooling
- Interior features: Ceiling fans; Multiple closets; Cable TV ready; Unfinished walls
- Laundry & utility: Washer; Dryer
Neighborhood map
What this means for you Summary
Snapshot
- This is a 2-bed/2.0-bath condo listed at $369k.
Deal economics
- At list price, monthly cash flow is $-401 ($-5k/yr) — negative.
- The deal already cash-flows at list — no discount required.
- To meet the 1% rule (rent ≥ 1% of price), the offer needs to be $300k (18.8% below list).
- Recommended offer: $300k (18.8% below list) — sets the bar for 1% rule.
- Cap rate 5.0% vs local median 2.9% in Hilton Head Island — top-decile yield for the area; either an underpriced asset or a hidden risk that comps aren't pricing in. Stress-test before assuming the spread holds.
Location & tenants
- Location reads 64/100 on livability (#157 in SC) — a middle-class / working-renter tenant base. Strengths: employment A+, crime A-; Watch: amenities F, commute F, cost of living F.
- Beaufort 01 (town): math 42% / reading 51% proficiency, ranked #17 of 80 in SC (top 21%) — families likely to look elsewhere, expect single-tenant / working-renter base with shorter leases.
- Zoned schools: Hilton Head Island Elementary (math 50% / reading 49%, grade D, #168 of 597 statewide, top 31%, 709 students, 56% FRL); Hilton Head Island Middle (math 33% / reading 42%, grade F, #90 of 229 statewide, top 42%, 856 students, 52% FRL); Hilton Head Island High (math 70% / reading 82%, grade A-, #34 of 196 statewide, top 17%, 1,345 students, 40% FRL) — zoned schools at 49% FRL track the district average.
- Market conditions: Rents rising (+3.2%/yr); 845 active listings in the ZIP; 1 comparable units currently listed for rent nearby; solid renter incomes; 1,824 units permitted in Beaufort County in 2024 (618 in 5+ unit buildings).
- This rent runs 37% of the median local income ($98k/yr) — at the standard rent-burdened threshold; future hikes will face affordability resistance.
Forward outlook
- In year one you build about $14k of equity ($3k loan paydown + $12k appreciation (3.2% local appreciation)).
- Beaufort County population projected at +30% by 2050 — long-run rental-demand tailwind backs the buy-and-hold thesis.
- By year 3, paydown + projected appreciation supports a ~$36k cash-out refi (75% LTV) — recoverable capital for the next deal without selling this one.
Negotiation context
- It's been on market 61 days — a 6% lower offer ($347k) is reasonable based on typical stale-listing flexibility.
- 6 sale attempts since 23y ago; this cycle's ask has dropped $20k (5%) from the opening price — seller is motivated, your offer sets the floor, not the list.
- Current owner paid $124k; list at $369k implies a 196% gain — meaningful room to come down on a strong offer.
Questions for the listing agent
- What do current leases actually rent for vs. the listed asking? Can we see a recent rent roll and the last 12 months of T-12 income?
- It's been on market 61 days. Have you received any prior offers? Is the seller open to a 19% concession, seller financing, or rate buy-down credit?
- What does the HOA fee cover, when was the last increase, and are there any pending special assessments or reserve-fund shortfalls?
- Any open or pending special assessments — roof, HVAC, plumbing, elevator, façade? What's the per-unit balance and payoff schedule, and is the seller paying it off at close or rolling it to the buyer?
- Why hasn't it sold? Are there any deal-killer items the seller is aware of (foundation, flood, title, zoning, code violations)?
- Is there a deadline driving the sale (1031 exchange, divorce, estate, relocation)? That informs how much negotiation room exists.
- Schools are B-rated — typically a magnet for longer-tenancy family renters. What's the average tenant stay here, and is there a school-zone premium baked into asking?
- The area grade is low — what's the realistic commute time and amenity access for the typical tenant pool here? Any planned neighborhood developments (good or bad) we should know about?
- What's the average days-on-market for RENTAL listings here right now (not sales)? A rising rental-DOM trend means longer vacancies and softer asking-rent achievability than the comps imply.
- What's the recent tenant-quality profile in this submarket — average credit score on applications, eviction rate, late-payment / NSF rate, and stable-employment percentage? A property-management company in the area should have these aggregated.
- How much new apartment / multifamily construction is in the pipeline within 1–3 miles? Heavy new supply (>2% of stock underway) typically softens rents 12–24 months out; light construction supports rent growth.
Investment metrics
- 1% rule
- 0.81% ✗
- Cap rate
- 4.99%
- Cash-on-cash
- -4.65%
- DSCR
- 0.79
- GRM
- 10.3
CMA / ARV
- ARV (median comp)
- $401,401
- List price
- $369,000
- Delta
- -8.07%
- Verdict
- FAIR
- Comps
- 20 within 1.0 mi
Projected returns pro-forma
3.21% appreciation · 3.23% rent growth · sell at horizon
- IRR
- 4.0%
- Equity multiple
- 1.23×
- Total profit
- $23,868
- Equity at exit
- $170,245
- IRR
- 7.3%
- Equity multiple
- 2.13×
- Total profit
- $117,041
- Equity at exit
- $265,781
Cash invested: $103,320 (down + closing). Projections, not guarantees.
Landlord ↔ Tenant lean methodology
- Overall (STATE)
- 90 Strongly Landlord-Friendly
- State South Carolina
- 90 Strongly Landlord-Friendly · R+6
- County
- — inherits STATE
- City
- — inherits STATE
ZIP-level market 29928
- Home prices YoY
- 1.3%
- Rents YoY
- 3.2%
- Active inventory
- 845
- Price-to-rent
- 10.3×
Monthly cashflow live
- Estimated rent
- $2,998 medium interval (Pro) →
- Mortgage (P&I)
- −$1,935
- Tax from tax record
- −$211 /mo · $2,537/yr
- Insurance
- −$154
- HOA est. from 4 same-building comps
- −$469
- Vacancy / Maint / Mgmt
- −$630
- Net cashflow
- $-401
Break-even live
Sensitivity live
| Price | -10% $-192 | -5% $-296 | +0% $-401 | +5% $-505 | +10% $-610 |
|---|---|---|---|---|---|
| Rent | -10% $-638 | -5% $-519 | +0% $-401 | +5% $-282 | +10% $-164 |
| Rate | -1.0pp $-215 | -0.5pp $-307 | base $-401 | +0.5pp $-496 | +1.0pp $-594 |
UW: 25.0% down · 7.5% · 30yr · 1.5% tax · 5.0% vac · 8.0% maint · 8.0% mgmt
Financing live
Cash to close
- Down payment
- $92,250
- Closing costs
- $11,070
- Reserves months
- —
- Total cash needed
- —
Loan-product check · same deal, 3 products live
Conventional
25% down · 7.5% · 30yr
- Down + closing
- —
- Monthly P&I
- —
- Monthly cashflow
- —
- DSCR
- —
- Eligible?
- —
Personal DTI + credit; lowest rate.
DSCR
20% down · 8.5% · 30yr
- Down + closing
- —
- Monthly P&I
- —
- Monthly cashflow
- —
- DSCR
- —
- Eligible?
- —
No personal income docs; deal must DSCR.
Hard money
10% down · 12.0% · 12mo
- Down + closing
- —
- Monthly P&I
- —
- Monthly cashflow
- —
- DSCR
- —
- Eligible?
- —
Short-term bridge; refi at stabilization.
Rent comps 1 comps
| Address | Beds | Baths | Sqft | Rent | $/sqft | DOM | Units | Dist |
|---|---|---|---|---|---|---|---|---|
| 125 Shipyard Dr #148 Hilton Head Island, SC | 3.0 | 3.0 | 1400 | $3,200 | $2.29 | 45d | 1 | 1.49mi |
HOA detail condo
- Monthly dues
- $0 · $0/yr
- Assessments
- None detected in remarks — confirm with the listing agent.
Listing history 31 events
-
2026-06-21days on market $369,000 Active 61 DOM
-
2026-06-18days on market $369,000 Active 58 DOM
-
2026-06-17days on market $369,000 Active 57 DOM
-
2026-06-16days on market $369,000 Active 56 DOM
-
2026-06-15days on market $369,000 Active 55 DOM
-
2026-06-14days on market $369,000 Active 53 DOM
-
2026-06-13days on market $369,000 Active 52 DOM
-
2026-06-10days on market $369,000 Active 50 DOM
-
2026-06-09days on market $369,000 Active 49 DOM
-
2026-06-08days on market $369,000 Active 48 DOM
-
2026-06-07days on market $369,000 Active 47 DOM
-
2026-06-05days on market $369,000 Active 44 DOM
-
2026-06-03days on market $369,000 Active 43 DOM
-
2026-06-02days on market $369,000 Active 42 DOM
-
2026-06-01days on market $369,000 Active 41 DOM
-
2026-05-31days on market $369,000 Active 40 DOM
-
2026-05-08price $369,000 460-char remark
-
2026-04-21$389,000 Active 460-char remark
-
2025-11-18price $384,900
-
2025-09-29price $389,900
-
2025-08-12$397,500 Active
-
2023-08-28price $359,400
-
2023-06-22$367,800 Active
-
2016-06-17soldstatus $124,500
-
2016-06-15soldstatus $124,500
-
2016-05-05$139,900
-
2008-03-13$170,000
-
2004-04-06soldstatus $110,000
-
2004-03-10soldstatus $110,000
-
2003-11-21$114,500
-
1989-10-01soldstatus $89,900
ⓘ Source: listings_history table (triggers on properties + properties_extension) + one-shot
backfill from property_details.listing_events for pre-trigger history.
Tax reassessment forecast SC · Resets to sale price
- Current annual tax
- $2,537 · $211/mo
- Projected year-2 tax
- $2,537 · $211/mo
- Expected delta
- $0/yr ($0/mo · 0.0%)
ⓘ Screening estimate from a state-policy table — verify with the county assessor before closing.
Nearby sold comps map
Loading sold comps map…
Walkable amenities ~0.75 mi
Loading nearby amenities…
Taxation est. · year 1
- Rental income
- $35,977
- − Mortgage interest
- −$20,670
- − Property taxes
- −$2,537
- − Insurance
- −$1,845
- − Repairs & maintenance
- −$2,878
- − Management
- −$2,878
- − HOA
- −$5,628
- − Depreciation
- −$10,735
- Taxable loss
- −$11,194
- Est. tax savings @ 24.0%
- +$2,687
- After-tax cash flow
- $-2,123/yr
For passive investors: Depreciation is non-cash, so a rental often shows a tax loss while cash-flowing — sheltering income. Rental losses are passive: they offset passive income freely, and up to $25,000/yr can offset ordinary (W-2) income if you actively participate and your MAGI is under $100k (phasing out to $0 by $150k); unused losses carry forward. On sale, claimed depreciation is recaptured at up to 25%, and gains may owe capital-gains tax (a 1031 exchange can defer both). Figures are a year-1 estimate at your 24.0% rate — not tax advice; consult a CPA.
Schools (NCES district)
- District
- Beaufort 01
- NCES district ID
- 4501110
- Math proficiency
- 42% ▼ -8.00%
- Reading proficiency
- 51% ▲ 2.00%
- Median HH income
- $57,430
- Composite
- 40.56/100
- National rank
- #3699
- State rank
- #17 of 80 in SC
Livability — Hilton Head Island
- Score
- 64/100
- State rank
- #157
- US rank
- #14648
Category grades
Schools grade is shown separately in the Schools card above.
Census & demographics
- Census place
- Hilton Head Island, SC
- County
- Beaufort County · 163,770 people
- City population
- 40,243
- Metro
- Hilton Head Island-Bluffton, SC
- Population (ZIP)
- 15,785
- Household income
- $97,576
- Rent vs Own
- Severe rent burden
- 216.0
Population outlook (Beaufort County) Hauer SSP2
- Today (2025)
- 211,915 people
- By 2030
- 227,272 · +7.2%
- By 2040
- 253,861 · +19.8%
- By 2050
- 275,126 · +29.8%
- By 2075
- 311,022 · +46.8%
- By 2100
- 321,286 · +51.6%
Race, ethnicity, and origin ACS 2023
- Neighborhood character
- Predominantly White (87%)
- Race & ethnicity
- White 87% Hispanic / Latino 6% Two or more races 2% Black 2% Asian 1%
- Hispanic origin (detail)
- Mexican 3%
- Common ancestry
- Lithuanian 4% Slovak 4% Romanian 4%
- Foreign-born
- 9% · Canada, China
- Languages at home
- 91% English-only · Spanish 5% French/Haitian/Cajun 1% Chinese 1%
Political lean MEDSL · Beaufort
- 2024 margin
- R (+14.5) · D 42.1% · R 56.6% · Other 1.2%
- 2008→2024 swing
- -3.7pp toward R · 2008: -10.8pp · 2024: -14.5pp
- All cycles
- 2024: R+14.5 2020: R+10.0 2016: R+14.3 2012: R+17.5 2008: R+10.8
Not yet ingested
- Civics
- —
Market trends
- HPI YoY
- ▲ 3.21%
- Current HPI
- 243.4136
- Rent YoY
- ▲ 3.23%
- Metro
- Hilton Head Island-Bluffton, SC
- State GDP YoY
- ▲ 4.51%
- F500 in state
- 2
Industry mix (Fortune 500 HQ in SC)
| Industry | F500 HQs | Revenue |
|---|---|---|
| Packaging | 1 | $7B |
|
||
Price history
+310.5% since first listed15 events — show timeline
- 2026-05-08 Price Changed $369,000 RSMLS
- 2026-04-21 Listed $389,000 RSMLS
- 2025-11-18 Price Changed $384,900 RSMLS
- 2025-09-29 Price Changed $389,900 RSMLS
- 2025-08-12 Listed $397,500 RSMLS
- 2023-08-28 Price Changed $359,400 RSMLS
- 2023-06-22 Listed $367,800 RSMLS
- 2016-06-17 Sold (Public Records) $124,500 Public Records
- 2016-06-15 Sold (MLS) $124,500 RSMLS
- 2016-05-05 Listed $139,900 RSMLS
- 2008-03-13 Listed $170,000 RSMLS
- 2004-04-06 Sold (Public Records) $110,000 Public Records
- 2004-03-10 Sold (MLS) $110,000 RSMLS
- 2003-11-21 Listed $114,500 RSMLS
- 1989-10-01 Sold (Public Records) $89,900 Public Records
Property tax history
+7.9%/yrLatest (2025): $2,537 · +1.2% YoY. Source: county tax records.
Cash-flow waterfall
monthlySold comps — $/sqft
last 12 mo · ≤1 miLoading sold comps…